Back on April 4, the social media site Bluesky suffered a pretty big outage. I was delighted to discover that one of their engineers, Jim Calabro, published a public writeup about it: April 2026 Outage Post-Mortem.
Calabro’s post goes into a lot of technical details about the failure mode. I’m using this post as a learning exercise for myself. I find that if I have to explain something, then I’ll understand it better. After reading his post and writing this one, I learned things about ephemeral ports, goroutine groups, the TCP state machine, the interaction between blocking system calls and the creation of threads in the Go runtime, and the range of loopback addresses on Linux.
Interpreting the error message
The first thing that struck me is Calabro’s write-up was his discussion of a particular error message he saw in the logs:
dial tcp 127.32.0.1:0->127.0.0.1:11211: bind: address already in use
Now, if I was the one who saw the error message “bind: address already in use”, I would have assumed that a process was trying to listen on a port that another process was already listening on. This sort of thing is server-side behavior, where a server listens on a port (e.g., web servers listen on port 80 and port 443). In the connect attempt associated with the log, the server is listening on port 11211 (the standard port used by memcached). As it says on the Linux bind man page:
 EADDRINUSE
              The given address is already in use.
But that wasn’t the problem in this case! It wasn’t an issue with a server trying and failing to listen on port 11211. Instead, the problem is that the client, which is trying to make a connection to the memcached service, is failing to associate a socket with a port. The system call that’s failing is not listen but (as indicated in the error message) bind. That bind man page actually has two different entries for the address already in use error. Here’s the second one:
EADDRINUSE
              (Internet domain sockets) The port number was specified as
              zero in the socket address structure, but, upon attempting
              to bind to an ephemeral port, it was determined that all
              port numbers in the ephemeral port range are currently in
              use. See the discussion of
              /proc/sys/net/ipv4/ ip_local_port_range ip(7).
I assume that go’s net.Dial function ultimately calls this private dial function, which will call bind if the caller explicitly specifies the local address. In the log message above, the local address was 127.32.0.1:0.
This code was failing because there were no available ephemeral ports left!
I bring this up because Calabro simply mentions as an aside how he (correctly!) interpreted the error message. He just shows the error, and then writes (emphasis mine):
The timing of these log spikes lined up with drops in user-facing traffic, which makes sense. Our data plane heavily uses memcached to keep load off our main Scylla database, and if we’re exhausting ports, that’s a huge problem.
That’s expertise in action!
Saturation, part 1: ephemeral ports
The failure mode that Bluesky encountered is a classic example of saturation, where the system runs out of a critical resource. Calabro’s write-up covers two different time periods, a paging alert on Saturday April 4, and then the Bluesky outage that happened two days later, on Monday April 6. There were different flavors of saturation on the different days, here we’ll talk about the first one.
On Saturday, the limited resource in question was the number of available ephemeral ports. From a programming perspective, when we make calls to servers, we don’t think about the fact that our side of a TCP connection gets assigned a port, because this TCP detail is effectively abstracted away from the developer.
I’m running on macOS, but if I launch an Ubuntu Docker container, I can see that the ephemeral port range goes from 32768 to 60999, for a count of 28,232 available ephemeral ports:
$ sysctl net.ipv4.ip_local_port_rangenet.ipv4.ip_local_port_range = 32768 60999
The irony here is that the connections that exhausted the ephemeral ports were to a process that’s running on the same host: memcached listening on 127.0.0.1:11211.
Calabro goes into considerable detail about how the service they refer to as the data plane ran out of ephemeral ports. I’ll describe my understanding based on his write-up. But, as always, I recommend you read the original.
The data plane service talks to a database that is fronted by memcached. This incident only involved interactions between data plane and memcached, so I don’t show the database in the diagram below.
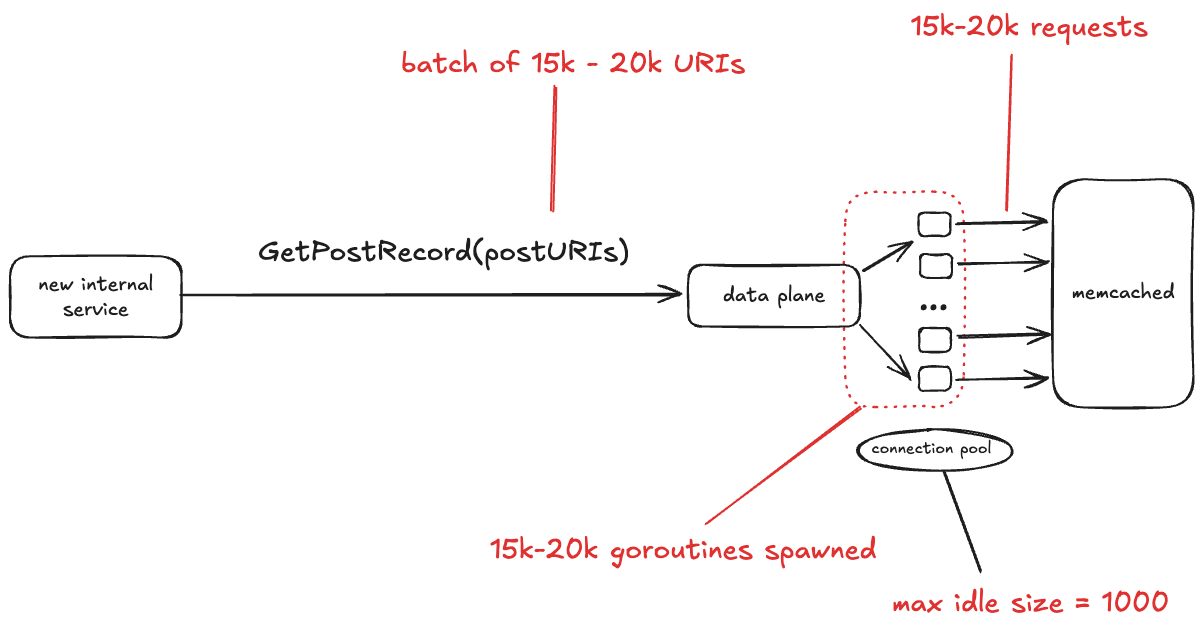
Bluesky recently brought up a new internal service. One of the things this service does is make the GetPostRecord RPC call against the data plane service. The problem isn’t with the rate of traffic. In fact, the volume of traffic that this internal service sends to data plane is low, less than 3 RPS.
No, the problem here is the size of the GetPostRecord payload. It sends a batch of URIs in each call, and sometimes those batches are very large, on the order of 15-20 thousand URIs.
The data plane looks up each URI in memcache first before hitting the database. The data plane is written in Go, and for each request, it starts a new goroutine, and each of those goroutines creates a new TCP connection to memcache. All of those goroutines concurrently making those TCP connections depleted the set of available ephemeral ports.
One thing I learned from this write-up is that Go has a notion of goroutine groups, you can explicitly set a limit of the number of goroutines that are active within a given group. Tragically, this was the one data plane endpoint that was missing an explicit limit.
The connection pool
In the write-up, Calabro notes that the memcached client uses a connection pool, with a maximum idle size of 1000 connections. I was initially confused by this, because I’m used to connection pools where the pool defines the maximum number of simultaneous active connections, and if no unused connections are available, then the client blocks waiting for a connection to be available.
I looked into this, and assuming that this app is using the gomemcache library, that’s not how its connection pool works. Instead, the gomemcache code first looks to see if there’s an available connection. If not, it creates a new connection. So, the connection pool here doesn’t bound connections, but rather is an optimization to reuse an existing connection if one is available.
Instead, what you specify with gomemcache is the maximum number of idle connections, which is the maximum number of connections that the pool will hold onto after use. As mentioned above, Bluesky had this configured as 1,000. This means that if there are 15,000 new connections requested concurrently, at best 1,000 connections will be reused from the pool, requiring 14,000 new connections to be established.
Bitten by time lags – TIME_WAIT
Time lags are underrated factor in incidents, and time lag plays a role here. In this case, the time lag is due to a state in the lifetime of a TCP socket called TIME_WAIT. This state renders a port unusable for a fixed period of time after a connection associated with the port has been closed.
Personally, I first encountered TIME_WAIT back when I was working on a web app on my laptop. Sometimes I’d kill the process and restart it, and the restart would fail with the error that the port it was trying to listen on was already in use. It turns out that the operating system does not immediately release the ports associated with a socket after it’s closed. Instead, the connection transitions to the TIME_WAIT state.
Here’s an explanation for why TIME_WAIT exists, based largely on the excellent article: TIME_WAIT and its design implications for protocols and scalable client server systems from ServerFramework.com.
The dropped ACK problem: sending an error when nothing is wrong
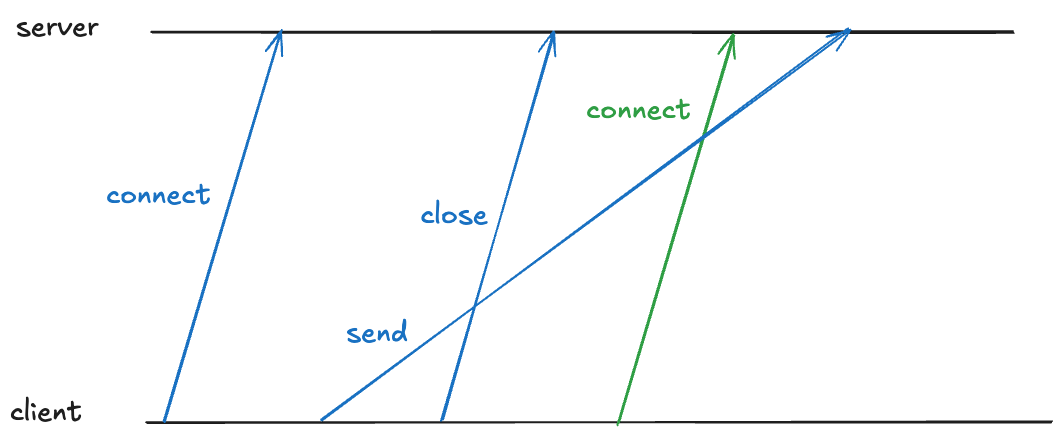
Closing a TCP requires each send side to send a FIN, and each side to ACK the received FIN. As each side sends or receives one of these packets, it transitions through the TCP state machine. Here’s what the exchange looks like. I’ve annotated the TCP states on the server side and the client side.
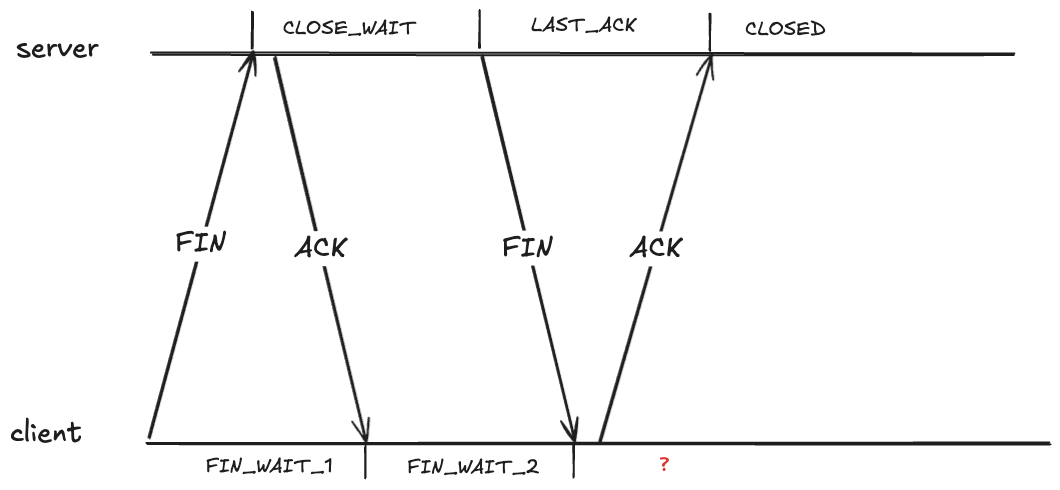
It looks like the client should also be in the CLOSED state after it receives the FIN. However, that creates a problem if the ACK it sends never makes it, because the server will eventually retry sending the FIN.
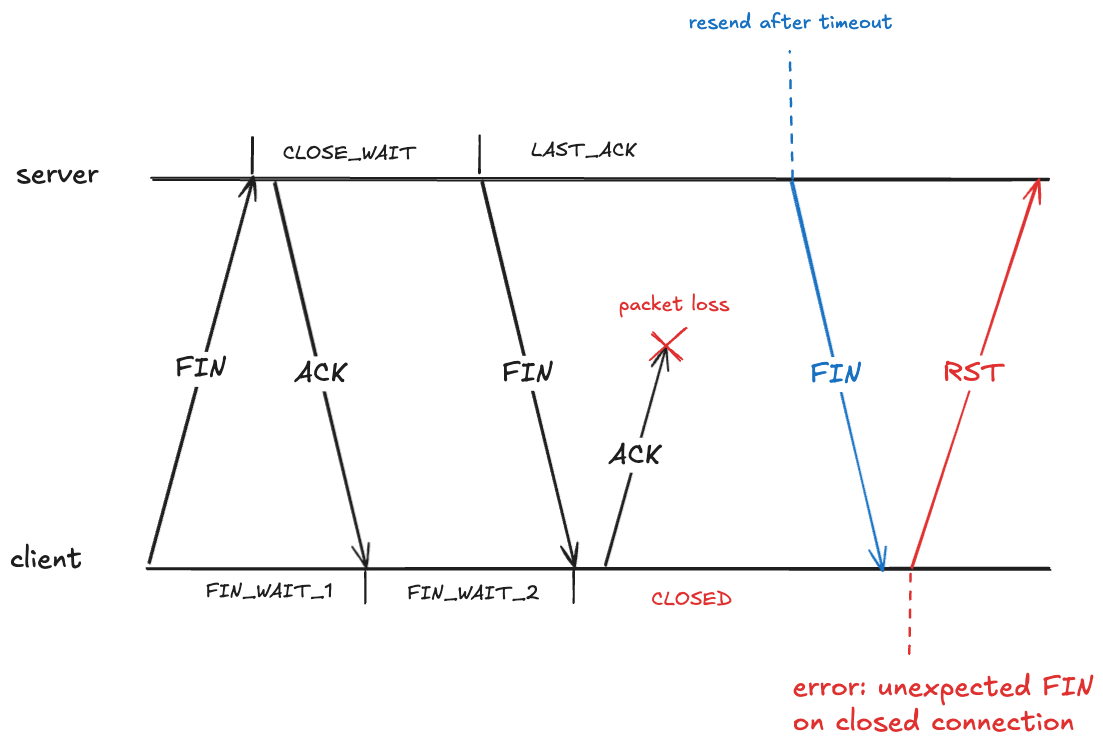
Here the client has received a packet associated with a TCP connection that has transitioned to the CLOSED state. The client will treat this as an error, and will send an RST packet (if you’ve ever seen the message: connection reset by peer, you’ve been on the receiving end of an RST packet).
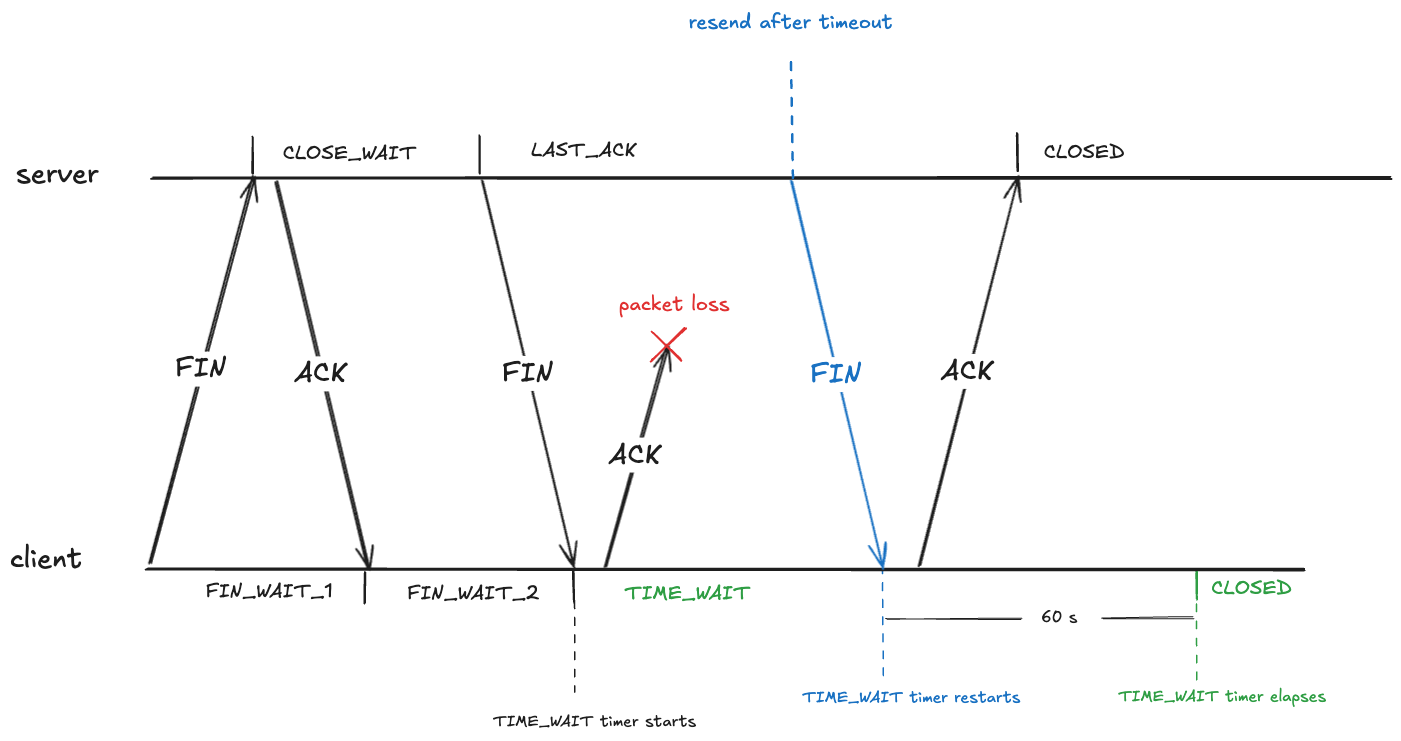
To prevent this, after sending an ACK in the FIN_WAIT_2, the client transitions into the TIME_WAIT state. From RFC-9293:
When a connection is closed actively, it MUST linger in the TIME-WAIT state for a time 2xMSL (Maximum Segment Lifetime)
The RFC doesn’t define what the maximum segment lifetime is. On Linux, the kernel waits in the TIME_WAIT state for about 60 seconds.
#define TCP_TIMEWAIT_LEN (60*HZ) /* how long to wait to destroy TIME-WAIT * state, about 60 seconds */
This means that the state of the TCP connection will be in the TIME_WAIT state for about a minute before transitioning to CLOSED:
The out of order problem: packet associated with wrong connection
TIME_WAIT also deals with a problem related to packets being received out of order.
Note that a TCP connection’s identity is determined by the four-tuple: (source IP, source port, destination IP, destination port). Here’s an example of such a four-tuple: (127.32.0.1, 32768, 127.0.0.1, 11211).
Because TCP packets can arrive out of order, there might still be packets in-flight associated with that connection. If a new TCP connection with the same four-tuple is opened, the receiver will incorrectly associate the packet with the new connection, even though it was part of the old one, as depicted below (here I’m simplifying the connect and close to a single packet rather than using three packets).
TIME_WAIT also prevents this by having the client enter TIME_WAIT that is long enough to guarantee that the sent packet is received before the new connection can be opened on the same port.
Eating up the ephemeral port space
Because you have to wait about a minute before you can reuse an ephemeral port, TIME_WAIT reduces the amount of available ephemeral ports.
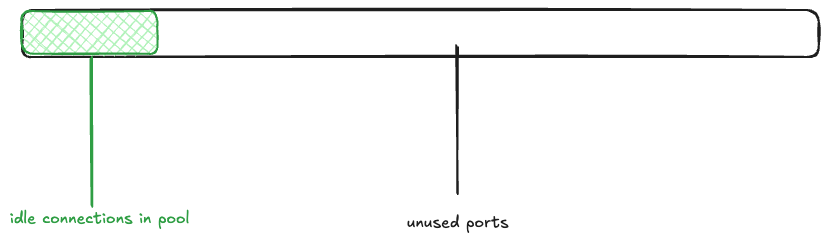
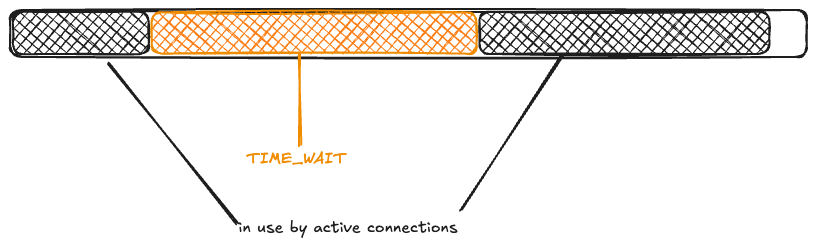
Returning to the Bluesky scenario, imagine that the memcached connection pool is fully populated (there are 1000 idle connections ready to be used), and the rest of the ephemeral ports are free. I’ll depict the space of 28,232 ephemeral ports as a rectangle, with the green rectangle indicating the connection pool.
Next, a wave of 15K connections are created. This takes all 1000 of the idle connections, and has to make 14K new connections.
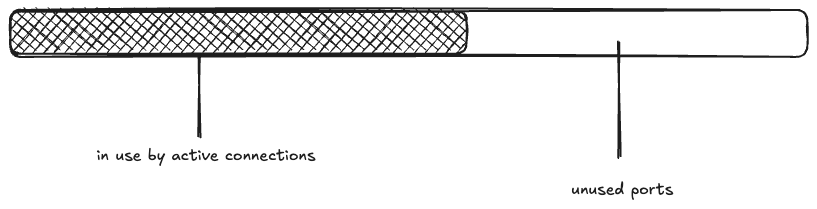
The maximum idle connections is set to 1000, so 1000 of the active connections get returned to the pool. The rest of the connections are closed, and eventually enter the TIME_WAIT state:
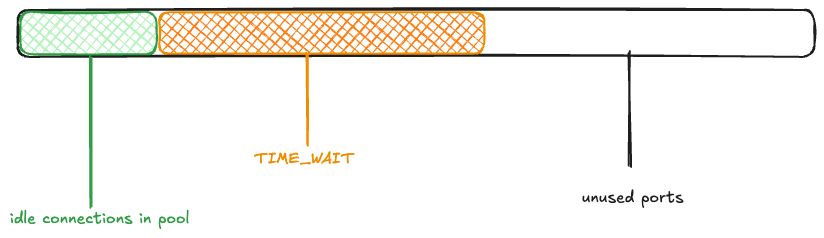
Now, another wave of connection requests comes in. Because the ephemeral ports are in use by TCP connections in the TIME_WAIT state, they’re unavailable:
Once again, 1000 connections get returned to the pool, and the rest enter TIME_WAIT.
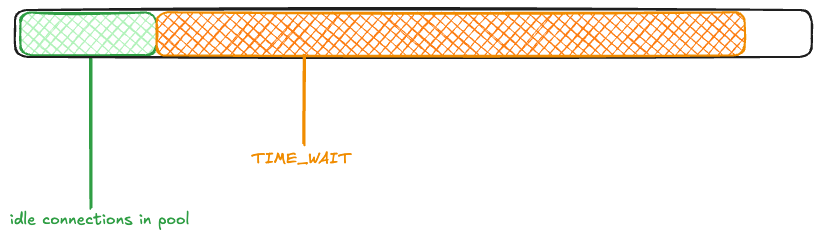
You can see how the ephemeral ports could be consumed if large numbers of connection requests came in one after another before the TIME_WAIT timer elapsed.
Saturation, part 2: memory
While Bluesky observed the problem with ephemeral port exhaustion on Saturday, it wasn’t until the Monday that they suffered from an outage.
From the write-up, it’s not clear to me what exactly changed on Monday. Perhaps it was just an organic increase in traffic that exacerbated the problem? Whatever it was, the ephemeral port exhaustion contributed to a cascading failure.

According to the write-up, the failure cascade went something like this:
- The ephemeral port exhaustion led to error messages when attempting to call memcached.
- Every memcached error resulted in a log line being written synchronously to disk.
- A large number of goroutines blocked in synchronous system calls led to the Go runtime spawning many OS-level threads (I learned that OS-level threads are called M in Go parlance).
- This large number of OS-level threads put memory pressure on the app.
- As a result, the data plane experienced stop-the-world GC pauses as well as OOM kills.
Note that because TIME_WAIT is an OS-level state, a data plane process that was OOM killed and restarted would still face limits on the ephemeral port space!
The workaround: leveraging multiple loopbacks
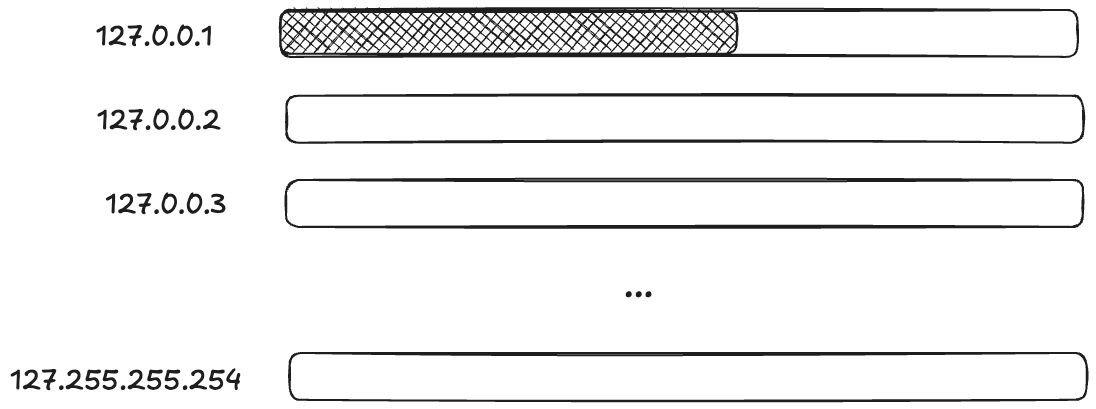
I was impressed by their improvised solution to deal with the problem. I’ve been talking about how an ephemeral port can be consumed, but it’s not actually the port itself. When calling the bind function, you provide not just a port, but the local IP address you want to bind to. It’s the (IP, port) pair that is limited, not the port.
So, if you want to create a TCP connection to a local process (like, say, memcache), and the pair (127.0.0.1,32768) is already in use, if there are other IP addresses that are loopback addresses, you can use those too!
On Linux, by default, all 128.*.*.* IP addresses are loopback address!
# ip route show table local
local 127.0.0.0/8 dev lo proto kernel scope host src 127.0.0.1
...
(Note that this is different from macOS, which only routes 127.0.0.1 via loopback by default).
This means that you potentially have access to a much larger space of ephemeral ports!
Applying terminology from resilience engineering, ephemeral ports are a resource, and you have to do work to marshal these additional resources.
For Bluesky, the work of marshaling resources came in the form of modifying the code that made the TCP connections. They modified it to randomly select a loopback IP address. Here’s the code from the blog post:
// Use a custom dialer that picks a random loopback IP for each connection.// This avoids ephemeral port exhaustion on a single IP when a container// restarts (TIME_WAIT sockets from the old process block the fixed IP).memcachedClient.DialContext = func(ctx context.Context, network, address string) (net.Conn, error) { ip := net.IPv4(127, byte(1+rand.IntN(254)), byte(rand.IntN(256)), byte(1+rand.IntN(254))) d := net.Dialer{LocalAddr: &net.TCPAddr{IP: ip}} return d.DialContext(ctx, network, address)}
Calabro’s describes the above change as:
The band-aid fix was insane but did the job.
I wouldn’t describe this is insane, though. This is exactly the kind of improvisational work that you frequently have to do in order to get a system back to healthy during the incident.
Diagnostic challenges
Calabro briefly discusses how difficult it was to diagnose the issue, emphasis mine:
It was all buried in there, but it was hard to know where to look when so much was falling over all at once. You need to have the mental discipline and high granularity in your metrics to be able to cut through the noise to find the real root cause. It’s hard work!
I wish there had been more in this writeup about the process the engineers went through to actually figure out what was going on during the incident, because descriptions of diagnostic work is one of my favorite parts of incident write-ups. We all can stand to do better at improving our diagnostic skills, and one way I try to improve is to read about how someone diagnosed an issue during an incident.
As Calabro mentions, during an incident, there are frequently many things that are failing, and it can be extremely hard to tease out the signals that will help you understand how the system first got into this state.
One particular challenge is noticing an error signal that happens to be unrelated to the ongoing incident, as happened during this incident (emphasis mine):
EDIT: Also, the status page said this was an issue with a 3rd party provider. It was clearly not, apologies for that miscommunication! At the time I posted that status page update, I was looking at some traceroutes that indicated some pretty substantial packet loss from a cloud provider to our data center, but those were not the root cause of the issue.
The messy 9
I want to end this post by bringing up the Messy 9, a set of patterns proposed by the resilience engineering researcher David Woods. These are:
- congestion
- cascades
- conflicts
- saturation
- lag
- friction
- tempos
- surprises
- tangles
I’ve explicitly discussed cascades, saturation, and lag in this post. I suspect that, if we had more detail about this incident, we’d identify even more of these patterns here. Keep on the look-out for these the next time you read an incident write-up or attend an incident review meeting!
