Over the years, mathematicians, logicians and computer scientists have developed various calculi. If you have a background in computer science, you’ve likely heard of the lambda calculus, a model of computation that was developed by Alonzo Church. If databases are more your thing, then you’ve been exposed to the relational calculus without even knowing it, since SQL is based on the relational calculus. If you are into formal methods, then you’ve worked with the predicate calculus, better known as first-order logic. Finally, if you enjoy reading academic papers on programming languages, you’ve almost certainly run into the sequent calculus. However, when someone says “calculus” without modification (e.g., “I’m taking calculus next semester”), there’s no ambiguity about which calculus they are referring to: it’s always one particular calculus. Or, rather, two calculi that happen to be deeply related to each other: differential calculus and integral calculus.
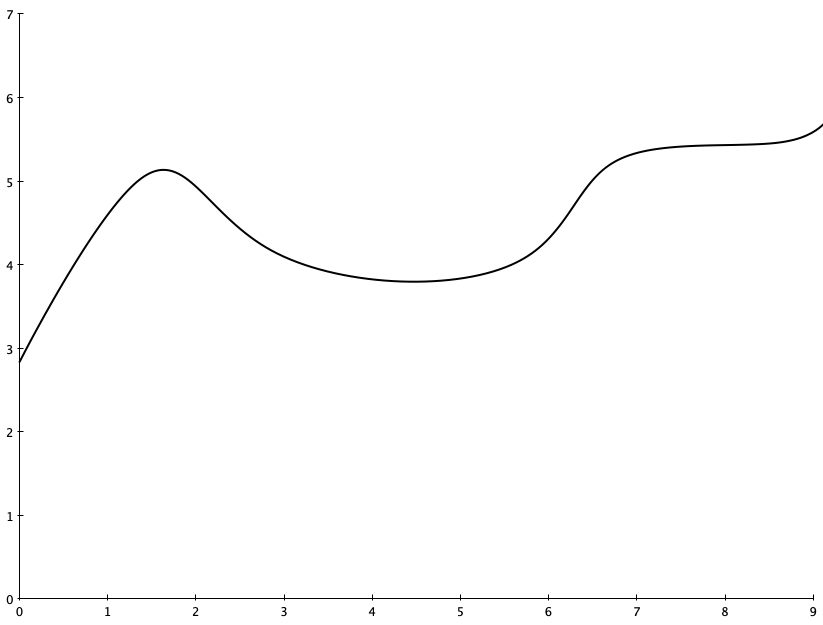
Visually, you can think of differential calculus as being about calculating the slope of a function at a given point. For example, consider this graph:
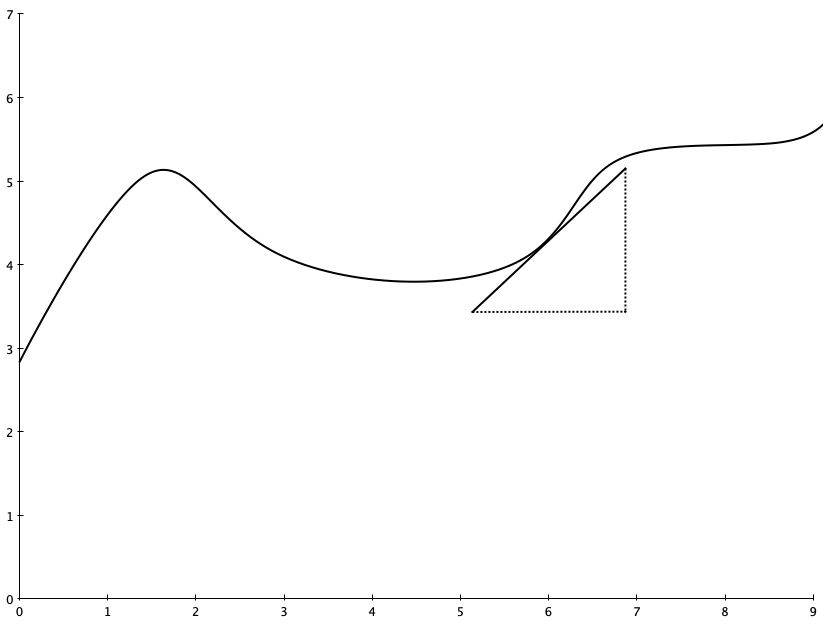
You might ask, “how quickly is this curve changing when x=6?” In other words, what is the slope of this function right in a neighborhood very close to x=6?
Differential calculus enables you to compute the slope of a function at a given point
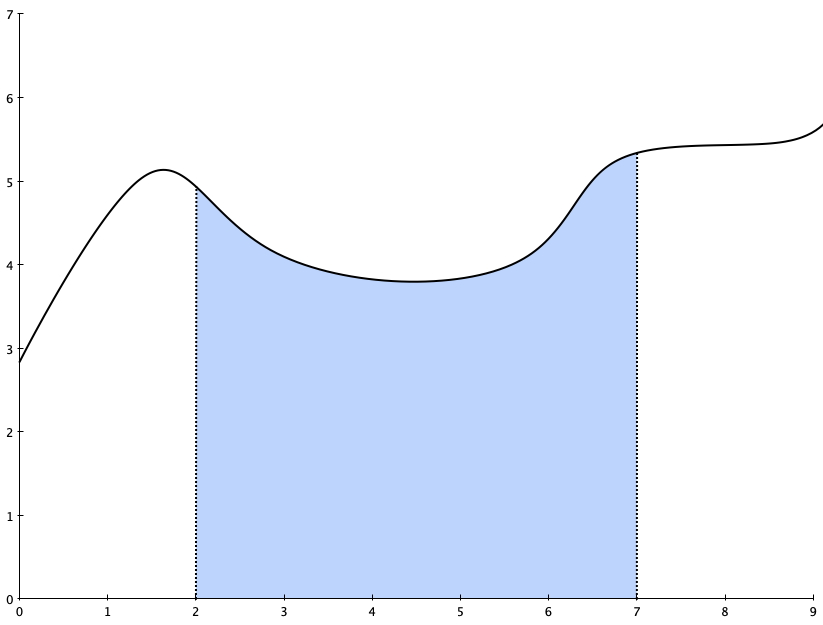
Integral calculus, on the other hand, is about the area under the graph over a particular interval. For example, you might ask “what is the area under this curve between x=2 and x=7?
Integral calculus enables you to compute the area under a function over a given interval
If you study calculus, you’ll first be taught differential calculus (sometimes referred to “Calculus 1” or “Cal 1”) and then you’ll be taught integral calculus (“Cal 2”). When you study differential calculus, you learn the rules for calculating the derivative (slope-at-a-point) of a function. And it turns out that it’s quite straightforward to calculate a derivative, no matter what type of function it is. It’s just an algorithm, which means you can easily program a computer to compute derivatives if you wanted to. (As an aside, automatically computing derivatives is a fundamental element in the process of training LLMs. If you’re curious, look up automatic differentiation).
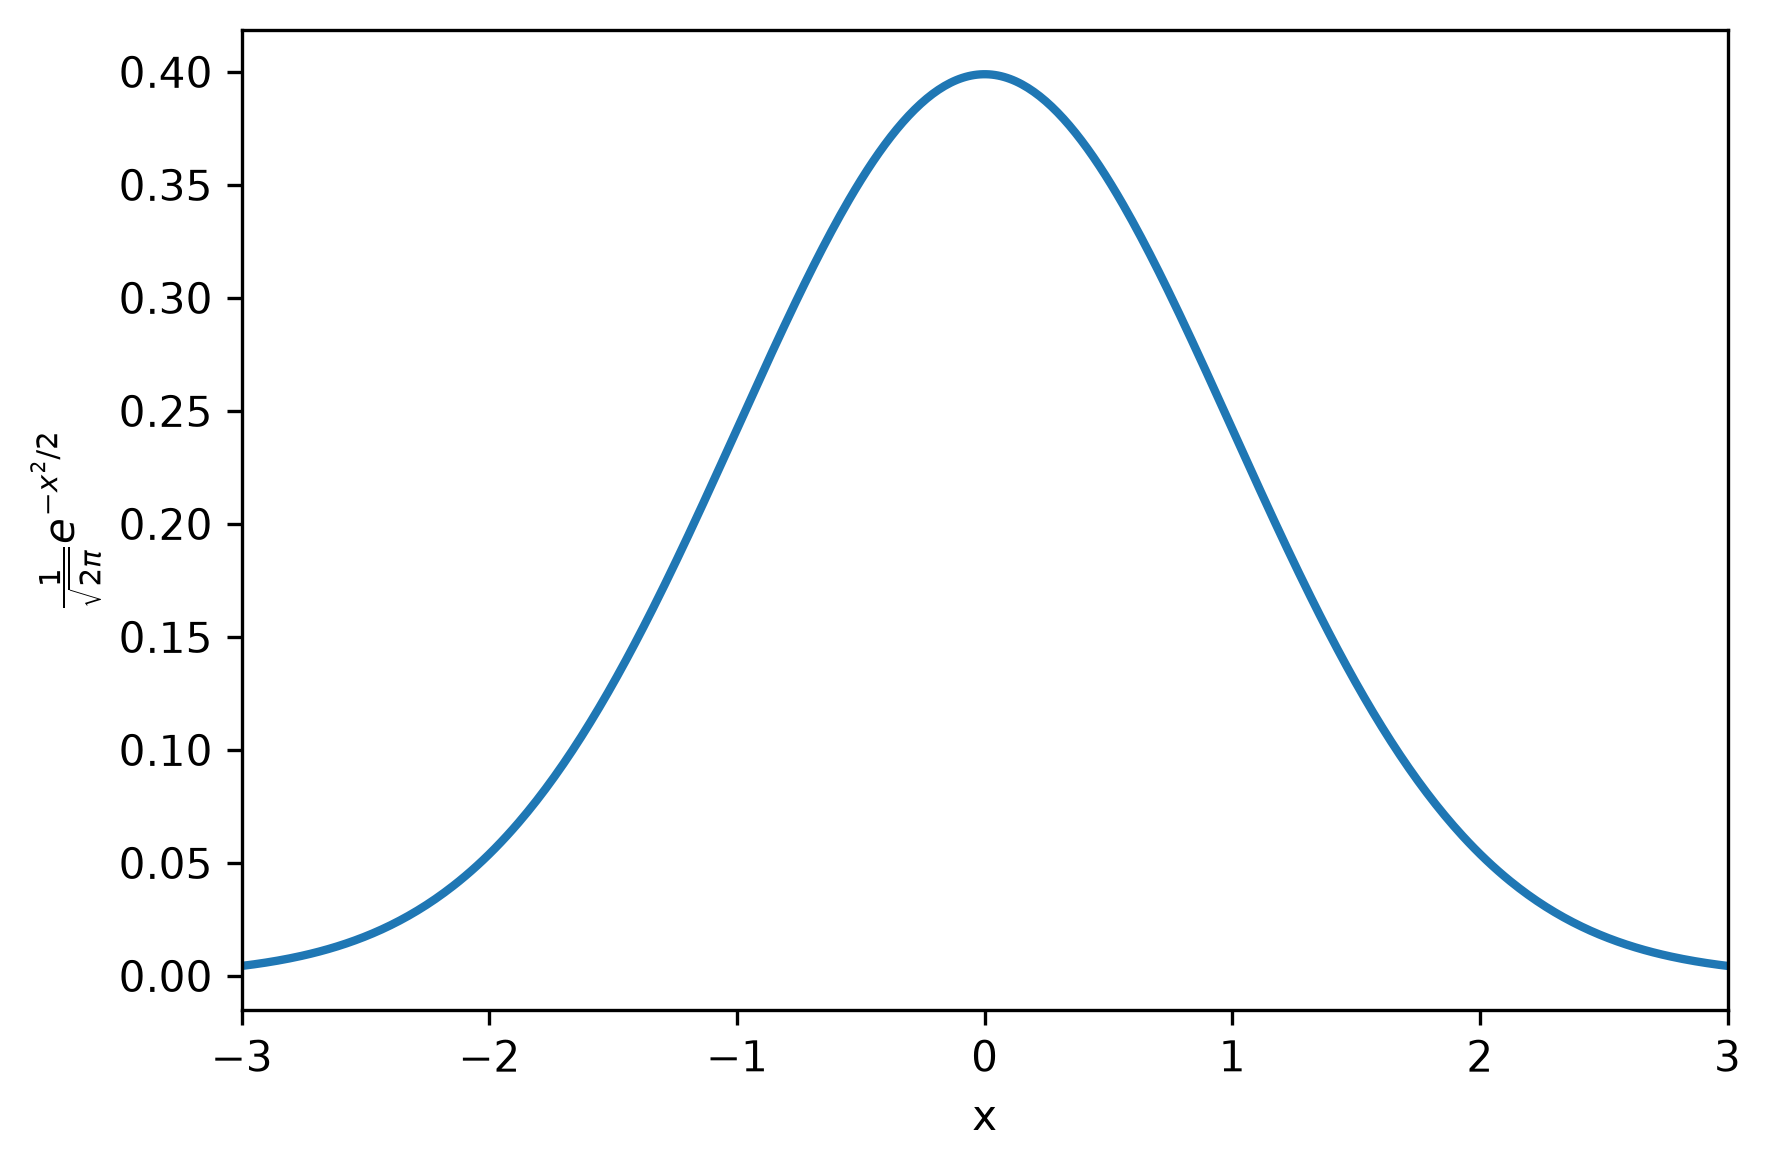
And then, you get to Cal 2, and you learn about how to compute an integral (area-under-a-curve). You will soon discover that, unlike in Cal 1, there is no algorithm for computing the integral of an arbitrary function. Instead, what you learn is a bag of tricks on how to compute integrals for different kinds of functions. You also learn that for some functions, there’s no closed-form solution at all for the integral! As an example, consider the Gaussian function, which shows up in the normal distribution. With zero mean and unit variance, it looks like this:
The infamous bell curve
Asking students to compute the derivative of this function would be a perfectly reasonable question on a Cal 1 final exam, the answer looks like this:
But asking students to compute the integral of this function on a Cal 2 final exam would be unfair, because it’s not possible to do with the techniques they learned in class (at least, I didn’t learn the technique you’d need until Cal 3). Because the integral doesn’t have a closed-form solution, you need to express the solution as an infinite series, like:
(Note: I asked AI for the integral of the Gaussian, I hope it got it right!)
It’s not obvious (at least, not to me) that differential calculus and integral calculus are related to each other. However, it turns out that these two calculi are opposite sides of the same coin, because integrals are anti-derivatives. That is, if f(x) is the derivative of F(x), then F(x) is the integral of f(x). This result is known as the Fundamental Theorem of Calculus.
This connection between differential and integral calculus raises an almost philosophical question: why is it so much easier to compute a derivative than it is to compute an integral? Back in 2011, somebody asked about this on the Mathematics Stack Exchange: Why is integration so much harder than differentiation? The top-voted answer was written by Qiaochu Yuan, and here’s the heart of it (emphasis mine):
Differentiation is a “local” operation: to compute the derivative of a function at a point you only have to know how it behaves in a neighborhood of that point. But integration is a “global” operation: to compute the definite integral of a function in an interval you have to know how it behaves on the entire interval (and to compute the indefinite integral you have to know how it behaves on all intervals). That is a lot of information to summarize. Generally, local things are much easier than global things.
In one sense, local things are easier than global things is a banal statement. Everybody knows that, for example, local optimization is much easier than global optimization. But it’s also a very deep one. And it gets at the title of this post, which is synthesis is harder than analysis.
I previously wrote about the difference between analysis and synthesis in the demon of the gaps. In analysis, we’re breaking a larger problem into smaller problems that separate out cleanly. These smaller problems are more localized, and hence easier to solve. This is why we advocate for principles like encapsulation and separation of concerns, to ensure our smaller problems are local.
The work of synthesis involves integrating(!) multiple things together. This pushes in the other direction: we are creating a problem that is less local. And global things are much harder than local things. The challenge we face is that some kinds of problems are just inherently synthesis problems. As I wrote in that previous post, incident response is one area where we are frequently confronted with synthesis problems: we have to understand how the pieces normally fit together in order to make sense of what is currently going wrong.
That’s why I think that this sort of synthesis work is important for SREs. Now, because synthesis is harder than analysis, and because SREs don’t have super-human cognitive abilities, it means that there is a limit to how deeply they will be able to understand any given component in the system. But the more they understand how the different components interact, the better positioned they are for helping resolve the tougher incidents.
Unfortunately, in our industry we haven’t recognized building up synthesis expertise as a first-class thing. That’s understandable because this work is very situated, it depends on the messy details of the particular system in the organization that an SRE works in. On the other hand, we can get better at learning how to learn about the operational details of a system. And that’s what I’d like to see more of.
Braithwaite’s post is dripping with sarcasm, but make no mistake, incident reports written entirely by LLMs is coming. And I am not looking forward to this future.
Before I dive in here, I want to note that there is a lot of toil you need to do in order to gather the data you need to write a good incident report, and LLMs can help significantly reduce that toil. I’ve got no issues there. But there’s a world of difference between using LLMs to help you assemble the ingredients involved in writing an incident report, and using an LLM to actually write the report itself.
Braithwaite’s post is horrifying to me precisely because of the seduction of the LLM as a tool for generating an incident report. After all, you can just ask it to write the report, and it’ll do it. And that’s exactly what scares me.
There’s a famous quote by the cartoonist Dick Guindon: “Writing is Nature’s way of showing you how sloppy your thinking is“. You might think you understand a concept, but it’s only when you put metaphorical pen to paper, when you actually try to explain the concept in written words to a potential reader, that you realize how fuzzy your understanding actually is. Writing in your own words forces you to confront how much you actually understand what it is that you’re writing about. Or, as Leslie Lamport put it, “If you’re thinking without writing, you only think you’re thinking.”
Having an LLM generate the text of an incident write-up bypasses this thinking step. Now there’s no human in the loop of the writing process that has to confront whether the explanation is actually consistent with the evidence that they’ve gathered. Instead, what you get is a plausible explanation of what happened to someone who is not intimately familiar with the details. They might read, nod along, and think, “yes, that makes sense.” But the LLM may have invented couplings between systems that aren’t there, and may miss critical interactions that were actually part of the incident, and because nobody did the hard work of actually synthesizing the data to do the write-up, nobody will notice. Because if you’re trying to reduce the writing effort, how much effort are you really going to put into checking the LLMs work.
In my view, LLM-generated incident write-ups are more dangerous than using LLM for coding or for AI SRE style tasks. For coding tasks, there’s always a testing step to check that the code exhibits the desired behavior, even if nobody looks at the code itself for meaningful details. For AI SRE tasks, either the LLM output helps you resolve the incident, or it doesn’t. In both cases, Nature is the ultimate arbiter of the LLM output.
But incident write-ups aren’t like that. The consequences of a poor report aren’t immediately apparent the way incorrect code or an incorrect operational diagnosis are in the moment. Instead, we get incident reports that have the superficially correct form, but are actually incorrect, with no obvious test for correctness.
And, because incident reports are time-consuming to write, the temptation to use AI tools to generate them will be overwhelming. But these LLMs will not go around talking to people that were involved in the incident. These reports will be simulacra; they will have the right form, but they will not provide readers with genuine insights into the nature of the system. The amount of learning will be significantly curtailed.
And, yes, people will probably use AI to summarize them as well.
The Journal of System and Software publishes a regular column called Dear Researchers: The perspective of software practitioners. Each column is an open letter to the software engineering research community from someone who works in tech. It’s edited by Austin Henley and Olaf Zimmermann, both of whom have experience in the two worlds of academia and industry.
Mephistopheles (a medieval demon from German folklore) flying over Wittenberg, in a lithograph by Eugène Delacroix.
Modern software systems contain within them a mind-boggling level of complexity. As software engineers, we make this complexity manageable through techniques like decomposition, information hiding, and abstraction. We endeavor to break our systems up into components that interact over well-defined interfaces. By doing this, the surface exposed to individual software engineers is dramatically reduced: no individual has to understand how the entire complex system works in order to contribute to their system. Instead, each software engineer needs to understand only the individual component that they work on, along with the interfaces of the other components that they interact with. Decomposition is synonymous with analysis, where you study a larger thing by breaking it up into smaller pieces that are more amenable to understanding.
You can see this strategy of complexity management in action in microservice architectures. An engineer needs to understand the service that their team owns, and the interfaces of the services that their team calls out to. This architecture effectively bounds the information that an engineer needs in order to work effectively. Microservice architectures aren’t there for scaling the software itself, they’re there for scaling the software organization.
Unfortunately, when the system breaks down, this complexity management strategy breaks down itself. Just as hurricanes don’t respect political boundaries, system failures don’t respect component boundaries. Yes, sometimes the problem in a software system is limited to the failure of a single component. Those are the easiest cases to diagnose and mitigate. However, the hairy incidents are the ones that arise due to unexpected interactions across components. Maybe you have several services that are throwing errors, or maybe none of the services are throwing errors but customers are still seeing incorrect behavior. There’s no obvious change that correlates with the start of impact, or maybe you don’t even know when the impact started because the customer impact isn’t reflected in your existing metrics.
When you’re in the throes of an incident that involves an unexpected interaction, this architecture that was built for managing complexity now works against you. Because you’ve built an analysis solution but you’re now faced with a synthesis problem. You need to understand how the pieces all normally fit together to function in order to determine what is going wrong with the system right now. You’ve optimized to avoid requiring anybody to understand how the whole thing works, but now the whole thing isn’t working, and no one person knows how the whole thing works.
The job of the incident responders is to collectively figure out how to do that synthesis. You’ve brought together a group of people who each understand the functions of different components of the system, and you need to work together to build enough of an understanding of how the system functions to debug what’s going wrong. As an ad hoc team, the incident responders have to move up and down the abstraction hierarchy to figure this out.
This sort of in-the-moment reconstruction of system function from component parts is an essential part of incident response for the most complex incidents, but it’s rarely treated as first-class work that’s worthy of study and support. The recent book Crisis Engineering by Marina Nitze, Matthew Weaver, and Mikey Dickerson is the exception that proves the rule: they do discuss the work of building a model of the system during a crisis to help figure out what’s gone wrong. But I struggle to recall any other guidance I’ve read about incident response that talks about how to prepare for doing this sort of work. It’s important work, and it’s difficult, and the ability to do it well can have a huge impact on the time it takes to mitigate the hardest incidents. This is stuff that even the best individual humans struggle with, because it involves a group of humans working together effectively, with each person having a partial model of the system. And if the best humans struggle with it, I don’t think AI SRE tools are going to save us here: if the best humans struggle, the AIs will too. We need to figure out how to get better at this collectively. Like so many things, it’s a coordination problem.
I’m a betting man; I just enjoy making bets, even when there are no stakes at all.
Examples of my enjoyment of betting
And when you talk about bets, you end up talking about odds.
It turns out that reliability is also about odds, even though we don’t use the language of odds in our domain. Consider how we talk about availability. We report system availability as a number of nines: for example, we might say “four nines of availability”, which means 99.99% of somethings are good over some time interval. The canonical example of those somethings are successful requests. In that case, if someone says a service has four nines of availability over the past three months, that means that 99.99% of requests succeeded over that time period. We could express the same information by saying that there is a one in ten-thousand chance that any given request failed in the past three months.
If your system has exhibited four nines of availability in the past three months, and you assume that the availability of your system in the near future will be like the availability of the past (a dangerous and unwarranted assumption, but let’s go with it for a moment), then we could also express this information using the language of odds, by stating that the odds of a request failing are ten-thousand to one.
But this isn’t a post about describing availability in the language of odds. Instead, what I want to talk about is how all reliability work is inherently about improving the odds, increasing the likelihood that the system stays up. Any time we build any sort of reliability mechanism, be it load shedding, autoscaling, canarying, staged deployments, automated rollbacks, or what have you, we are building automation into the system that either eliminates or reduces the impact a subset of potential problems. If you ask an engineer working on improving reliability, “will this prevent all future incidents”, they will tell you “no, of course not”.
However, we don’t explicitly think of reliability work in terms of improving the odds. Instead, we tend to think of it as deterministically addressing a specific class of problem. You’ll hear questions like, “how many historical incidents would this tech have prevented?” in trying to determine whether engineering should invest in a particular reliability solution. They are looking for an answer like, “this would have prevented 20% of our SEV1s and SEV0s”. This 20% isn’t interpreted as a likelihood, instead it’s used as an estimate of impact, as in “this will improve our availability by around 20%”. The idea is that this reliability work will deterministically eliminate or mitigate a certain fraction of incidents; we just don’t know exactly what that fraction is, so we estimate it from historical data.
What I would like to propose in this post is that we think about all of the various kinds of reliability work as improving the odds of our system being up longer, instead of assuming that reliability work will have a fixed effect, and try to estimate the effect size. I’ve got two motivations for taking this perspective of reliability work as odds improvement.
The first motivation is that I don’t think we can ever estimate the effect size without error bars that are so huge that the estimates are themselves meaningless. As I’ve written about previously, the variation in incidents is just too large relative to the amount of data we have available. And, to make the estimation problem from historical data even worse, our system is changing over time. Or, to put it in technical terms, I don’t believe that incidents can be modeled as a stationary process. (Heck, if they were stationary, then that means that reliability work could not have an impact, because then the process would change over time!). Note that I’ve never seen anybody try to validate the estimates, they’re always point-in-time estimates used to justify work, and then promptly forgotten about. In one sense, that’s fine, they served their purpose of convincing leadership that we should allocate cycles for a particular kind of reliability work. But we shouldn’t fool ourselves into believing that these estimates are meaningful: they’re for persuasion, not insight.
It’s my second motivation, though, that prompted me to write this blog post. And that’s because the idea of reliability work as improving the odds of effectively mitigating future incidents is a useful framework for thinking about work that improves resilience. I’m interested in improving the skills of the people who respond to incidents, putting them in a better position to deal with those future unforeseen, surprising scenarios. One way to do this is learning from how responders dealt with previous incidents, the different sorts of observability data they had access to and how, the different knobs that were able to turn, and so on. While the next incidents will be different, the set of tools that are available during incident response are generally the same. There’s no way I can give a quantitative of estimate how this sort of skill improvement work will impact reliability. And despite the enormous number of random factors, I am confident that it will improve our odds.
I’m too young to have seen Bozo the Clown myself, but I’m old enough to get the references
“Flipping the bozo bit” is an expression from the software world. Think about a time when you reached a point where you simply stopped respecting the opinion of a particular person, most likely a co-worker. From that point on, you disregarded what they said. This is what flipping the bozo bit is. This person isn’t worth listening to, they’re a bozo.
There’s a related phenomenon, where we hear an anecdote about some bad outcome that happened to someone else, and our conclusion is that this outcome occurred because, well, that person is a bozo. I’m writing, of course, about incidents. You’ve seen this happen, right? An incident happens, the details of the incident get passed around, and somebody makes a comment like, “how could they have [not] done X?” The subtext is “what a bunch of bozos!”
This is on my mind because of the latest AI-related incident that befell PocketOS. You can read about it in the Twitter post written by the PocketOS founder, Jer Crane. The post is titled An AI Agent Just Destroyed Our Production Data. It Confessed in Writing. Unsurprisingly, this post got a lot of online attention. I saw a lot of “wow, was this guy ever a bozo” reactions to this story. I want to talk about why this reaction is counter-productive. I also want to call out the technical term for this phenomenon, which is a cousin of flipping the bozo bit. It’s called distancing through differencing.
By focusing on the differences, they see no lessons for their own operation and practices.
When people hear about an incident and respond by concluding “an incident like that would never happen to us; that happened to those workers over there because they are clearly not as careful as we are, that’s distancing through differencing in action.
Overall they decided the incident “couldn’t happen here”.
The Cook and Woods paper illustrates the phenomenon with a case study of a chemical fire that broke out at an American manufacturing plant. There had been a similar fire that had occurred previously at the same company, at an overseas plant. The American employees knew about the previous fire, but they had concluded that there was nothing to learn from that other fire, as that sort of accident couldn’t happen to them in the U.S. After all, those overseas workers were less skilled, less motivated, and less careful. In short, those overseas workers were perceived as different.
Ironically, after the chemical fire at the Ameircan plant, other workers at that very same plant also exhibited distancing through differencing.
Workers in the same plant, working in the same area in which the fire occurred but on a different shift, attributed the fire to lower skills of the workers on the other shift.
Cook and Woods note that our tendency to focus on differences between us and them when the incident happens to them leads us to miss aspects of the system that we actually have in common with them. By focusing on the differences, we miss the opportunity to learn from their experiences, because it seduces us into believing there’s nothing for us to learn here.
do not discard other events because they appear on the surface to be dissimilar. At some level of analysis, all events are unique; while at other levels of analysis, they reveal common patterns.
Now let’s circle back to the PocketOS AI-related incident. If we come to the conclusion that PocketOS employees were simply using AI irresponsibly, and that we are more responsible than that, we learn nothing from the experience. I was heartened to see that Railway, the vendor used by PocketOS that exposed the delete API, has made changes to the overall system to improve safety; see their post: Your AI wants to nuke your database. Guardrails fix that.
Stepping back, this isn’t the last AI-related incident we’re going to see in our industry, not by a long shot. The next time you read one of those, if your reaction is “they should have known not to do X”, then you’ve fallen into the distancing through differencing trap.
(As an aside, “they should have known…” is an incoherent sentence. It’s one thing if somebody deliberately took on excessive risk. But it’s another thing if they unknowingly took on excessive risk. How can you blame a person for not knowing something?)
When this process of learning moved past the obstacle of distancing through differencing in this case, the organizational response changed.
After all, there but for the grace of God go we all.
Even though square A appears darker than square B, the two are, in fact, the exact same shade of gray. It’s such a powerful illusion that, even knowing the illusion doesn’t destroy its effect; you’ll still “see” the illusion after you know about it. It’s so powerful that you may not believe me over your lying eyes. If you’re on macOS, you can confirm the illusion by opening the Digital Color Meter app and hovering your mouse pointer over each square in turn. You’ll see that both squares have the same RGB value. In hex, the value is #646464.
I’m going to suggest two stylized reactions to witnessing this illusion. One reaction is to say, “Oh, no! This illusion clearly illustrates a flaw in the human visual system! We should work on developing a vision correction technology so that people don’t fall victim to problems that would arise from this failure mode in human visual processing.”
A very different reaction is to say, “Oh, wow! This illusion gives us a hint into how the human visual system functions! Our brain must contain a prior model about the relationship between light, shadow, and objects, and is imposing that model when processing the signals coming from our optic nerve. This illusion appears to be an example of a pathological case which violates the human brain’s model.”
The first reaction is, admittedly, a ridiculous strawman. These sorts of illusions are harmless, so there’s no motivation to try to “correct” from them. After all, it’s no coincidence that the illusion was developed by a researcher who studies human vision. Even though our visual system is failing us in this strange case, the value of an illusion like this is not to learn the circumstances in which our vision fails, but instead to use the failure to gain insight into how our vision works so effectively for the vast majority of the time.
Last week, I wrote a post about Safety-II, the idea that we will learn more about how to create reliability in our system by studying the (common) successful cases rather than the (rare) failure cases. But we can also use the failure cases to learn about how the system normally succeeds! Just as neuroscientists can use optical illusions (where the vision system fails) to learn how the visual system succeeds, we can use incidents (when our system fails) to learn about how our system succeeds.
To make this more concrete, imagine you’re in an incident review meeting, and one of the incident responders, someone who is a real expert at your company, is talking about how, in hindsight, they misdiagnosed the problem during the incident. The signals that they saw misled them until thinking that the system was in state A, when really the system was in state B. And that led to the incident taking much longer to resolve, because the responders went down the wrong path.
The typical sort of question to ask in a review meeting would be along the lines of “what can we do to make sure we don’t misdiagnose this type of problem in the future?” But, there’s a very different question that you ask. And that question is, “how did the responder come to the conclusion the system was in state A?” Asking this question will expose details about the responder’s mental model of how the system actually works. If the responder was an expert, and they were led astray by the signals, then it’s likely that this incident was a pathological case, an operational equivalent of the optical illusion we saw above. By asking the responder about how they made the diagnosis, you are giving the meeting attendees the opportunity to learn from the expert responder. Similarly, you can ask the responder, “how did you finally figure out that the system was in state B?”, which will give you another chance to retroactively witness the work of an expert in action.
Like optical illusions, incidents are pathological cases. But, unlike illusion, incidents aren’t harmless. This means that the natural reaction is, “what went wrong here, and how do we stop doing that?” But if our goal is improvement, we should recognize there’s a lot more leverage in maximizing the opportunity to learn about what’s working well today, from the experts who are doing that work well. After all, there’s a reason we called that responder an expert; their work had led to a lot more success than failure.
Now, here, you see, it takes all the running you can do, to keep in the same place. – Lewis Carroll, Through the Looking-Glass, and What Alice Found There
LLM coding may be revolutionizing software development productivity, but it doesn’t seem to be generating the same sorts of gains in software reliability yet. Two events that caught my eye today, although only one is directly related to LLMs.
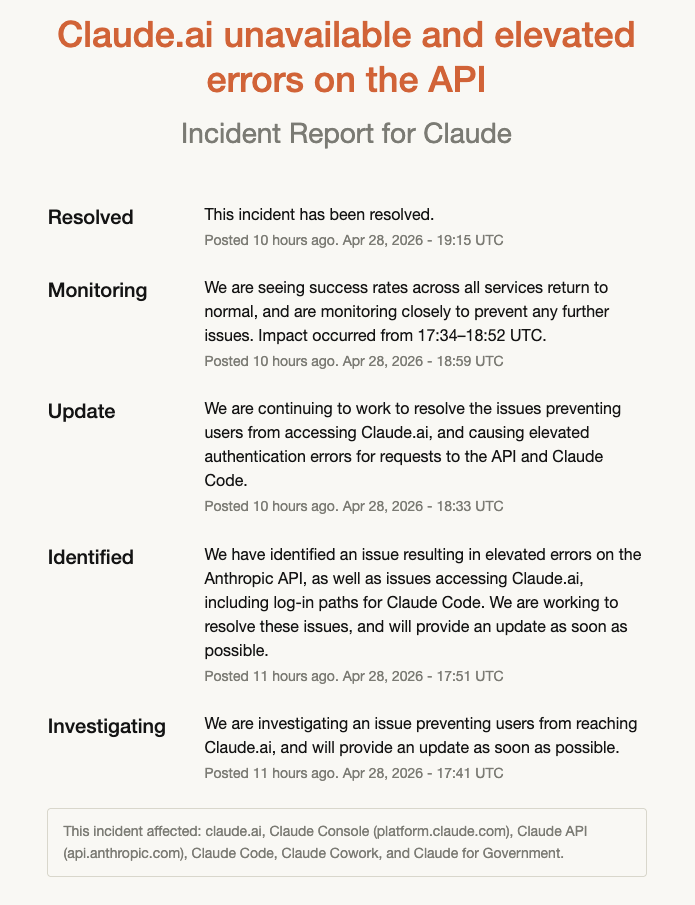
The first event was that Anthropic suffered from another incident today, which lasted about an hour and a half.
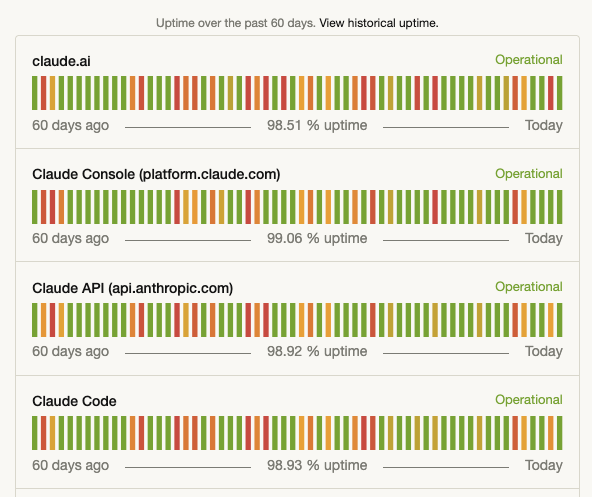
This brought Claude Code down to one nine over the past 60 days, although they’re at two nines if you look over 90 days. I know, I know, I shouldn’t even talk about the nines, but they do make for a great screenshot.
The second event, the one I really want to focus in here, was GitHub’s CTO Vlad Fedorov writing the blog post: An update on GitHub availability. It was only six weeks ago that he wrote Addressing GitHub’s recent availability issues, which is clearly a sign that GitHub is concerned about the impact of recent incidents on their brand.
I want talk about GitHub’s post in the context of David Woods’s Messy 9 collection of patterns about complex systems. I’ve mentioned them before, but to re-iterate, they are: congestion, cascades, conflicts, saturation, lag, friction, tempos, surprises, tangles.
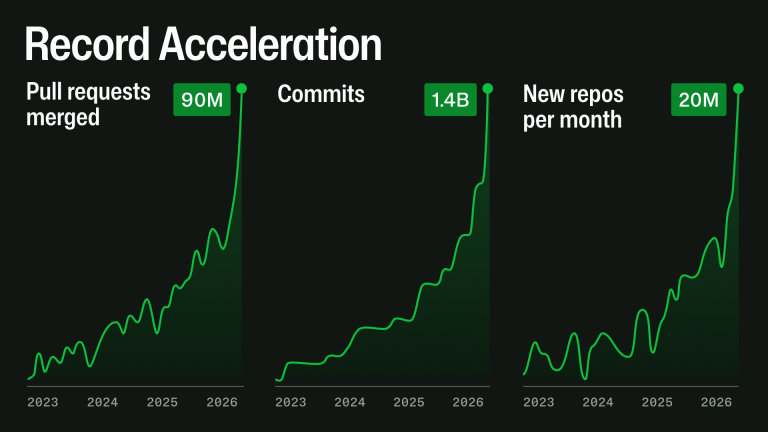
Fedorov notes that AI is driving a lot more activity on the site: the counts of pull requests, commits, repos are growing like never before.
This is a great example of an increase in tempo: the environment that GitHub exists within is changing faster than it has previously. Heck, it’s right there in the title of that graphic: “Record Acceleration”. In particular, the load on GitHub as a system has increased significantly, and GitHub is struggling to keep up with this load. It puts GitHub at risk of saturation.
This exponential growth does not stress one system at a time. A pull request can touch Git storage, mergeability checks, branch protection, GitHub Actions, search, notifications, permissions, webhooks, APIs, background jobs, caches, and databases. At high scale, small inefficiencies compound: queues deepen, cache misses become database load, indexes fall behind, retries amplify traffic, and one slow dependency can affect several product experiences.
GitHub has to make changes to its internal systems in order to handle this load. I don’t work at GitHub, so I don’t know the details, but I have high confidence that they can’t simply horizontally scale their way out of the problem. They will likely have to rearchitect parts of their system in order to handle the increased load. And that will take time, even in the age of AI. And this is where the lags come in. It takes time to actually implement long-term solutions that can handle the load, which increases the probability of short-term outages since the system is running too close to the margin, and those outages delay the long-term solution work because the short-term firefighting steals engineering cycles, and so on. It’s a dangerous place to be, and I don’t envy them.
(As an aside, one other aspect of Fedorov’s post that I found interesting was how the increasing popularity of monorepos is also putting additional stress on GitHub as a system. People are using them in ways that designers had not envisioned!)
I don’t know whether Anthropic will reveal any details about the nature of their most recent outage, but as I’ve written about previously, the author of Claude Code mentioned on Twitter that Anthropic’s availability issues are related to unexpectedly rapid increases in demand. They are victims of their own success.
One of the reasons I don’t expect AI to improve reliability is that I don’t think LLMs are well-suited to mitigate the risk of saturation. As GitHub demonstrates, LLMs are more likely to be on the supply side when it comes to risk of saturation.
Back on April 4, the social media site Bluesky suffered a pretty big outage. I was delighted to discover that one of their engineers, Jim Calabro, published a public writeup about it: April 2026 Outage Post-Mortem.
Calabro’s post goes into a lot of technical details about the failure mode. I’m using this post as a learning exercise for myself. I find that if I have to explain something, then I’ll understand it better. After reading his post and writing this one, I learned things about ephemeral ports, goroutine groups, the TCP state machine, the interaction between blocking system calls and the creation of threads in the Go runtime, and the range of loopback addresses on Linux.
Interpreting the error message
The first thing that struck me is Calabro’s write-up was his discussion of a particular error message he saw in the logs:
dial tcp 127.32.0.1:0->127.0.0.1:11211: bind: address already in use
Now, if I was the one who saw the error message “bind: address already in use”, I would have assumed that a process was trying to listen on a port that another process was already listening on. This sort of thing is server-side behavior, where a server listens on a port (e.g., web servers listen on port 80 and port 443). In the connect attempt associated with the log, the server is listening on port 11211 (the standard port used by memcached). As it says on the Linux bind man page:
 EADDRINUSE
              The given address is already in use.
But that wasn’t the problem in this case! It wasn’t an issue with a server trying and failing to listen on port 11211. Instead, the problem is that the client, which is trying to make a connection to the memcached service, is failing to associate a socket with a port. The system call that’s failing is not listen but (as indicated in the error message) bind. That bind man page actually has two different entries for the address already in use error. Here’s the second one:
EADDRINUSE
              (Internet domain sockets) The port number was specified as
              zero in the socket address structure, but, upon attempting
              to bind to an ephemeral port, it was determined that all
              port numbers in the ephemeral port range are currently in
              use. See the discussion of
              /proc/sys/net/ipv4/ ip_local_port_range ip(7).
I assume that go’s net.Dial function ultimately calls this private dial function, which will call bind if the caller explicitly specifies the local address. In the log message above, the local address was 127.32.0.1:0.
This code was failing because there were no available ephemeral ports left!
I bring this up because Calabro simply mentions as an aside how he (correctly!) interpreted the error message. He just shows the error, and then writes (emphasis mine):
The timing of these log spikes lined up with drops in user-facing traffic, which makes sense. Our data plane heavily uses memcached to keep load off our main Scylla database, and if we’re exhausting ports, that’s a huge problem.
That’s expertise in action!
Saturation, part 1: ephemeral ports
The failure mode that Bluesky encountered is a classic example of saturation, where the system runs out of a critical resource. Calabro’s write-up covers two different time periods, a paging alert on Saturday April 4, and then the Bluesky outage that happened two days later, on Monday April 6. There were different flavors of saturation on the different days, here we’ll talk about the first one.
On Saturday, the limited resource in question was the number of available ephemeral ports. From a programming perspective, when we make calls to servers, we don’t think about the fact that our side of a TCP connection gets assigned a port, because this TCP detail is effectively abstracted away from the developer.
I’m running on macOS, but if I launch an Ubuntu Docker container, I can see that the ephemeral port range goes from 32768 to 60999, for a count of 28,232 available ephemeral ports:
$ sysctl net.ipv4.ip_local_port_range
net.ipv4.ip_local_port_range = 32768 60999
The irony here is that the connections that exhausted the ephemeral ports were to a process that’s running on the same host: memcached listening on 127.0.0.1:11211.
Calabro goes into considerable detail about how the service they refer to as the data plane ran out of ephemeral ports. I’ll describe my understanding based on his write-up. But, as always, I recommend you read the original.
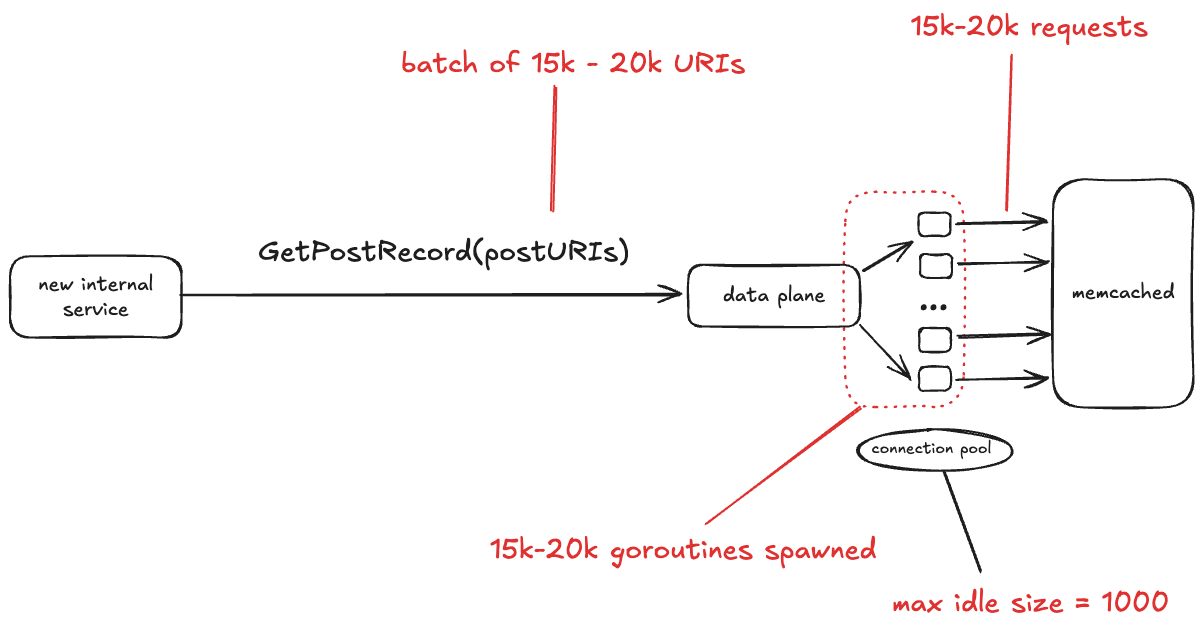
The data plane service talks to a database that is fronted by memcached. This incident only involved interactions between data plane and memcached, so I don’t show the database in the diagram below.
How the data plane service ran out of ephemeral ports
Bluesky recently brought up a new internal service. One of the things this service does is make the GetPostRecord RPC call against the data plane service. The problem isn’t with the rate of traffic. In fact, the volume of traffic that this internal service sends to data plane is low, less than 3 RPS.
No, the problem here is the size of the GetPostRecord payload. It sends a batch of URIs in each call, and sometimes those batches are very large, on the order of 15-20 thousand URIs.
The data plane looks up each URI in memcache first before hitting the database. The data plane is written in Go, and for each request, it starts a new goroutine, and each of those goroutines creates a new TCP connection to memcache. All of those goroutines concurrently making those TCP connections depleted the set of available ephemeral ports.
One thing I learned from this write-up is that Go has a notion of goroutine groups, you can explicitly set a limit of the number of goroutines that are active within a given group. Tragically, this was the one data plane endpoint that was missing an explicit limit.
The connection pool
In the write-up, Calabro notes that the memcached client uses a connection pool, with a maximum idle size of 1000 connections. I was initially confused by this, because I’m used to connection pools where the pool defines the maximum number of simultaneous active connections, and if no unused connections are available, then the client blocks waiting for a connection to be available.
I looked into this, and assuming that this app is using the gomemcache library, that’s not how its connection pool works. Instead, the gomemcache code first looks to see if there’s an available connection. If not, it creates a new connection. So, the connection pool here doesn’t bound connections, but rather is an optimization to reuse an existing connection if one is available.
Instead, what you specify with gomemcache is the maximum number of idle connections, which is the maximum number of connections that the pool will hold onto after use. As mentioned above, Bluesky had this configured as 1,000. This means that if there are 15,000 new connections requested concurrently, at best 1,000 connections will be reused from the pool, requiring 14,000 new connections to be established.
Bitten by time lags – TIME_WAIT
Time lags are underrated factor in incidents, and time lag plays a role here. In this case, the time lag is due to a state in the lifetime of a TCP socket called TIME_WAIT. This state renders a port unusable for a fixed period of time after a connection associated with the port has been closed.
Personally, I first encountered TIME_WAIT back when I was working on a web app on my laptop. Sometimes I’d kill the process and restart it, and the restart would fail with the error that the port it was trying to listen on was already in use. It turns out that the operating system does not immediately release the ports associated with a socket after it’s closed. Instead, the connection transitions to the TIME_WAIT state.
The dropped ACK problem: sending an error when nothing is wrong
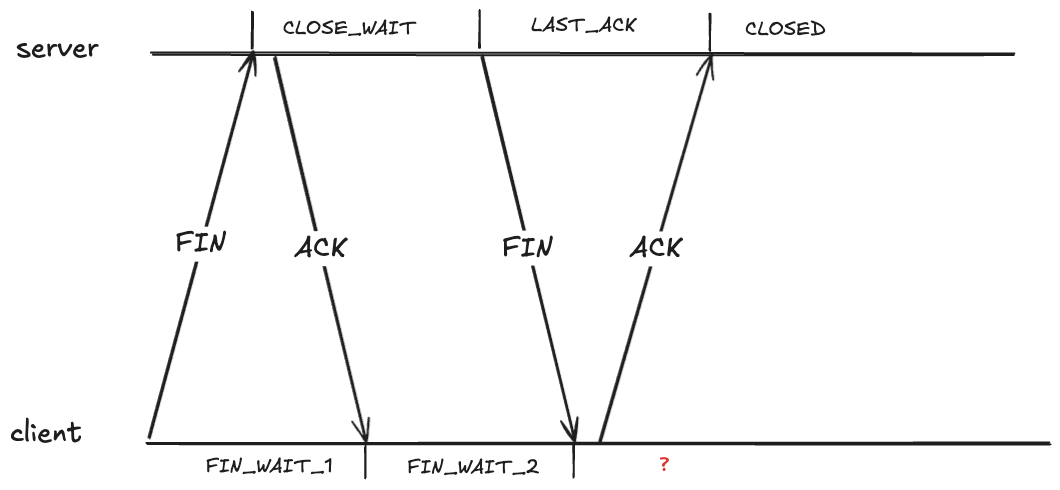
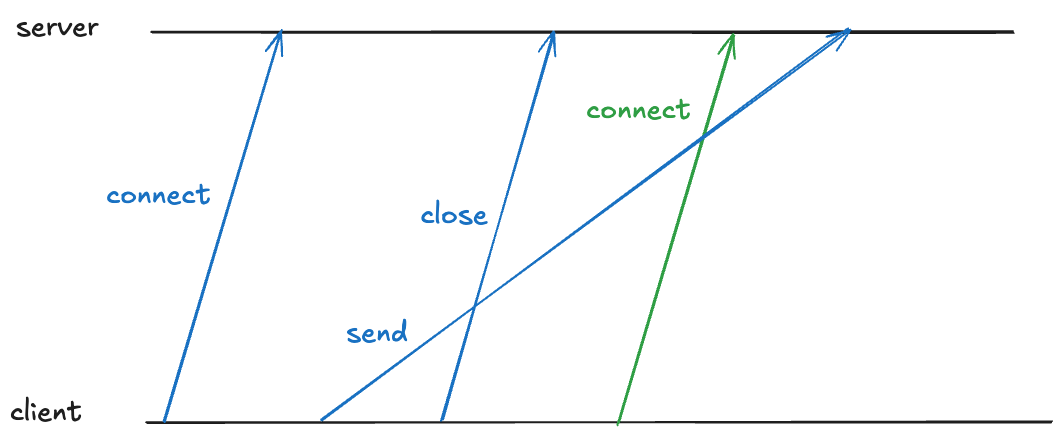
Closing a TCP requires each send side to send a FIN, and each side to ACK the received FIN. As each side sends or receives one of these packets, it transitions through the TCP state machine. Here’s what the exchange looks like. I’ve annotated the TCP states on the server side and the client side.
What state should the client be in after receiving the FIN?
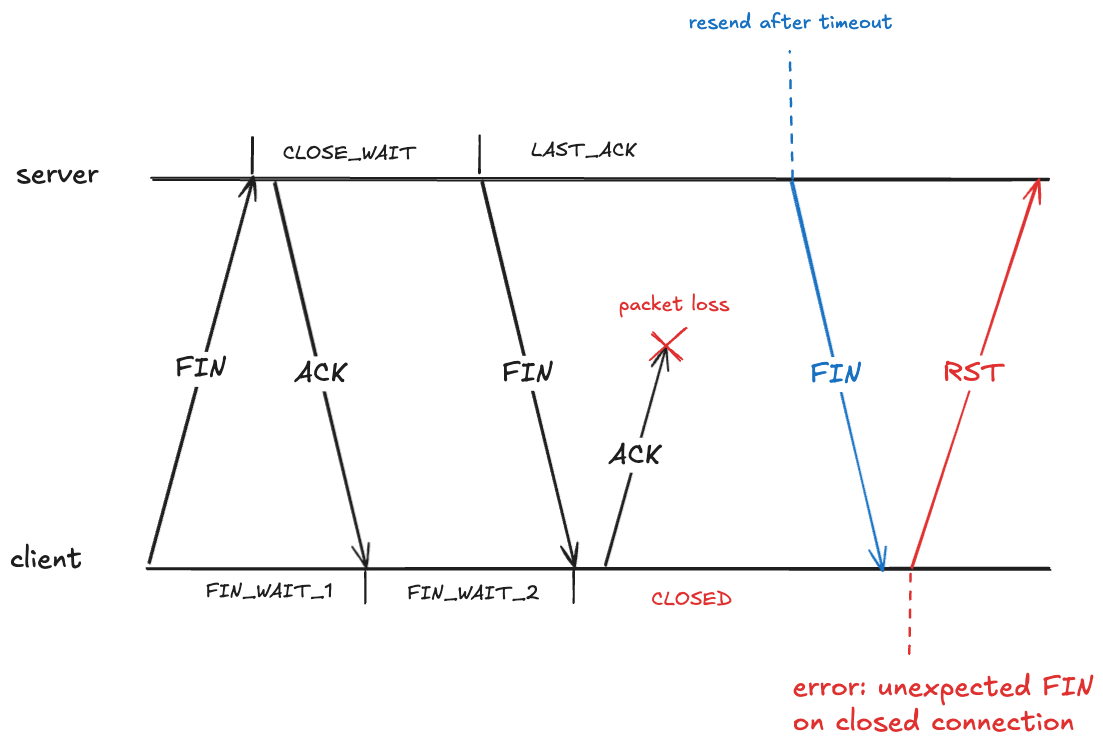
It looks like the client should also be in the CLOSED state after it receives the FIN. However, that creates a problem if the ACK it sends never makes it, because the server will eventually retry sending the FIN.
Here the client has received a packet associated with a TCP connection that has transitioned to the CLOSED state. The client will treat this as an error, and will send an RST packet (if you’ve ever seen the message: connection reset by peer, you’ve been on the receiving end of an RST packet).
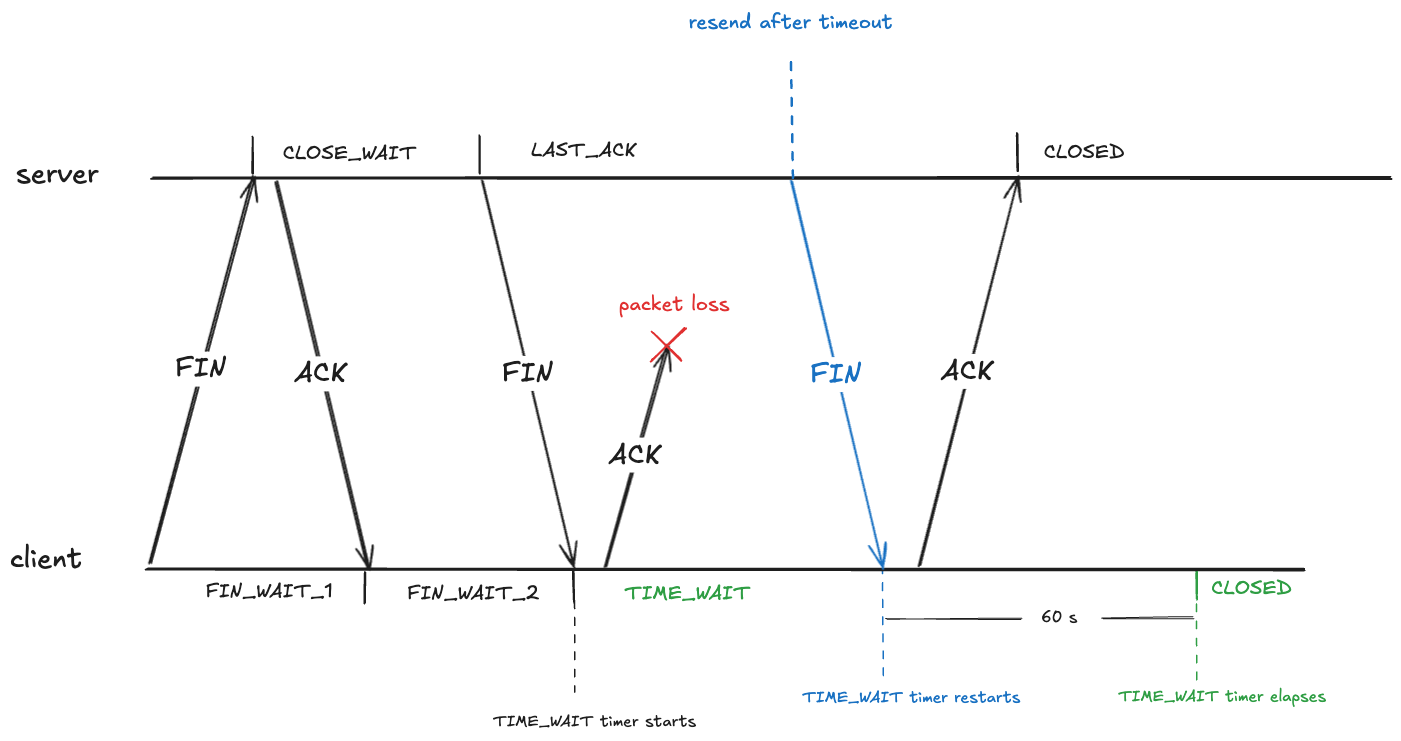
To prevent this, after sending an ACK in the FIN_WAIT_2, the client transitions into the TIME_WAIT state. From RFC-9293:
When a connection is closed actively, it MUST linger in the TIME-WAIT state for a time 2xMSL (Maximum Segment Lifetime)
The RFC doesn’t define what the maximum segment lifetime is. On Linux, the kernel waits in the TIME_WAIT state for about 60 seconds.
#define TCP_TIMEWAIT_LEN (60*HZ) /* how long to wait to destroy TIME-WAIT
* state, about 60 seconds */
This means that the state of the TCP connection will be in the TIME_WAIT state for about a minute before transitioning to CLOSED:
The out of order problem: packet associated with wrong connection
TIME_WAIT also deals with a problem related to packets being received out of order.
Note that a TCP connection’s identity is determined by the four-tuple: (source IP, source port, destination IP, destination port). Here’s an example of such a four-tuple: (127.32.0.1, 32768, 127.0.0.1, 11211).
Because TCP packets can arrive out of order, there might still be packets in-flight associated with that connection. If a new TCP connection with the same four-tuple is opened, the receiver will incorrectly associate the packet with the new connection, even though it was part of the old one, as depicted below (here I’m simplifying the connect and close to a single packet rather than using three packets).
The blue “send” packet is incorrectly associated with the green TCP connection.
TIME_WAIT also prevents this by having the client enter TIME_WAIT that is long enough to guarantee that the sent packet is received before the new connection can be opened on the same port.
Eating up the ephemeral port space
Because you have to wait about a minute before you can reuse an ephemeral port, TIME_WAIT reduces the amount of available ephemeral ports.
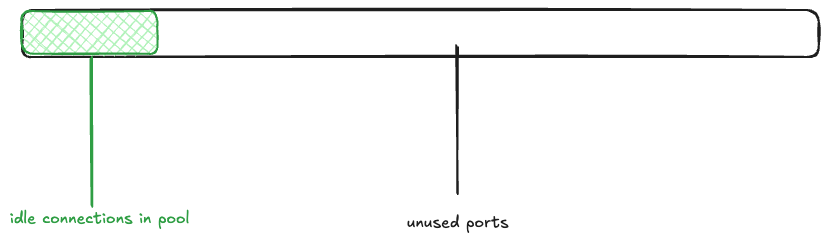
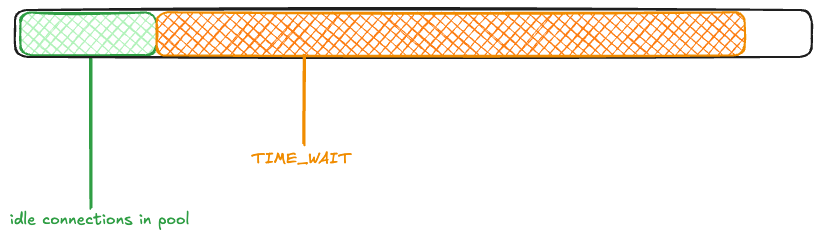
Returning to the Bluesky scenario, imagine that the memcached connection pool is fully populated (there are 1000 idle connections ready to be used), and the rest of the ephemeral ports are free. I’ll depict the space of 28,232 ephemeral ports as a rectangle, with the green rectangle indicating the connection pool.
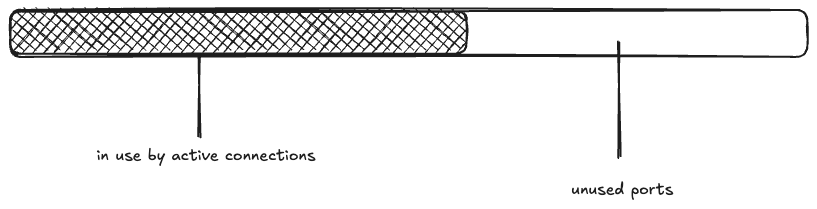
Next, a wave of 15K connections are created. This takes all 1000 of the idle connections, and has to make 14K new connections.
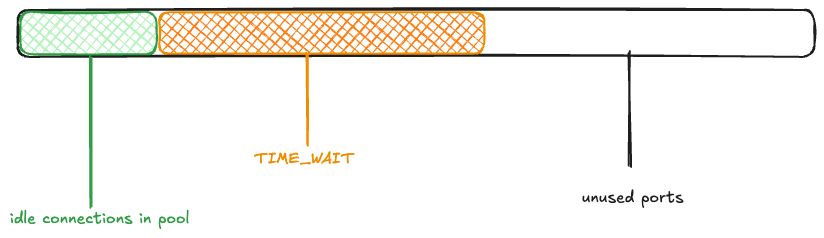
The maximum idle connections is set to 1000, so 1000 of the active connections get returned to the pool. The rest of the connections are closed, and eventually enter the TIME_WAIT state:
Now, another wave of connection requests comes in. Because the ephemeral ports are in use by TCP connections in the TIME_WAIT state, they’re unavailable:
Once again, 1000 connections get returned to the pool, and the rest enter TIME_WAIT.
You can see how the ephemeral ports could be consumed if large numbers of connection requests came in one after another before the TIME_WAIT timer elapsed.
Saturation, part 2: memory
While Bluesky observed the problem with ephemeral port exhaustion on Saturday, it wasn’t until the Monday that they suffered from an outage.
From the write-up, it’s not clear to me what exactly changed on Monday. Perhaps it was just an organic increase in traffic that exacerbated the problem? Whatever it was, the ephemeral port exhaustion contributed to a cascading failure.
According to the write-up, the failure cascade went something like this:
The ephemeral port exhaustion led to error messages when attempting to call memcached.
Every memcached error resulted in a log line being written synchronously to disk.
A large number of goroutines blocked in synchronous system calls led to the Go runtime spawning many OS-level threads (I learned that OS-level threads are called M in Go parlance).
This large number of OS-level threads put memory pressure on the app.
As a result, the data plane experienced stop-the-world GC pauses as well as OOM kills.
Note that because TIME_WAIT is an OS-level state, a data plane process that was OOM killed and restarted would still face limits on the ephemeral port space!
The workaround: leveraging multiple loopbacks
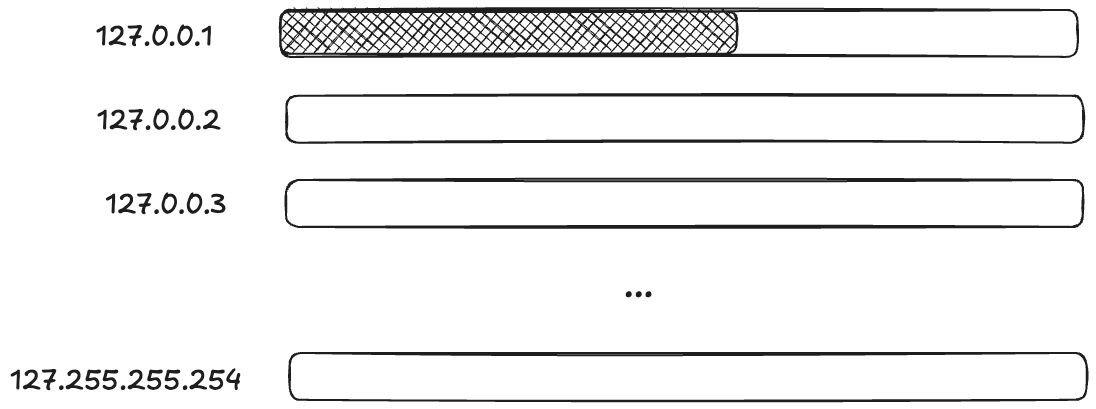
I was impressed by their improvised solution to deal with the problem. I’ve been talking about how an ephemeral port can be consumed, but it’s not actually the port itself. When calling the bind function, you provide not just a port, but the local IP address you want to bind to. It’s the (IP, port) pair that is limited, not the port.
So, if you want to create a TCP connection to a local process (like, say, memcache), and the pair (127.0.0.1,32768) is already in use, if there are other IP addresses that are loopback addresses, you can use those too!
On Linux, by default, all 127.*.*.* IP addresses are loopback address!
# ip route show table local
local 127.0.0.0/8 dev lo proto kernel scope host src 127.0.0.1
...
(Note that this is different from macOS, which only routes 127.0.0.1 via loopback by default).
This means that you potentially have access to a much larger space of ephemeral ports!
Applying terminology from resilience engineering, ephemeral ports are a resource, and you have to do work to mobilize these additional resources.
For Bluesky, the work of marshaling resources came in the form of modifying the code that made the TCP connections. They modified it to randomly select a loopback IP address. Here’s the code from the blog post:
// Use a custom dialer that picks a random loopback IP for each connection.
// This avoids ephemeral port exhaustion on a single IP when a container
// restarts (TIME_WAIT sockets from the old process block the fixed IP).
I wouldn’t describe this is insane, though. This is exactly the kind of improvisational work that you frequently have to do in order to get a system back to healthy during the incident.
Diagnostic challenges
Calabro briefly discusses how difficult it was to diagnose the issue, emphasis mine:
It was all buried in there, but it was hard to know where to look when so much was falling over all at once. You need to have the mental discipline and high granularity in your metrics to be able to cut through the noise to find the real root cause. It’s hard work!
I wish there had been more in this writeup about the process the engineers went through to actually figure out what was going on during the incident, because descriptions of diagnostic work is one of my favorite parts of incident write-ups. We all can stand to do better at improving our diagnostic skills, and one way I try to improve is to read about how someone diagnosed an issue during an incident.
As Calabro mentions, during an incident, there are frequently many things that are failing, and it can be extremely hard to tease out the signals that will help you understand how the system first got into this state.
One particular challenge is noticing an error signal that happens to be unrelated to the ongoing incident, as happened during this incident (emphasis mine):
EDIT: Also, the status page said this was an issue with a 3rd party provider. It was clearly not, apologies for that miscommunication! At the time I posted that status page update, I was looking at some traceroutes that indicated some pretty substantial packet loss from a cloud provider to our data center, but those were not the root cause of the issue.
The messy 9
I want to end this post by bringing up the Messy 9, a set of patterns proposed by the resilience engineering researcher David Woods. These are:
congestion
cascades
conflicts
saturation
lag
friction
tempos
surprises
tangles
I’ve explicitly discussed cascades, saturation, and lag in this post. I suspect that, if we had more detail about this incident, we’d identify even more of these patterns here. Keep on the look-out for these the next time you read an incident write-up or attend an incident review meeting!
GitHub’s been taking it on the chin on the availability front lately. Yesterday, their CTO, Vlad Fedorov, wrote a post on their blog about their recent incidents: Addressing GitHub’s recent availability issues. This post shares some additional details about three recent incidents. I’ll list them in order that they are mentioned in the post:
Feb. 9, 2026 – involved an overloaded database cluster
Feb. 2, 2026 – involved security policies unintentionally blocking access to VM metadata
Mar. 5, 2026 – involved writes failing on a Redis cluster
First observation: I really appreciate it when a company addresses availability concerns by providing more public details about recent incidents. I always think more of companies that are willing to provide these sorts of details, and I hope GitHub provides even more details about their outages in the future.
Saturation, again and again and again
The first incident is a classic example of saturation. In this case, it was an important database cluster that got overloaded. Because databases are much harder to scale up than stateless services, your best bet when dealing with overload is to figure out how to reduce the load so the database can go healthy again. On the other hand, reducing load means denying requests: a “healthy” database that is taking zero traffic has 0% availability! So it’s a balancing act, and the responders are constrained by the infrastructure that currently exists for selectively limiting traffic. Once the overload happens, you can only twist the knobs that you already have available.
Fedorov notes they’re now prioritizing implementing mechanisms to protect against these sorts of scenarios where load increases unexpectedly.
Protecting downstream components during spikes to prevent cascading failures while prioritizing critical traffic loads.
Taking it to the limit, and then over it
Fedorov also provided details on how they ended up seeing so much more traffic than usual. They released a new model (I think it’s an AI model) on a Saturday, when traffic is lower. And then, on Monday, multiple different factors contributed to an increase in traffic that pushed them over the limit. The blog post mentions these four contributors:
new model release
they had reduced a user settings cache TTL from 12 hours to 2 hours, increasing write load
they hit their regular peak load on Monday
many of their users updated to the new version of their client apps, and this update activity increased read load
They had reduced the TTL so that people would get the new model more quickly, but reducing the TTL means that more cache evictions, which meant more database load.
This compounding effect of multiple factors is pernicious, because it can be hard to reason about why your system hit a tipping point. From the write-up:
While the TTL change was quickly identified as a culprit, it took much longer to understand why the read load kept increasing, which prolonged the incident.
Understanding the role of multiple, independent contributing factors is hard enough in a post-incident analysis, identifying this in the heat of an incident can be damn near impossible.
The thing about tipping points is that you don’t notice until you tip
This failure mode was a case where the danger was growing over time, but there were no visible symptoms until they hit the limit.
The architecture was originally selected for simplicity at a time when there were very few models and very few governance controls and policies related to those models. But over time, something that was a few bytes per user grew into kilobytes. We didn’t catch how dangerous that was because the load was visible only during new model or policy rollouts and was masked by the TTL.
The resilience engineering folks would call this an example of a brittle collapse, where a system falls over when it hits the limit. We do our best to monitor for trouble and anticipate trouble ahead, but we’re always going to hit scenarios like this where signals of a problem are being masked, until the perfect storm hits. At that point, we just have to be good at responding. And, hopefully, good at learning as well.
Failovers are a different mode of operation
Their February 2nd incident involved a failover where they had some sort of infrastructure issue in one(?) region. GitHub has mechanisms for automatically shifting traffic to healthy regions, and that mechanism worked here, but there was another issue that they hit:
However, in this case, there was a cascading set of events triggered by a telemetry gap that caused existing security policies to be applied to key internal storage accounts affecting all regions. This blocked access to VM metadata on VM creates and halted hosted runner lifecycle operations.
It was the combination of the traffic failover and a telemetry gap that ultimately led to the outage. (Did the automatic traffic shift end up making things worse? I can’t tell from the write-up). The traffic redirection didn’t create the incident, but it enabled it to happen. Whenever our system runs in an alternate mode, there’s an increased risk that we’ll hit some weird edge case that we haven’t seen before because it doesn’t regularly run in that mode. Automated reliability mechanisms often put our systems in these alternate modes. This means that they can enable novel failure modes.
In fact, the March 5th incident followed a similar pattern, this time it was a Redis cluster primary failover enabled the incident.
The failover performed as expected, but a latent configuration issue meant the failover left the cluster in a state with no writable primary.
Reliability vs security, the eternal struggle
The Feb 2nd incident also illustrates the fundamental tradeoff between reliability and security. Reliability’s job is to ensure service access to the users who are supposed to have it. Security’s job is to deny service access to the users that aren’t supposed to have it. These two forces are are in tension, as we see in this incident where a security mechanism denied access.
It’s not just about automation, it’s about more options for responders
In the Feb 9th incident, Fedorov notes how the responders lacked certain functionality that would have helped them mitigate (emphasis mine)
Further, due to the interaction between different services after the database cluster became overwhelmed, we needed to block the extra load further up the stack, and we didn’t have sufficiently granular switches to identify which traffic we needed to block at that level.
He also notes how they had to manually recover from the March 5th incident:
With writes failing and failover not available as a mitigation, we had to correct the state manually to mitigate.
I hope they don’t pull all of their eggs in the “automation” basket in their remediations. For the first incident in particular, automated load shedding is tricky to get right, it’s hard to reason about, and you won’t have experience with the behavior of this new automation until either you have the incident, or until the automation actually creates an incident (e.g., opens a circuit breaker when it shouldn’t). Making it easier for the responders to manually control load shedding during an incident is important as well.
More generally, reliability work isn’t just about putting in automated mechanisms to handle known failure modes. It’s also about setting up the incident responders for success by providing them with as many resources as possible before the next incident happens. In this context, resources means the ability to manually control different aspects of the infrastructure, whether that’s selective traffic blocking, manually updating database state, or many of the other potential remediations that a responder might have to do. The more flexibility they have, the more room to maneuver (to use David Woods’s phrase), the easier it will be for them to improvise a solution, and the faster the next surprising incident will be mitigated.


