The research field known as cognitive systems engineering (CSE) emerged in the early 1980s as a subfield of safety science. That time period saw a dramatic rise in the use of computer-based automation for controlling safety-critical systems. One of the big ideas of CSE, I would even call it the big idea of the field, is that introducing new automation changes the nature of the work that humans do. It’s not that automation means that humans now have less to do: instead, it means that humans face a different kind of work, some of it being genuinely novel.
It’s in the spirit of CSE that I read with interest the recent Anthropic white paper from Nathan Wilmers, Regina Catipon, Maxim Massenkoff, and Peter McCrory titled How employment is changing at Anthropic. It’s a study of how work is changing inside of Anthropic with the embrace of LLM agents. Here are some thoughts I had reading this.
Attention is all used up
Keeping the agents busy is a challenge: these agents spend more time waiting for human input than they do getting work done. Notably, there’s no discussion in the paper about whether agent utilization is genuinely important to the business or not. But what’s clear from the paper is that humans are the bottleneck. More specifically, they point out that human attention is the bottleneck.
Figure 6 in the paper has a fun graph about how much time it would take a human to simply read all of the output generated by their agents, given the average number of tokens outputted per session, assuming 0.75 words per token, and a reading speed of 250 words per minute. For marketing and comms, it would take 12 hours for a person to read the output generated by a week of agent usage, which is 30% of a 40-hour work week (assuming 40 hour work weeks is naive, I know, but let’s go with it). For legal, policy & trust, it’s 26 hours, which is 65% of a 40-hour work week. For finance and accounting, it’s 43 hours of reading, or 108% of a work week. And for engineering and research, it would take 424 hours(!). I’m not going to compute the work week percentage for this one, but the discriminating reader will note that there are only 168 hours in an entire week. What this means is that there is literally not enough time in a week for engineers to read all of the Claude output, even if they work 24×7.
They’re like, I need my juice box opened and it’s an emergency that my juice box is opened. And that is voiced with the same level of concern as the one who has sliced their finger and is bleeding.
The quote above is taken from an engineer pointing out that not all agent requests for human attention are created equal, but that the agents themselves do a poor job at coordinating with the humans to effectively communicate the level of urgency involved in a request. Here I want to reference a famous CSE paper, now over twenty years old, called Ten challenges for making automation a “team player” in joint human-agent activity, written by Gary Klein, David Woods, Jeffrey Bradshaw, Robert Hoffman, and Paul Feltovich. Two of the challenges mentioned in the paper are:
An agent must have a model of the behavior and beliefs of the other people involved in the joint activity
An agent must be able to observe the behavior of the humans and use that information to identify their current states and intentions
These are about how agents need to have a model of the humans they are interacting with, in order to effectively coordinate with them In CSE terms, these agents are not good team players. Because the agents don’t have a good model of the engineer’s current goals and state, they aren’t able to make decisions about when it’s appropriate to vie for the engineer’s attention.
From engineers to managers (but still engineers)
One solution to this deluge is rising automation. But this requires work of a different kind.
The paper describes how the work at Anthropic is shifting to meta-work, more commonly referred to as management. More and more of their engineers’ time is spent on coordinating work in dealing with the agents. The paper has some fun examples of this, including attempts to automate it: an agent that triages requests from other agents, doing performance reviews of agents, writing specs for multi-agent runs, looping one agent to review the output of another agent.
The paper even tries to estimate the amount of time spent on meta-work, as shown in figure 7, which has the fantastic title “Becoming managers of Claudes”. The group with the highest meta-work overhead is infrastructure, at 29%.
Judgment and autonomy: the decline of the junior hire
“the thing that raised eyebrows was the uplift for performance engineers in particular and it basically overnight changed what we were looking for.”
One of the main themes in the paper is a hiring trend: they are hiring fewer junior engineers. However, this drop in junior hiring isn’t related to the fact that seniors have deeper domain expertise than juniors. In fact, they specifically call out that domain expertise is becoming less of an issue for hiring managers. Instead, they note that hiring managers are looking for candidates who exhibit good judgment and are capable of working autonomously. Junior engineers are typically responsible for executing on well-defined tasks, and it sounds like they see have internalized the idea that LLM agents can replace juniors at doing this sort of work. But they aren’t yet able to use LLM agents to replace the judgment of senior engineers, and they don’t yet trust their LLM agents to work at the level of autonomy that a senior engineer works at.
This is both unsurprising and depressing. Senior software engineers don’t spring fully formed from Zeus’s forehead; if the industry stops hiring junior engineers, eventually there won’t be senior engineers around anymore. I’d had a sense that it was getting harder for junior devs to find positions, and this is a data point in support of that theory.
I also wonder if Anthropic will tailor their interviews to focus on assessing the quality of judgment of their senior candidates, as well as their ability to work autonomously. I bet if you asked them today, they’d say “we already do assess that”. But I also bet they don’t just have an explicit “judgment” interview and an explicit “autonomy” interview, that they try to gather this info from the existing interview tropes, like coding and system design. Would be very interesting if they transitioned entirely to focusing on experience for these senior hiring interview rounds, although there’s no evidence in the paper about this happening.
Grab bag of trends
A break from managing the agents typically looks like jumping into a meeting.
Time spent in face-to-face meetings is trending upwards. The authors hypothesize that engineers spend more time on strategic work, and resolving questions of strategy requires more conversation among the humans.
The percentage of non-engineers is dropping at Anthropic. They note that the ratio of engineers to product managers is increasing over time: currently the ratio is seventeen engineers to one product manager. This surprised me: I would have assumed that product managers would be endlessly busy coming up with new product ideas, and so the demand for product managers would be going up relative to engineers rather than going down. Then again, I don’t really know what product managers do at Anthropic.
There is organizational pressure to have work discussions happen in places where the agents can observe. This means having them in public Slack channels, as opposed to private DMs or in unrecorded meetings. They want to ensure that the work is visible so that it is legible to the agents.
Outro
It was fun to see Anthropic make an attempt to observe itself like this. I hope more companies look at how AI is changing the work that their employees do, and what new challenges their employees face. I also hope people discover CSE research and how relevant it is to the age of LLM-based automation.
On Mastodon, Ole Peder Brandtzæg pointed me to (yet) another GitHub incident that happened back on Sept 23. The write-up is very short, so I’ll just excerpt the whole thing here (emphasis mine):
Starting at 07:57 UTC on September 23, GitHub experienced elevated 500 and 404 responses across several application pages. This caused failures when installing GitHub Apps, creating organizations, and making some organization membership changes. Customers also experienced delayed label updates and stale search results in Projects.
The infrastructure failure was isolated to our Azure Central US region. The API errors were mitigated by 10:58 UTC on September 23. Projects’ processing continued to recover while an accumulated backlog was drained, and full service was restored at 04:55 UTC on September 24.
The incident was caused by a failed planned maintenance operation on a primary database. Automated recovery initiated an emergency database failover, after which several replicas in the affected region were unable to resume replication correctly. This reduced available database capacity and caused the API errors and downstream Projects processing delays.
We have mitigated the immediate failure mode. We are also improving maintenance safety checks, database failover handling, post-failover replica validation, and downstream processing resilience to reduce the likelihood and impact of similar incidents.
There really isn’t much to go on here, but let’s make the best of it.
Unlike previous GitHub incidents, this one doesn’t sound like a “hit a tipping point due to increased load” sort of failure mode. Instead, the trigger here was planned operations work. They don’t discuss the rationale for the planned maintenance, and so it may very well be that the work was being done to increase capacity, in which case it does rhyme with the other “increased load on GitHub” incidents. Or perhaps the planned maintenance was intended to deal with some other issue. There just isn’t enough information here.
The incident was caused by a failed planned maintenance operation on a primary database.
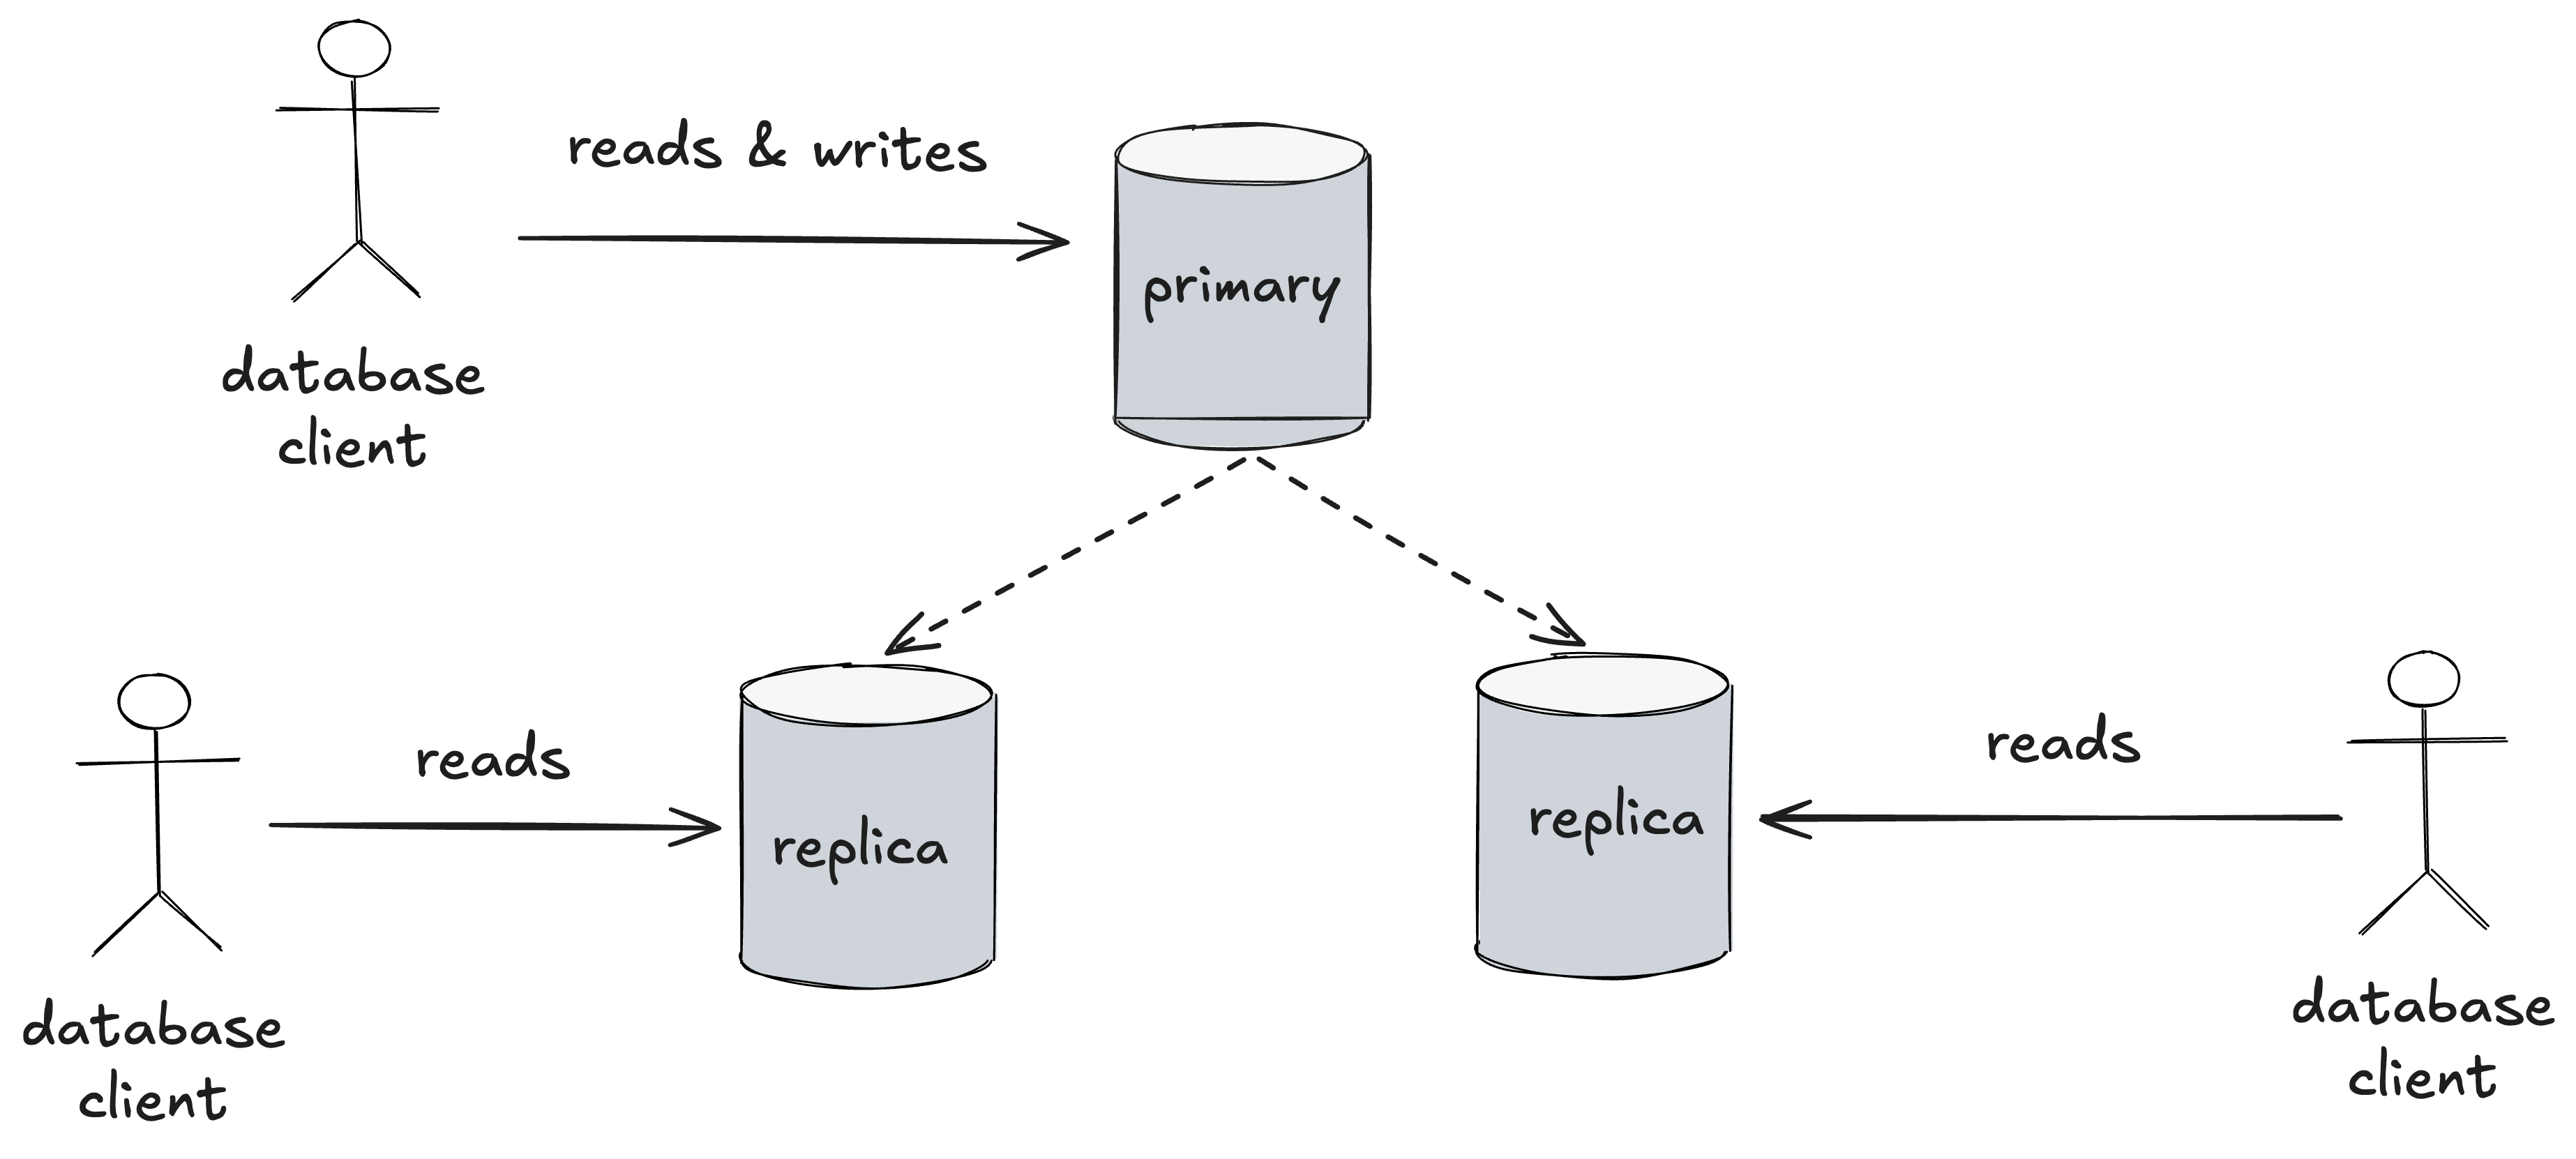
All we really know from this write-up is that something went wrong with the maintenance operation, because it describes the operation as “failed”. From the write-up, it sounds like they were running a database cluster, where they had a primary and replicas.
A primary-replica database cluster: all database nodes can service reads, and the primary services writes
The nice thing about this sort of setup is that, if the primary fails, then a replica can automatically take over as primary, which significantly reduces downtime, which is how this database cluster was configured.
Automated recovery initiated an emergency database failover, after which several replicas in the affected region were unable to resume replication correctly.
But, again, all we get from the write-up is something went wrong with this process. It sounds like a new replica was successfully promoted to primary, but the other replicas were somehow unable to connect to the new primary.
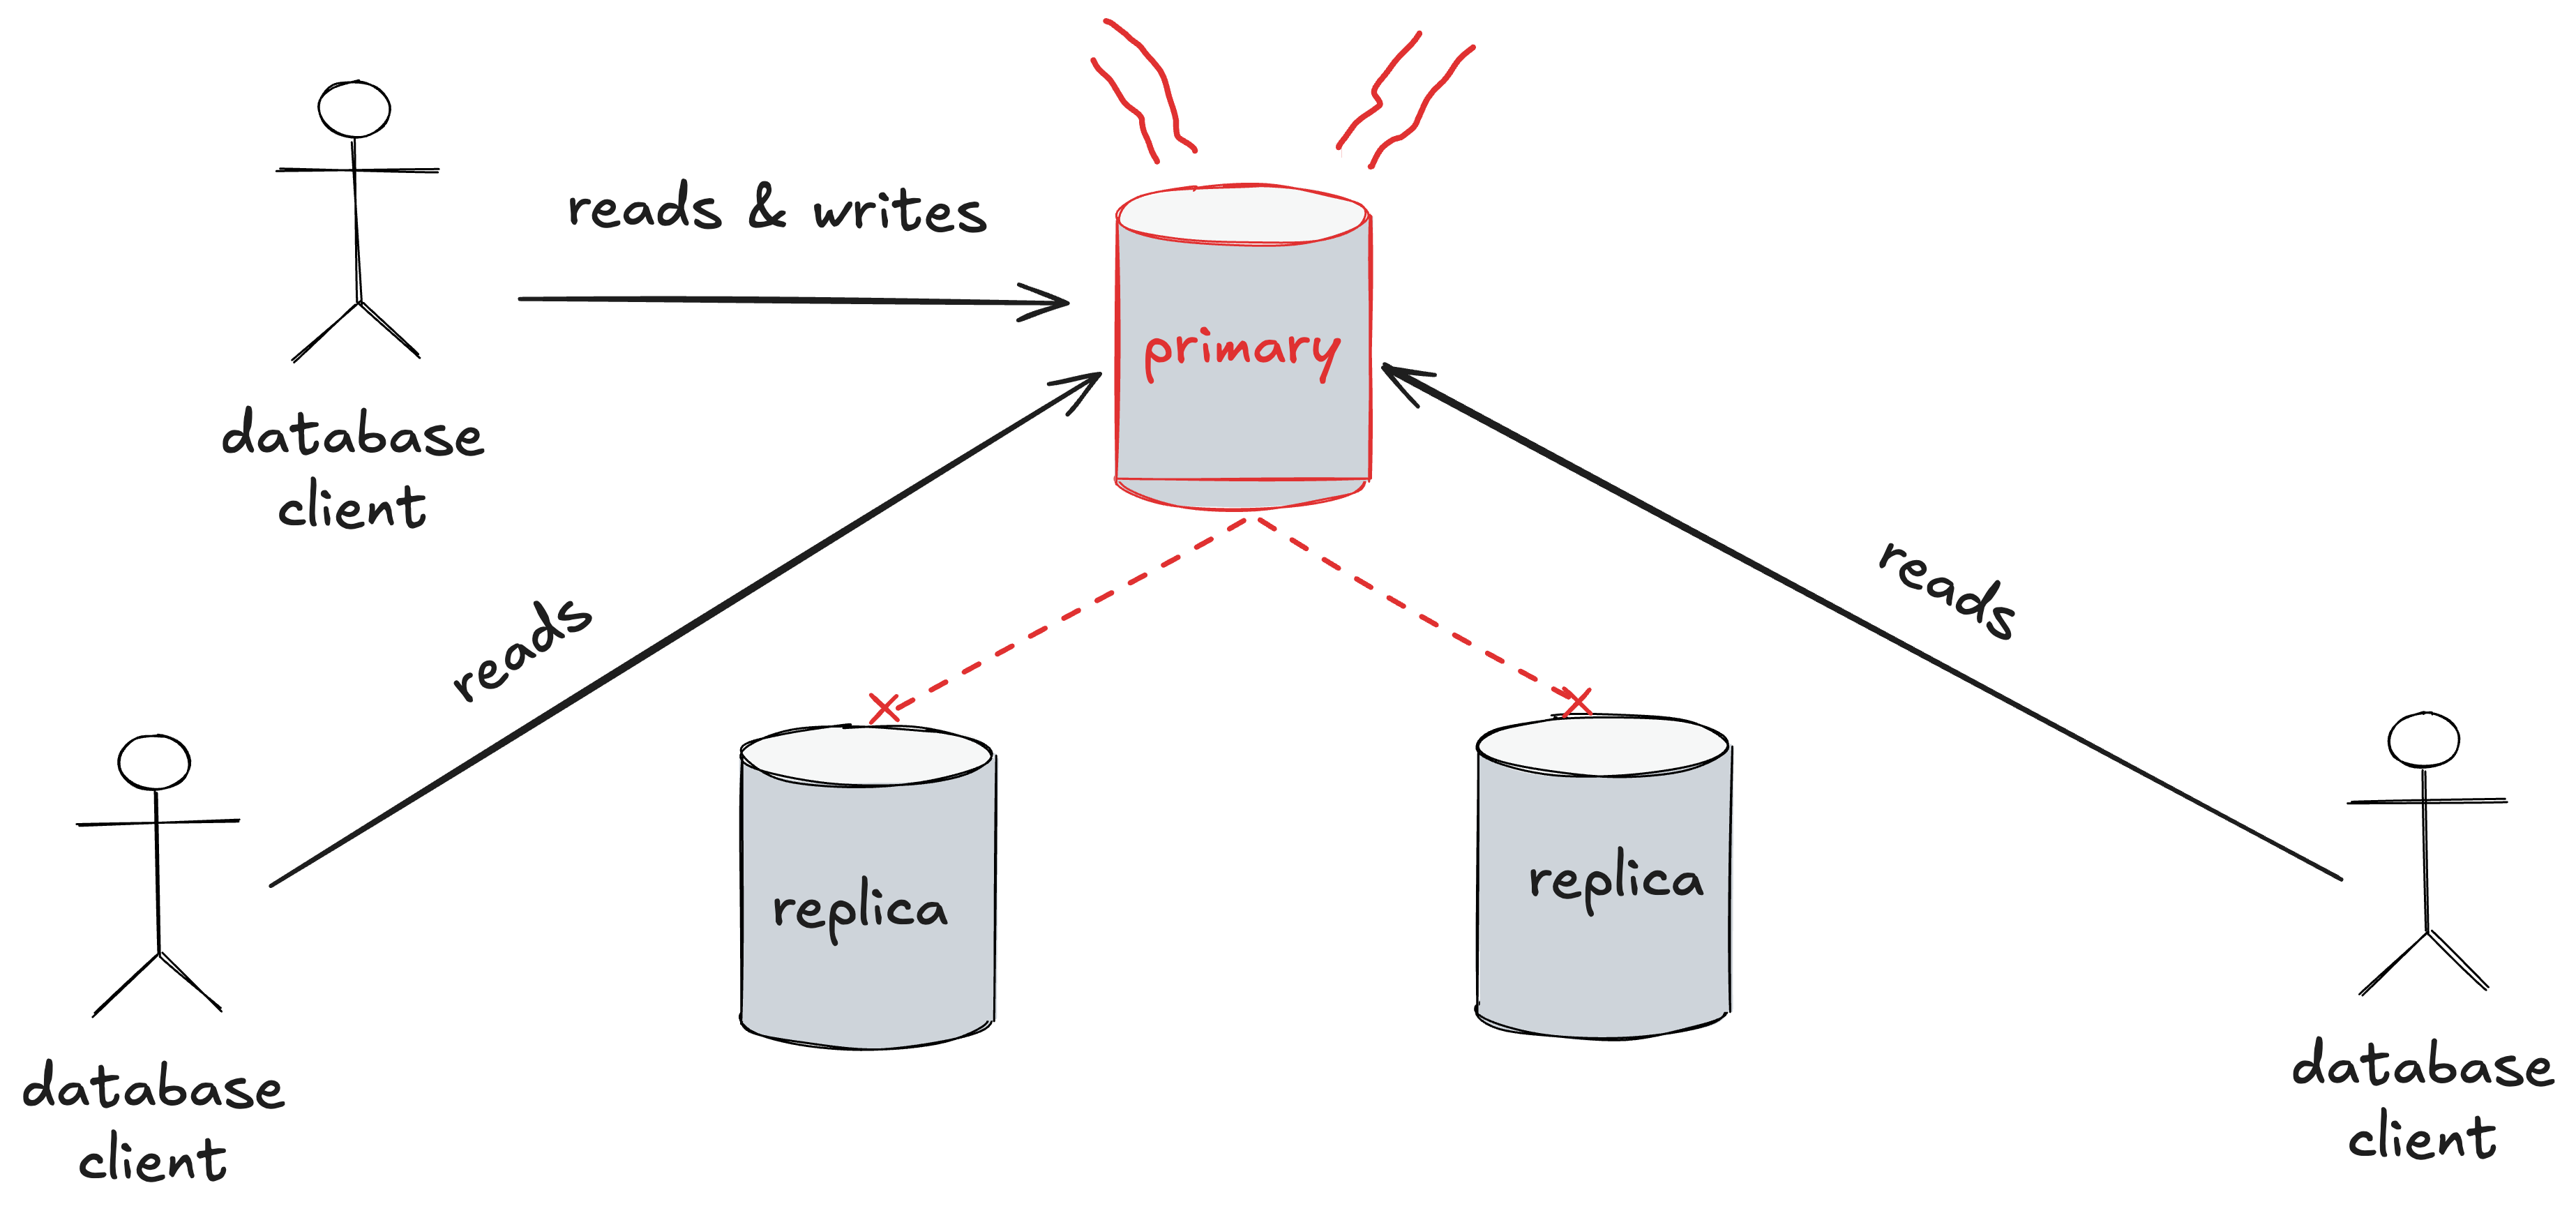
Another advantage of a primary-replica style database cluster is that you can divide up the read request traffic across the entire cluster, which gives you more capacity. Conversely, if you lose the replicas, then the primary has to service all of the requests. This increases the load on the primary.
When the replicas fail to replicate, the primary becomes responsible for servicing all of the read traffic
This reduced available database capacity and caused the API errors and downstream Projects processing delays.
Based on the write-up, it sounds like the primary was not able to handle all of the traffic that resulted from losing the replicas. Note that even though this incident was not triggered by an increase in load, it still ended up being a saturation-related failure mode because of the loss of capacity due to the effective loss of the replica nodes.
Lex Neva (of SRE Weekly fame) pointed me to this recent GCP incident report, which describes networking issues they experienced in their us-central1 region. This incident is yet another reminder of why I don’t work in networking: I think that networking engineers are required to work within systems that are inherently unsafe by their very nature.
Now, I’m on the record for stating that human error is not a useful construct. However, I recognize that I’m in the minority here, and that most people believe that human error is a real and useful thing to talk about, so I’ll go with it here. I believe that for a system to be safe, it needs to be error-tolerant. An error-tolerant system is a system that does not fail hard even when a human makes an error. Achieving error-tolerance means having things like cross-checks, and the ability to recover quickly if an error does lead to a genuine problem. If you think about the way we typically roll out code to production, there are typically multiple checks involved (e.g., code review, unit tests, CI checks, tests done in a staging environment, canarying). In addition, we use techniques like progressive rollouts, blue-green deploys, and feature flags to reduce the harm if bad code makes it out to production.
I’m not a network engineer myself (I’ve never managed more than a single rack of servers, which involves a grand total of two switches), so I can’t speak from direct experience about the nature of the work. But every time I read an incident write-up that involves networking, it screams to me “this is not an error-tolerant system that network engineers have to work within”. Whenever you have to muck around with networking gear, very bad things can happen. From the GCP report, here’s the entire (sigh) “Root Cause” section (emphasis added):
The event was triggered by the inadvertent physical disconnection of network fiber-optic cables during routine hardware maintenance. A technician was performing a scheduled capacity upgrade on data center routers that support a fraction of capacity in the us-central1-b zone and a small fraction of capacity in the us-central1-f zone.
During the hands-on maintenance, optical fibers connecting the data center routers to the network fabric were unplugged and the optical transceivers were replaced with a transceiver that supports higher-density connectivity. This transceiver was not compatible with the transceivers still in place in the data center fabric, causing a loss of connectivity for each fiber.
The network is designed with redundant routers in separate data center rooms within the same building so that failure of one router does not interrupt service. The maintenance was intended to upgrade one router at a time over several days, with traffic diversions at each step and verification between steps that the network has returned to a fully-connected state.
However, a procedural error in the manually orchestrated upgrade process caused the complete list of transceiver replacements across all routers to be issued to the technician without instructions to sequence the work one router at a time. The maintenance workflow also did not include the expected human and software verification steps for detecting unintended disruption.
As a result, the technician sequentially unplugged all fiber paths across the affected devices within 13 minutes. The speed and nature of the error prevented warnings of incorrect action from reaching the engineer before connectivity was lost. Additionally, a standing procedure to halt if light is detected on any fiber-optic cable after unplug was not followed.
This resulted in compute capacity in the impacted zone being isolated from the network. Customers were unable to reach their virtual machines, and those virtual machines could not establish connections outside their zone.
The report attributes the incident to two errors:
correctly following an incorrect procedure
incorrectly following a correct procedure
Contrast the paucity of this analysis with the talk that Sean Klein gave at QCon SF 2025 about an Azure global networking outage that occurred back in January 2023. That also involved a networking engineer carrying out a change where the instructions contain a procedural error. However, Klein goes very deep into the history of how that came to be.
We’re also provided with no context about the nature of the work, so I have no idea how it came to be how the procedural error was introduced, or that the engineer didn’t follow the standing procedure. (Maybe they were distracted by some other aspect of the work that is part of the procedure?) All we have is the hindsight judgment that they didn’t do the right thing.
This line also jumped out at me:
The maintenance workflow also did not include the expected human and software verification steps for detecting unintended disruption.
Our procedures are never going to be perfect. And that’s exactly why I wince every time I see “human didn’t follow the procedures” as a reason for an incident. Documented procedures are a tool, and the human consuming them has to use their judgment about how to apply the tool. If your system assumes humans perfectly following perfect procedures then, well, you’re in for some surprises.
Here are the follow-up action items (emphasis mine):
Reinforce training in us-central1 region and globally around safe maintenance techniques, including the mandatory requirement to verify whether light is on every unplugged fiber.
Finish the migration of network upgrade workflows to a fully automatically sequenced orchestration system. Most common regional network workflows were completed in 2025, and zonal workflows are in progress.
Complete the deployment of work stop alerting for actions resulting in the unintended disconnection of live fiber cables in Google data centers.
Complete the deployment of the automated system that will move regional traffic away from faulty zones, reducing the time from approximately 19 minutes in this instance to around 5 minutes.
Now, I’m confident that Google did a more extensive investigation than what they wrote up. But even so, attributing the outage to two human errors, and listing training as an action item (blame and train!) are big red flags to me that they don’t understand how work actually gets done in their own system.
I also note with interest how the the other actions involve deployment of new automation, which will likely introduce novel failure modes even as they eliminate the sorts of failure modes that occurred in this incident. I hope the Google SREs are ready for them.
In the meantime, I recommend they check out the book Behind Human Error.
When it comes to public incident write-ups, GitHub continues to be the gift that keeps on giving. They keep suffering collateral damage from the AI boom, as more developers using AI means more load on their system. Their developer focus also means that they provide some technical details about these incidents.
Today I’m writing about the incident that happened to them on September 13. The report has the vague title Incident with several GitHub Services, which was the title when the incident was declared. It’s a shame they don’t re-title their incidents later on.
The report is short enough that I’ll simply excerpt the three paragraphs that discuss the failure mode.
The cause was an internal data-cleanup job that began writing to a shared database cluster at 07:33 UTC. That cluster stores permission data read on nearly every authenticated request. The safeguard that was pacing the background job watched only one health signal — how far the database replicas were lagging — and that signal stayed low the whole time. It did not account for the load building on the primary itself, so the job kept writing while the primary quietly ran toward its limit.
When the primary ran out of available connections, requests that needed it could not complete. First, there was no quick timeout on these database calls, so request handlers waited on the stalled database instead of failing fast, and the shared request-handling capacity degraded into site-wide errors. Second, a retry loop around token creation kept re-sending the writes that were already failing, which held the database saturated rather than letting it recover.
Monitoring declared the incident at 08:50 UTC, but due to the broad impact and amplification from token creation, it took time to identify the source of the load. First responders mitigated by shedding internal load and pausing the job, and all services recovered by 10:44 UTC.
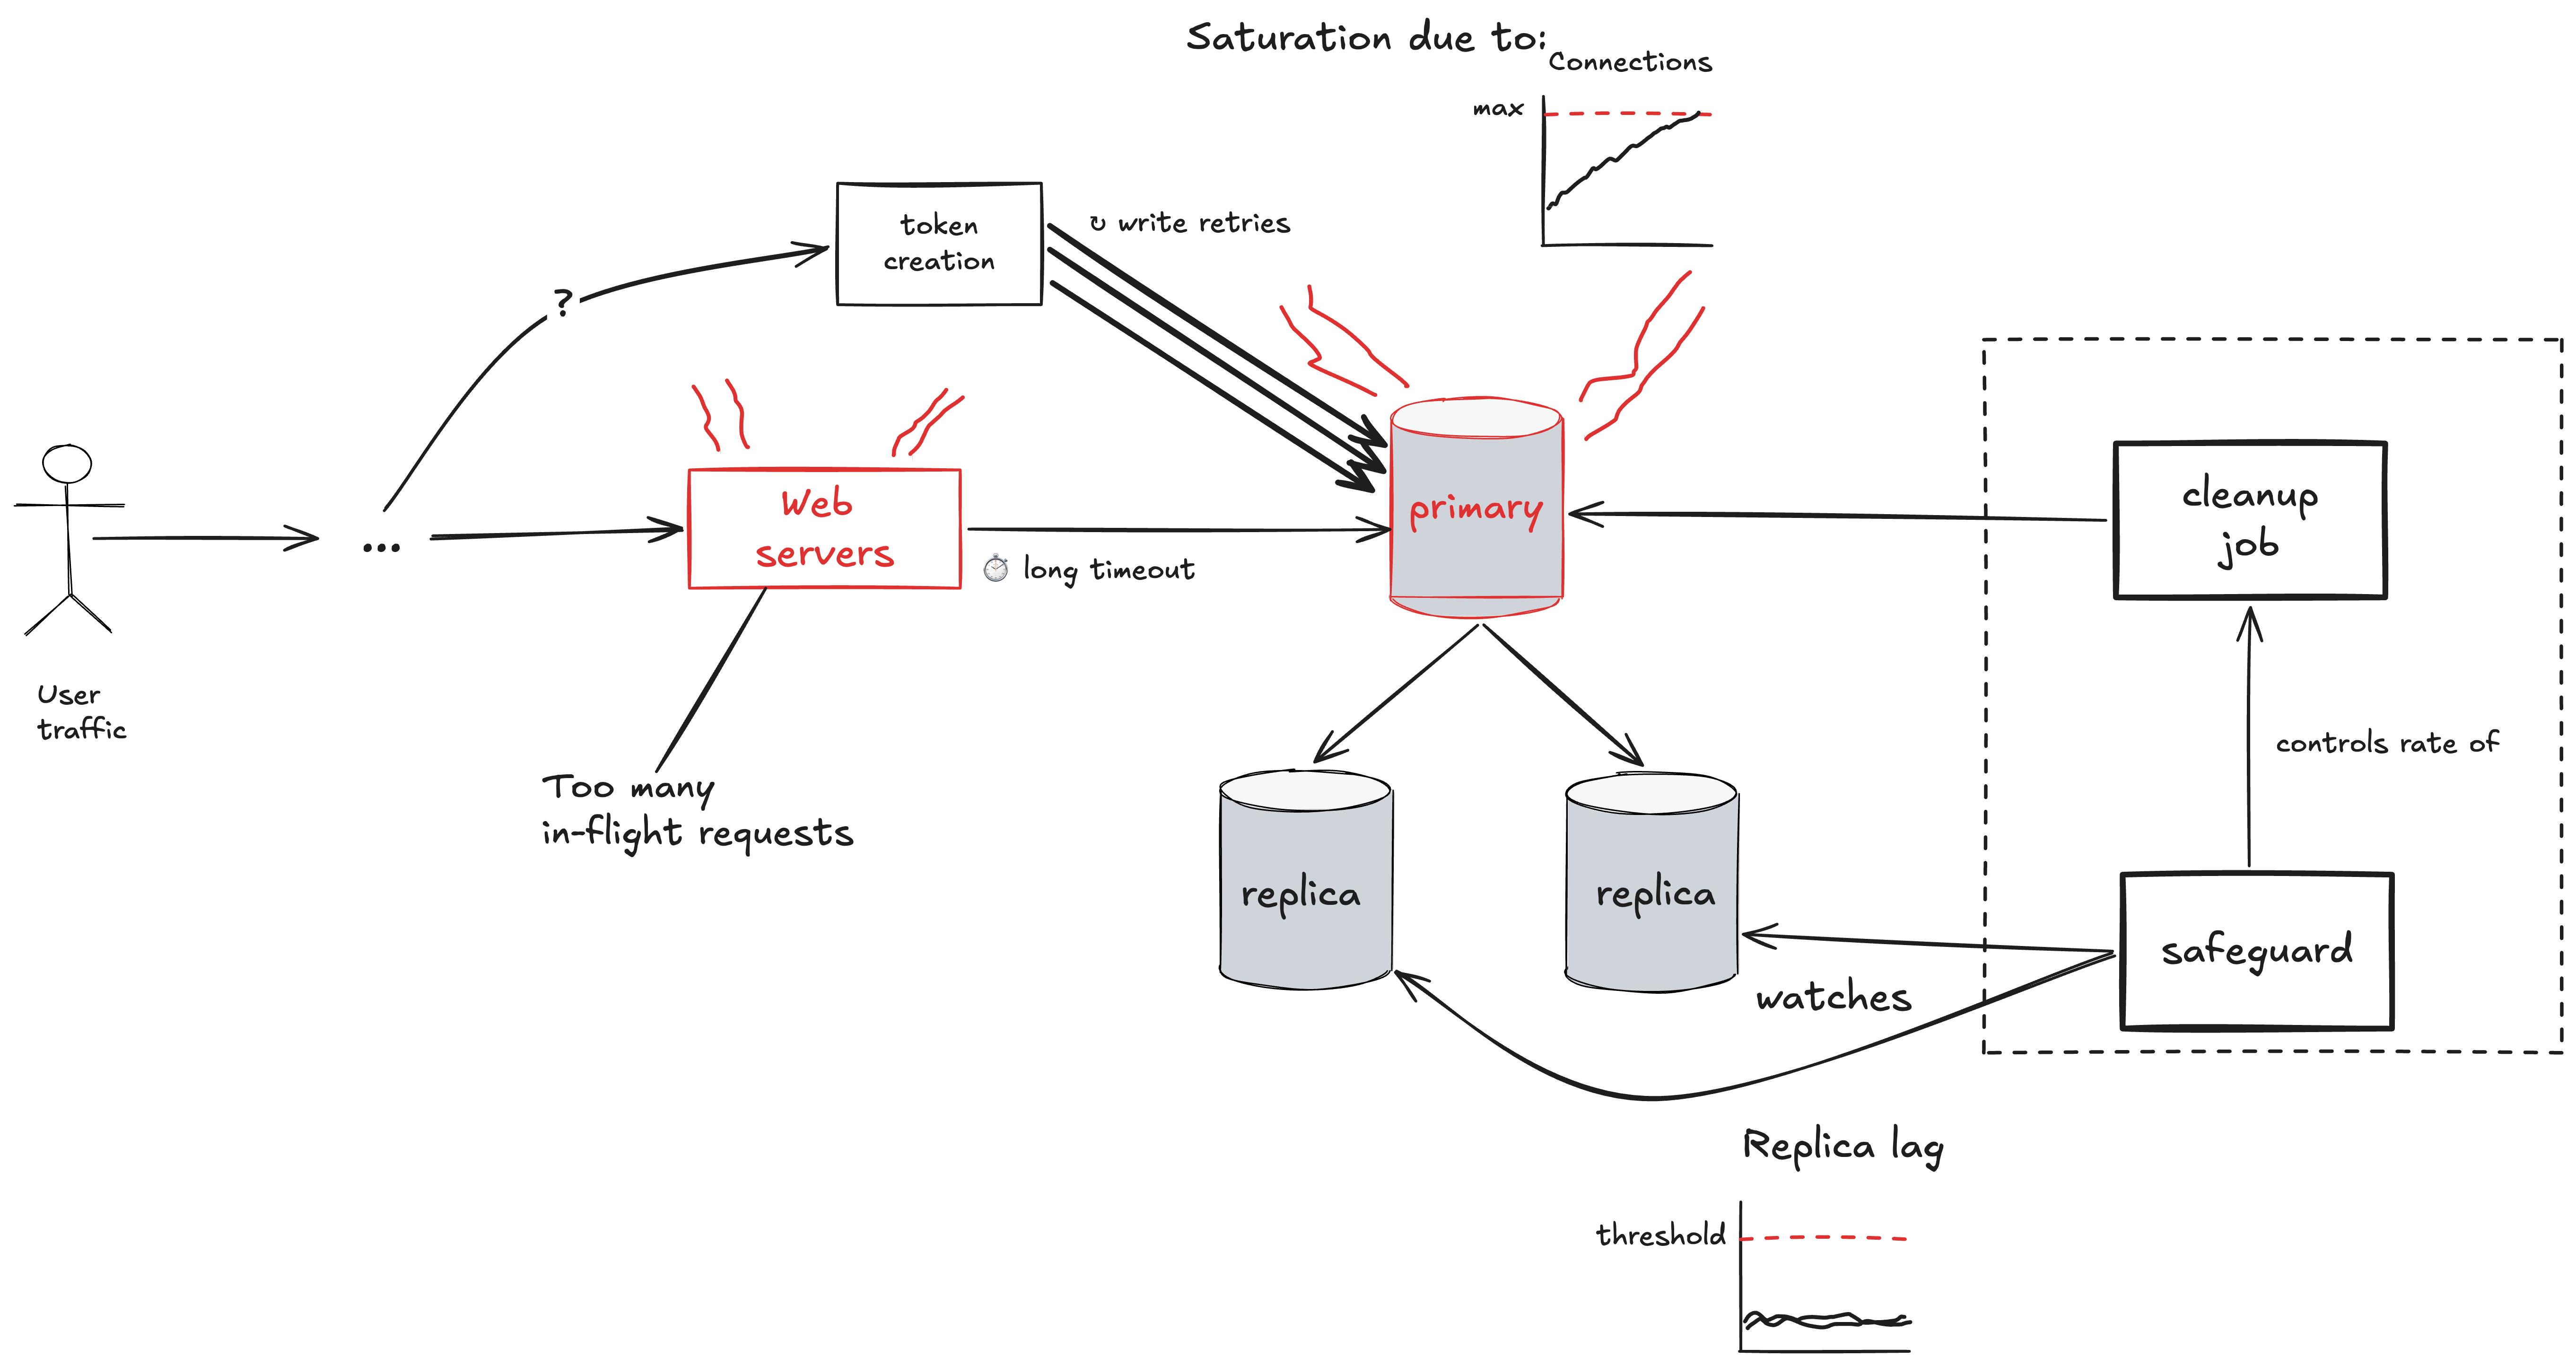
Here’s my attempt to depict this text with a diagram, and to rephrase the above in my own words.
Within GitHub, there is a database cluster in the typical SQL database style cluster configuration, with a primary and read replicas, where the primary is responsible for handling all of the writes. This cluster takes online traffic: meaning that activity from external users will generate queries against this cluster.
GitHub ran an offline job (i.e., not driven by user traffic) that made queries against the database to clean up unneeded data. The rate at which this cleanup job queried the database was governed by a safeguard mechanism that monitored the health of the database: the safeguard system would reduce the rate of queries if the database appeared to be going unhealthy. The safeguard monitored the health of the database using the replica lag (if they were using MySQL, presumably they were tracking Seconds_Behind_Source). An increase in this replica lag can be a symptom of high load on the replicas.
In this scenario, the replicas themselves were healthy, and the replica lag stayed below the threshold that the safeguard was monitoring. However, it was the primary node of the database cluster that was at risk of saturation. Specifically, the primary reached its maximum number of client connections (on MySQL, this is controlled by the max_connections server system variable). This means that any attempt to query the database over a new connection would fail with an error (on MySQL, this would be ER_CON_COUNT_ERROR, with an error message of Too many connections.
When some web servers attempted to make calls to this database, the requests did not succeed immediately, but neither did they fail immediately. Instead, these requests were stuck waiting. Unfortunately, the timeouts configured on these request handlers were long. This meant that these blocked requests accumulated in the impacted web servers. Each in-flight request consumes some amount of resources, and enough of these blocked requests accumulated in the web servers that they themselves became saturated, which led to sitewide impact.
To make matters work, there was a token creation process that kept trying to query the primary, failing, and then retrying. This placed a continual load on the primary that made it more difficult for the system to recover.
Aside: some unanswered technical questions
Here some questions I had that I couldn’t figure out from the text.
How did exhausted connections lead to timeouts on the web servers? Was it the case that the web servers were using connection pooling, not all of the connections in the pool were active, and the clients were stuck waiting for a new active connection that never came?
How did that background job lead to the primary exceeding the maximum number of connections? Did this job consume a surprisingly number of connections? How close was the database to the limit before the job started?
—
You can never truly know where the safety boundary is
When you have an offline job running against an online database, there’s always a risk that it can negatively impact the performance of the database, and thereby affect customer traffic. The nice thing about offline jobs is that they are, in principle, fully controllable by the organization. With user traffic, on the other hand, you are at the mercy of your users.
And, so, GitHub had an automated system (the safeguard) monitor the health of the database while the cleanup job was running, to ensure that the job was not applying too much load to the database. If the load was getting high, then the safeguard would slow down the rate at which the cleanup job was querying the database. The problem was that the metric being monitored by the safeguard did not give a complete picture of the health of the cluster. As far, as the safeguard was concerned, the database was still healthy, even though it was running out of connections. This is a great example of a gray failure: when your internal health monitoring systems register, incorrectly, that the system is healthy. In other word, the metrics are good, but the users are unhappy.
Putting things in resilience engineering terms, the system misjudged the location of the safety boundary. There was no signal that the system was getting close to being in an unsafe state until the boundary was crossed. Note that we never actually know where the safety boundary is until we actually cross it. But crossing the safety boundary is very, very bad. And so we always have to make an estimate about where the safety boundary is, and then we avoid getting too close. But there are so many limits in the system, that the chances of us not monitoring all of them is, tragically, quite high.
Offline jobs and online databases: sometimes you gotta run ’em
In an ideal world, we would want all of the query traffic for our online databases to be, well, online traffic. That’s why, for example, we don’t run our analytics queries against our online databases. However, there are scenarios where you have no choice: you have to run a job against an online database, because you want to effect some sort of change to the online data. This is a great example: here the job has to be run on the online database because the goal of the job is to make a change to that data.
The double-edged sword of cleanup
When it comes to the topic of “cleanup”, both for data and code, once you’ve seen enough incidents, you’ll notice a pattern: cleanup is a frequent risk. Sometimes incidents happen because a cleanup job was attempted, and the thing being cleaned up was still in use. And sometimes incidents happen because some entity that wasn’t even used anymore interacted in an unexpected way with a different part of the system. In other words: an absence of cleanup contributed to the incident. So, not cleaning up unused stuff is a risk: it can lead to incidents. But the act of cleanup is itself a change to the system that carries risk. It’s all risk tradeoffs.
The asymmetry of misconfigured timeouts
Timeouts are an essential tool in building reliable distributed systems. But there’s an asymmetry in the timeouts-are-too-short problem versus the timeouts-are-too-long problem. If your timeouts are too short, you’ll notice this during the normal operation of your system, by seeing excessive timeouts happening. And, so, when that happens, you adjust the timeouts to be longer.
However, timeouts that are too long are harder to detect. If you’re lucky, you might notice some sluggishness in your user interface and diagnose the problem as being related to timeouts being too long. But, in many cases, you won’t have any signal at all that timeouts are too long until they contribute to an incident. As we saw here, long timeouts create a saturation risk by increasing the number of in-flight requests in a service, thereby depleting its resources.
You probably have timeouts that are configured to be too long in your system, and nobody has noticed them yet.
Retries help, until they hurt
Retries are yet another essential tool in building reliable distributed systems. Because transient failures are common, retries can effectively mask these failures from your users: they’ll never know about that one bad pod in your deployment. But retries increase load, and in a saturation failure mode, you can get a pathological behavior where retries exacerbate the incident. That’s what happened in this case, where a particular service (token creation) kept retrying over and over again, leading to unending load on the database.
You need retries! But, like misconfigured timeouts, it can be hard to catch misconfigured retries until the incident happens. That’s exactly why our industry has a specific term for failure modes where retries made things worse: retry storms.
When you’re overloaded, you need to reduce the load
Let’s look at the last quoted paragraph again, since it has some details about the incident response (emphasis mine).
Monitoring declared the incident at 08:50 UTC, but due to the broad impact and amplification from token creation, it took time to identify the source of the load. First responders mitigated by shedding internal load and pausing the job, and all services recovered by 10:44 UTC.
Those of us who do incident response know that our first priority is always getting the system back to healthy. If you can quickly identify the source of the problem, that’s great! Go ahead and roll back that problematic deploy. But often we can’t tell what’s causing the problem. In a saturation failure mode, we can often identify which service has gotten overloaded (and, very often, it’s a database), but it isn’t obvious what the source of the problem actually is. In scenarios like this, you want the responders to be able to:
quickly identify the sources of load (which queries, and who is making them?)
manually shed load (block specific queries/sources)
To have that operational tooling at your fingertips during an incident, you need to have built it in advance. During the incident, it’s too late, you’re stuck with whatever tooling is available.
Your systems will eventually become overloaded, this I promise you. Your online databases at particular risk. The time to prepare for this is now.
The solution, as always, is to increase complexity
Here’s the last paragraph of the write-up:
To prevent recurrence, we are rate-limiting background jobs against shared, customer-serving databases by default, and adding automatic pausing and paging on primary-server load rather than replication lag alone. We are also surfacing running background work directly alongside database health signals so responders can see and pause it without leaving those dashboards, bounding retries in the token-issuing path, and adding request-level timeouts so one unhealthy database cannot consume shared web server capacity. In addition, we are breaking apart this database cluster to remove the single point of failure. We will be moving various service-specific data, including the authorization data, out of this shared cluster in the next two weeks.
These all look good interventions to me. But note how these all increase complexity! They all involve adding new stuff to the system, as post-incident interventions always do. I am on record as stating that increasing complexity in order to improve reliability is inevitable. But we should be sanguine about this. By increasing complexity, we eliminate known failure modes at the cost of introducing novel failure modes. And introduce them we do.
A hallway in a tech company office. A and B are standing in the hallway. B is holding a multiple page document.
A: Wow, that incident from a couple of weeks ago was a real doozy. Do you know how it happened?
B brandishes the document.
B: As it happens, I just finished reading through the incident write-up. They did a pretty thorough investigation.
A: You printed it out? I didn’t know we even had printers in the office anymore.
B: Yeah, I find it easier to read on paper than a computer screen. Anyways, there’s a lot of great detail here, about the history behind the changes that contributed to the incident, about how confusing things were for the responders during the incident response, the tools that the responders used to diagnose what happened, the levers they pulled to actually mitigate the customer impact… I learned a ton from it. Would you like my copy?
A looks skeptically at the document.
A: Wow, that’s a long report.
B: Yeah, it’s about thirty pages. But that’s what it took the authors to explain everything. Like I said, lots of great detail.
A: I don’t know about you, but I’m pretty busy these days.
B: To be honest, I am too. The upcoming launch is keeping my whole team really busy. Not to mention all of these migrations that are going on, that we need to spend time on.
A: Tell me about it! I just don’t have the time to spend reading a doc like that. Can you just tell me the high points, so I can get the most out of it without reading the whole thing?
B: Well, the thing is, I’m pretty sure you’d learn different things from the write-up than I would. I’m sure there’s stuff in here that you already know, that I didn’t. And also, vice versa.
A: Hmmmm…
B: And even if I try to recount what I learned… well, it’s not the same as reading it. I’m not good at articulating what I learned. Just giving you a list of bullet points is not going to be as effective at just going through and reading the whole thing. And, from experience reading lists of “learnings” don’t stick in my head the way the same way as the stuff I learn reading a well-written incident write-up like this one.
A: I see what you’re saying, I really do. I’d like to be able to sit down and spend the time really reading through this whole document. But, given all of the current obligations that business has placed on me, I don’t have that time to invest. I want to learn from this incident, and I know I would learn more if I spent the time on reading the whole thing, but there’s a limit to how much time I can commit to that. So I need to have the important details summarized.
B: Just to make sure I understand: you’re saying that, even though you admit you’d learn more if you read the entire write-up, because of the various work pressures that you are facing, you’re making an explicit trade-off to reduce the amount of time you spend on this task, in order to have the time to spend on other tasks you have to work on?
On July 8, 2026, the Australian telecom company Telstra experienced a significant outage related to an NTP issue. Telstra hired a consulting firm to do an incident review, and a couple of weeks ago, that firm released a public report: Findings Report on the July 8th Telstra Outage.
I’m using this blog post to write up my understanding of the failure mode. I found the report was often missing important details that I needed to make sense of what happened, so I tried to fill the gaps by looking at additional sources, and made my best guesses where I could. It was also more difficult for me because I don’t have domain expertise in any of the technologies involved here: I have some basic familiarity with NTP, and I have no familiarity at all with the various mobile telecom technologies involved.
Note: all block quotes in this post are from the public report unless explicitly indicated otherwise.
2010-2020 Telstra NTP system architecture
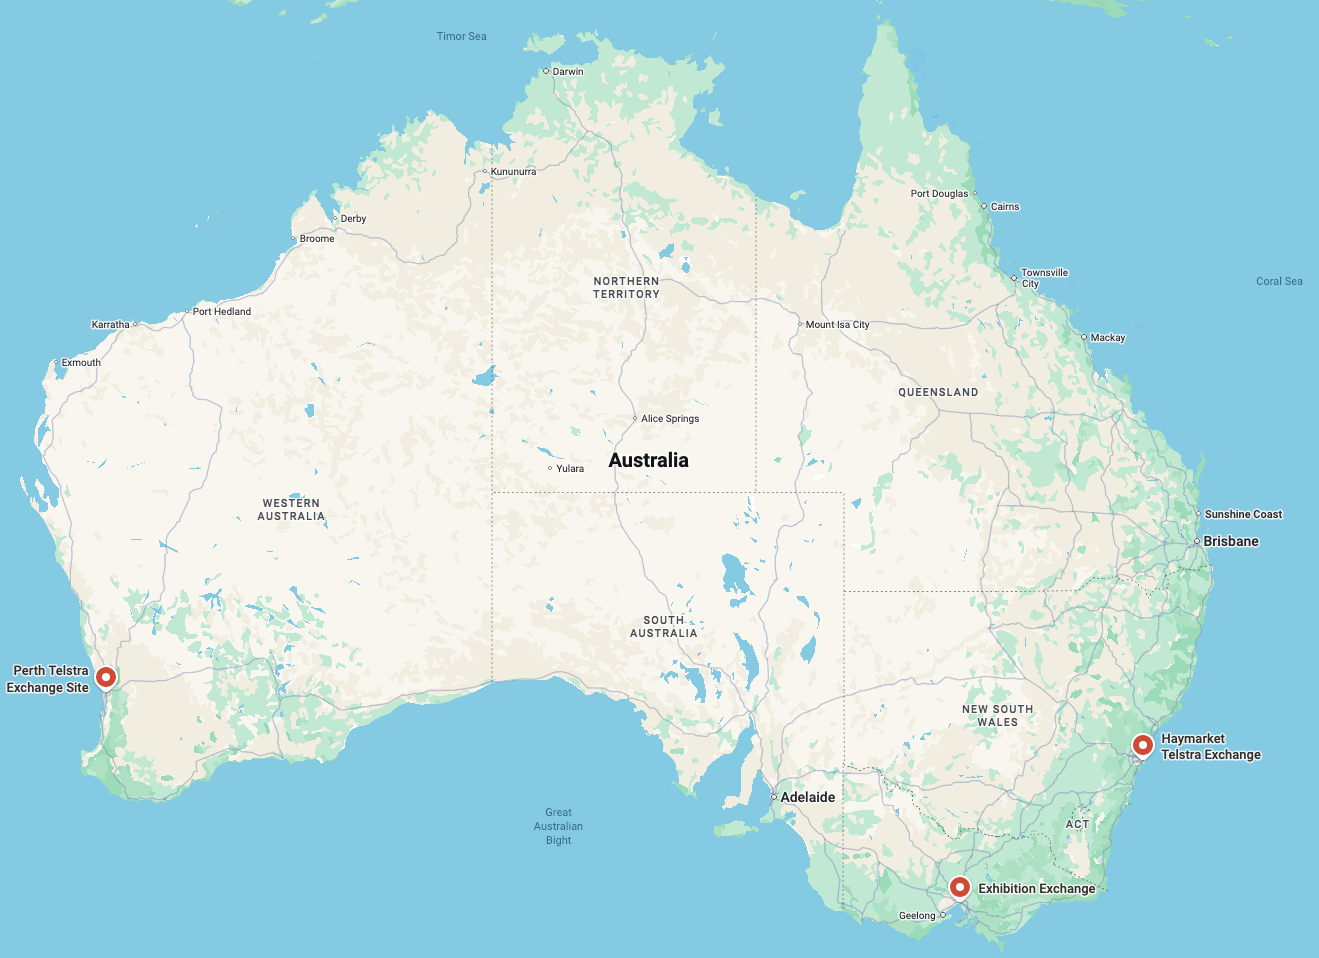
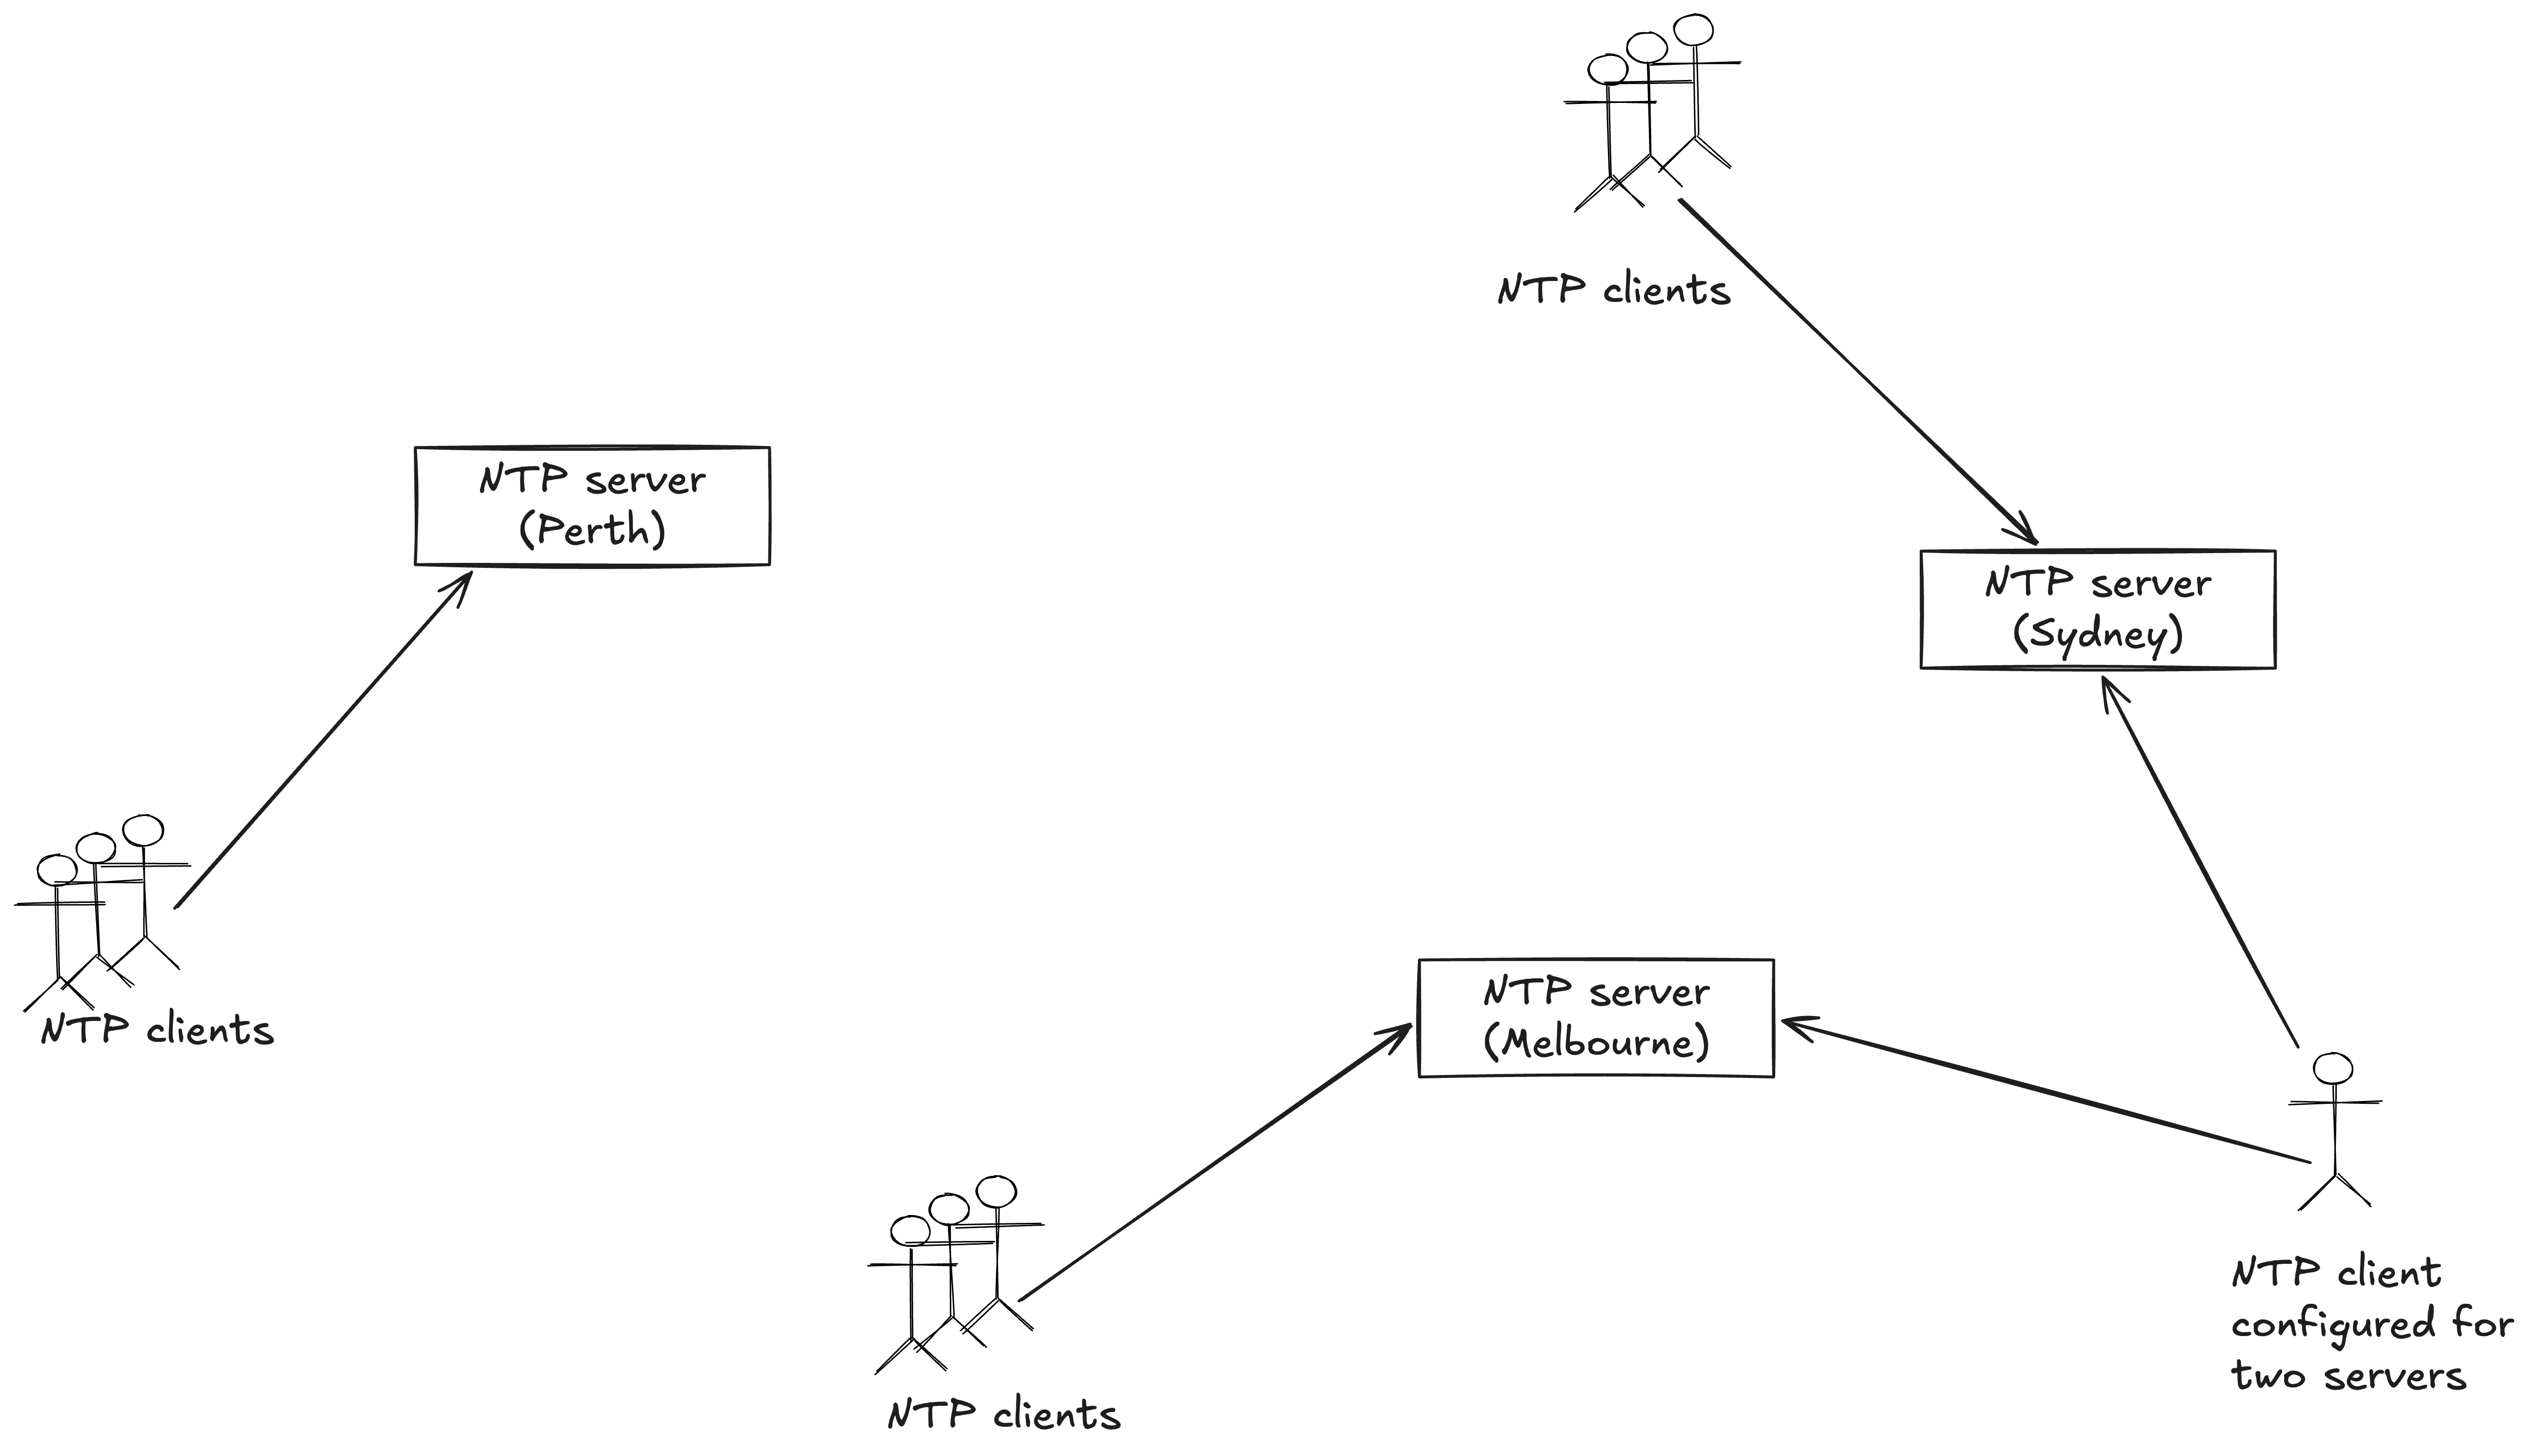
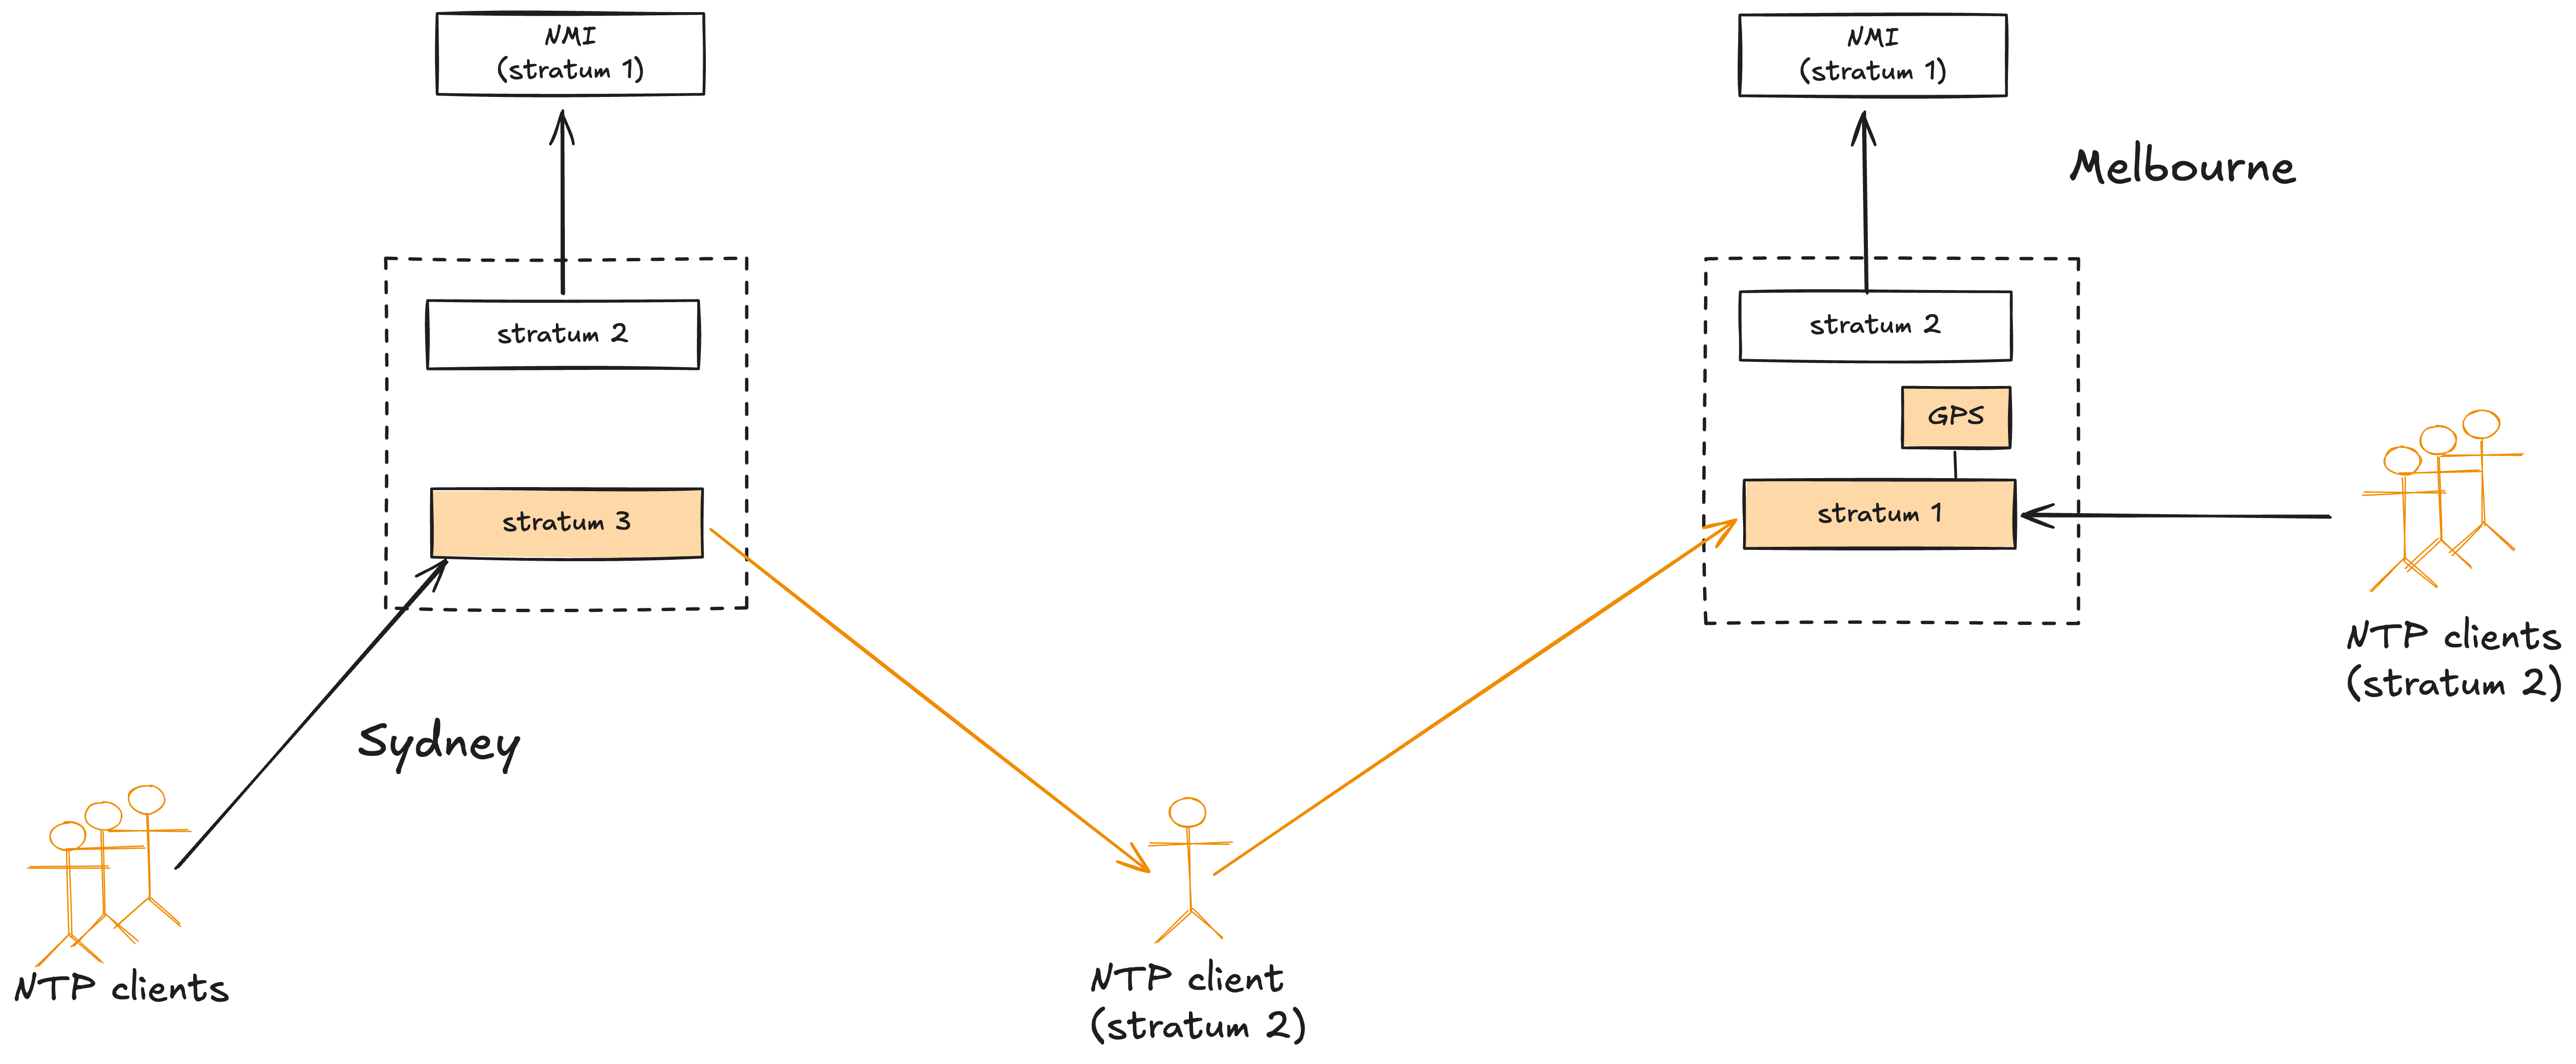
Telstra runs three NTP servers in their mobile network, geographically distributed at telecom exchanges across Australia.
Telstra NTP servers run at exchanges in Sydney, Melbourne, and Perth
These servers provide time synchronization to their clients, which could potentially be other NTP servers.
A diagram that shows NTP clients, including a client that talks to two of the servers
Note that some NTP clients are configured to point to multiple servers for redundancy. The diagram above shows one such client. Clients connected to multiple NTP servers will play an important role later in the incident.
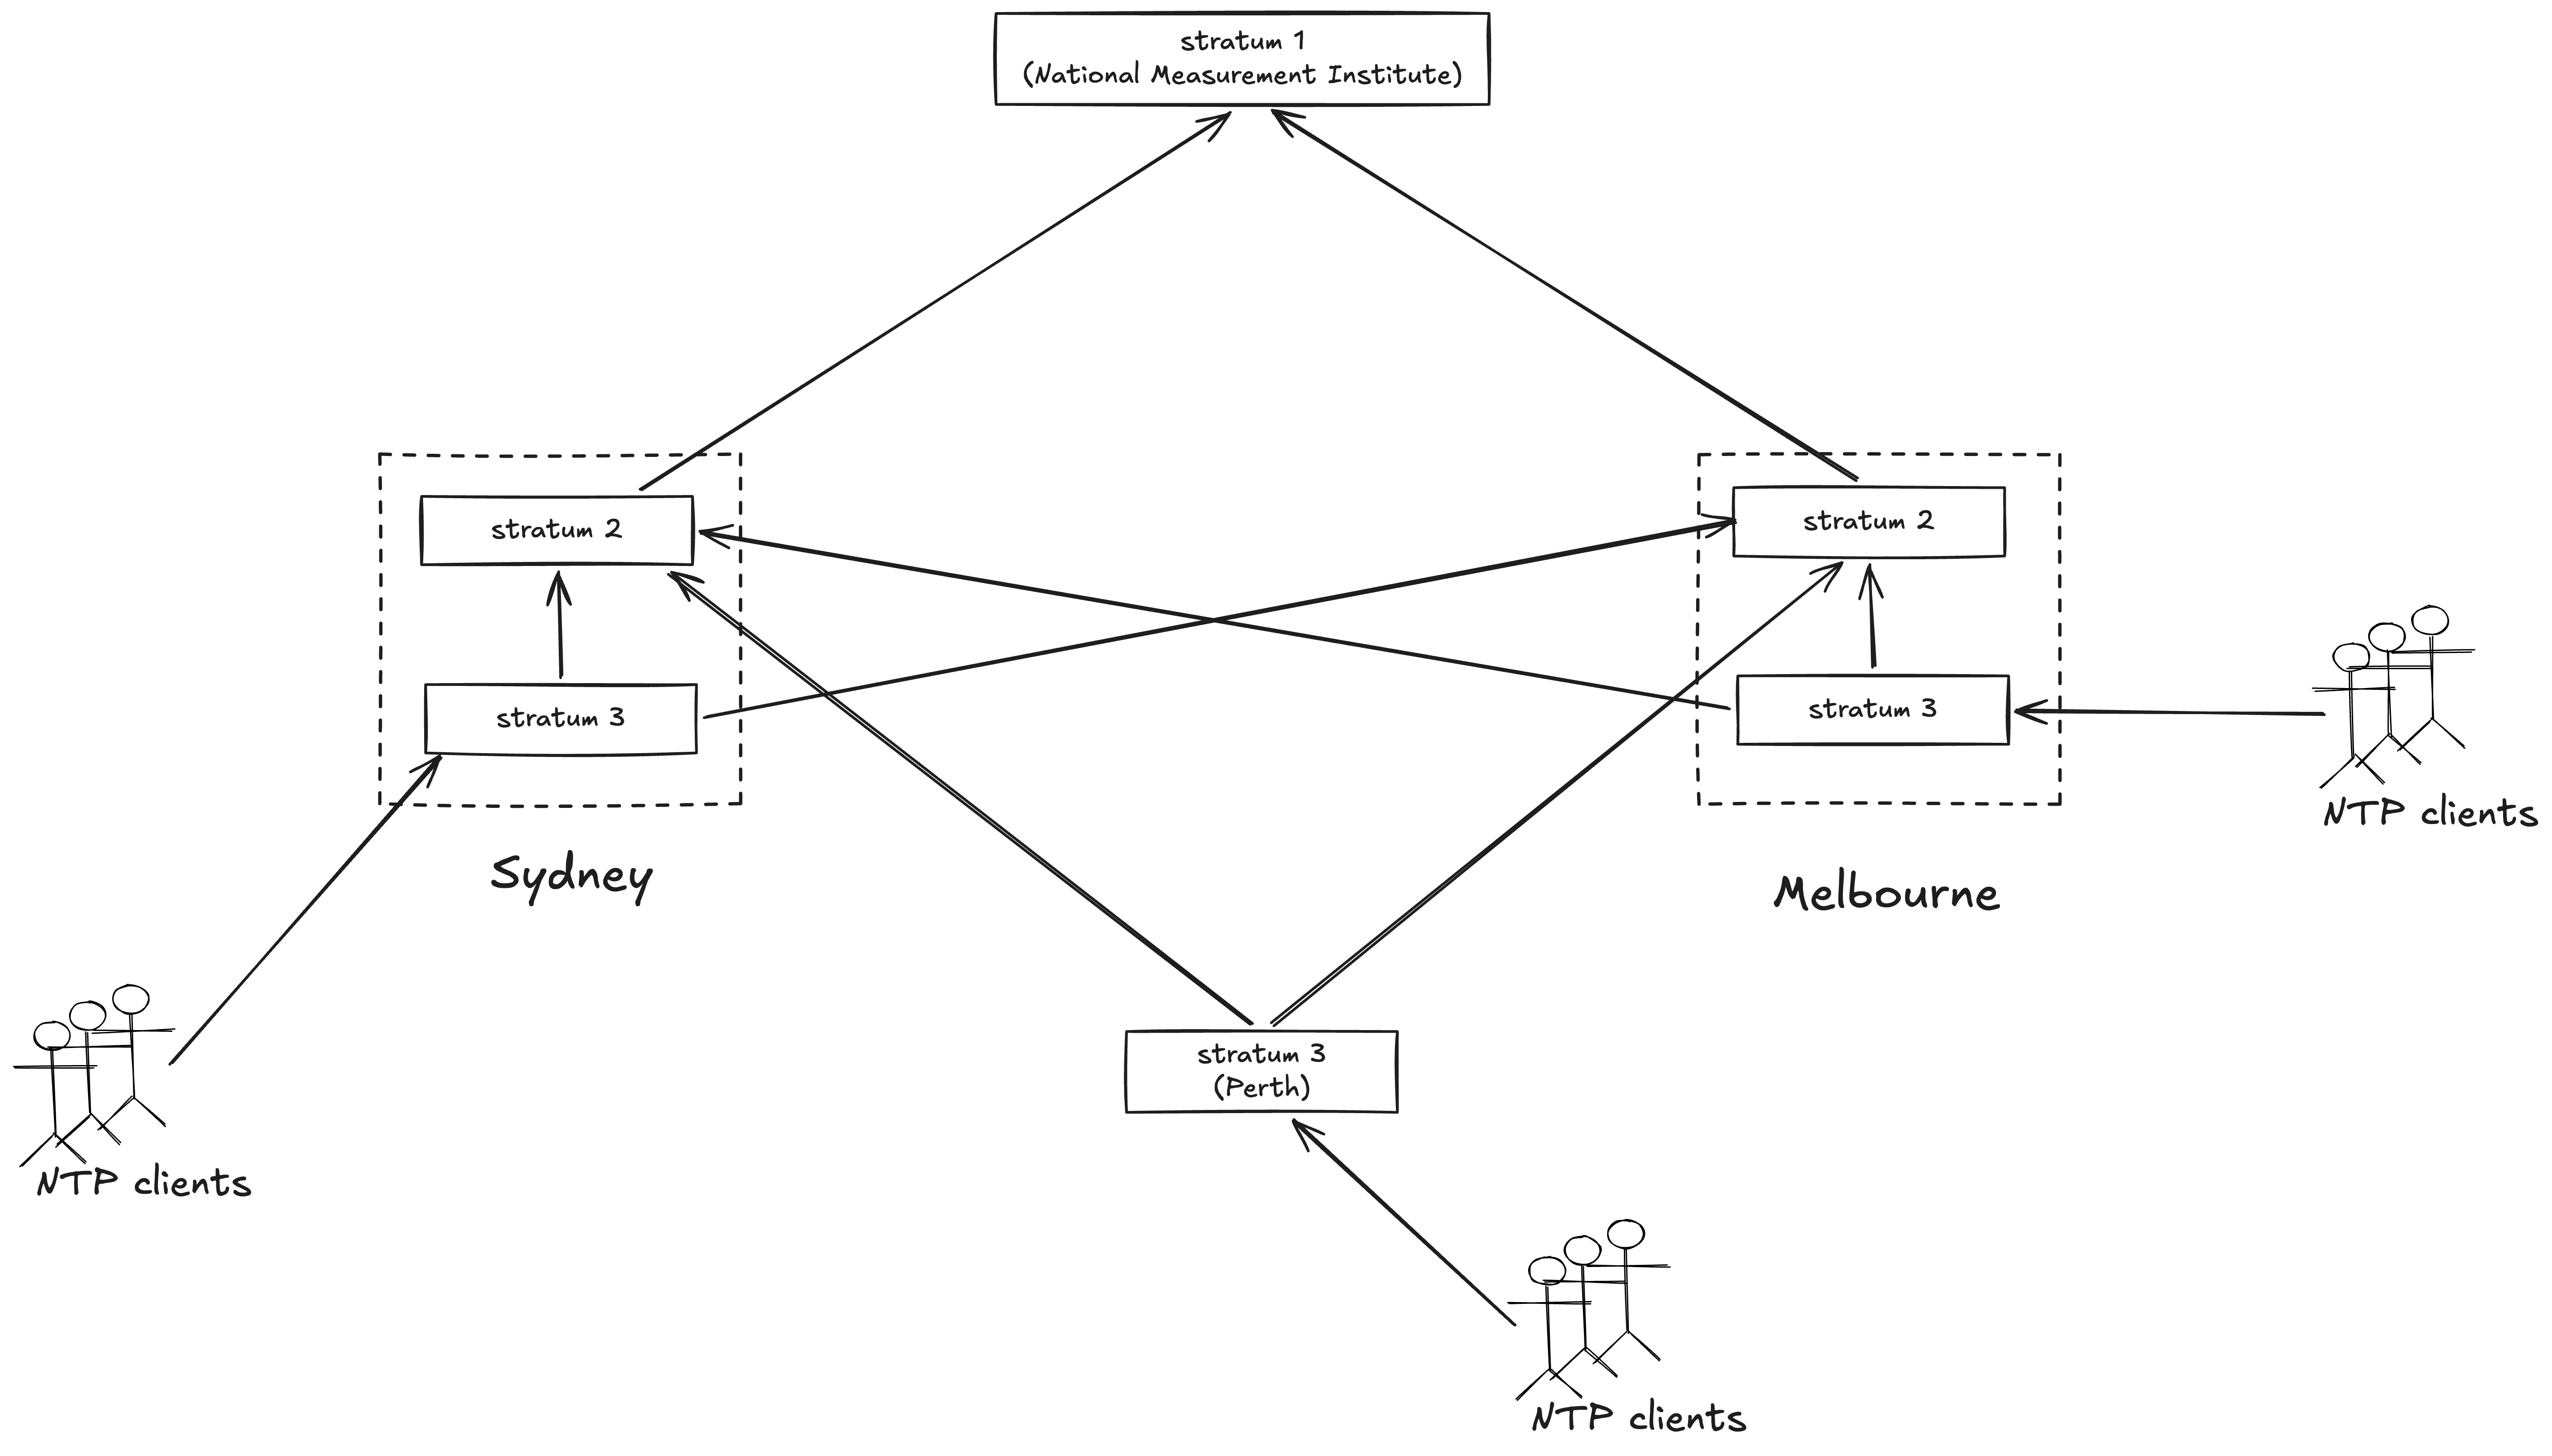
According to the report, starting in 2010, Telstra ran two NTP servers at the Sydney and Melbourne exchanges. At each site, one server ran at stratum 2, and the other ran at stratum 3. The Perth exchange ran a single NTP server, at stratum 3. For their stratum 1 sources, the stratum 2 servers were clients of NTP servers hosted at Australia’s National Measurement Institute. It is the Melbourne site that will play the most significant role in this incident.
Telstra system diagram, circa 2010
A note about arrows: NTP diagrams typically show arrows going from lower stratus to higher stratus (e.g., “stratum 1 →stratum 2″). However, I’ve drawn the arrows the other way because I’m used to the “client → server” convention of arrows directions.
I’m assuming that the NTP clients communicated only with the stratum 3 server, but there isn’t enough detail in the report to verify this was the case. I really wish they had drawn diagrams in the report!
For the purposes of this incident, the important detail here is that each stratum 3 server has a redundant stratum 2 source: all of the stratum 3 servers can use either the Sydney or Melbourne stratum 2 servers.
An upgrade leads to an old redundancy being lost, and two new redundancies added: all three changes will contribute to the incident
Six years before impact
In 2020, Telstra upgrades the timing hardware on their mobile network. With this upgrade, their NTP servers now run on Microchip SSU 2000 synchronization supply units, with the supporting vendor being a local company: Scientific Devices. This upgrade results in three significant changes to the architecture.
No more local NTP sources
Due to a limitation in the NTP timing chassis, a stratum 2 NTP server could not provide time to a stratum 3 NTP server in the same chassis. – Findings Report on the July 8th Telstra Outage
With this upgrade, they are no longer able to have a stratum 3 NTP server running on the SSU 2000 use another NTP server on the same unit as its source. As a consequence, the Melbourne and Sydney stratum 3 NTP servers lose a level of redundancy: they now each have only one stratum 2 source.
The new architecture eliminates the redundant local connections in Sydney and Melbourne
Unfortunately, the writeup doesn’t explain why the limitation existed. I tried to figure this out by reading what SSU-2000 docs I could find. My best guess was that this was a security restriction, as described below (emphasis mine). For context: the PackeTime module is the thing that runs NTP on the SSU 2000, and NTP runs on the service port. “Independent mode” means that the two Ethernet ports of the module run independently (i.e., bonded), which I presume is how they had things set up so they could run two independent NTP servers.
In the Independent mode, the two ports are each assigned unique IP addresses and can each serve time to independent networks. From a security perspective, the important thing to note about the Independent mode is that the PackeTime Module does not support routing protocols between the two service ports or between the service ports and the maintenance port. This prevents a malicious attack on Port A (network A) to be used to send a malicious attack via Port B (network B) or vice-versa, or between Port A or B networks and the maintenance port’s network. – SSU-2000 Synchronization Supply Unit and the SDU-2000 Synchronization Distribution Unit: User Guide, Revision G – June 2008, Chapter 8, Output Module Reference Data, PackeTime Module, p274
GPS card for failover
However, while the upgrade cost them one form of redundancy, it granted them another form: each SSU 2000 unit had a GPS card in it. GPS gives you access to a high-accuracy clock, since it receives time information from multiple satellites which each have atomic clocks in them. The presence of a GPS card gave the NTP servers running inside of the SSU 2000 access to a stratum 0 source. The GPS card was therefore available as a failover time source if the stratum 3 NTP servers lost access to their (now sole) stratum 2 source.
But there is a problem lurking within this failover solution: a GPS rollover bug in the card.
An announcement I found online about the GPS rollover issue for SSU 2000
Internally, GPS keeps track of the number of weeks since January 5, 1980, and it uses 10 bits to represent this count. This means that the count rolls over every 1024 weeks (roughly every 19.7 years). Some GPS devices were not originally designed to handle the rollover. The GPS card in the SSU 2000 is one of those devices. (One thing I learned here is that while the GPS rollover itself happened on April 6, 2019, devices that are vulnerable to rollover don’t necessarily roll over on the same day. For the SSU 2000, the rollover was September 18, 2022).
This means that the GPS card’s date will jump backwards in time after it rolls over. The rollover date is September 18, 2022. But just hitting that date isn’t enough: as long as the card is still running, it will behave properly. It’s only when it is powered off and on after that date that the rollover will happen.
Running the symmetric variant of NTP
There is also one additional architectural change that happens in the upgrade.
In the client/server variant, a persistent client sends packet mode 4 packets to a server, which returns packet mode 3 packets. Servers provide synchronization to one or more clients, but do not accept synchronization from them…
In the symmetric variant, a peer operates as both a server and client. – RFC 5905
The mobile core timing architecture was changed from client/server to peering, meaning that the NTP server in the NTP timing chassis could acquire any NTP source that it could find and select to use any of these sources that was providing the most stable and accurate time. This introduced uncertainty in the time sources being used in mobile core timing hierarchy. – Findings Report on the July 8th Telstra Outage
Here’s where I struggle the most with the writeup, because I’m not familiar enough with the underlying technology. RFC 5905, which describes NTP, does not use the term “peering” anywhere, but it does talk about multiple variants of the protocol, including the client/server variant and the symmetric variant. I assume peering in the report is referring to the symmetric variant.
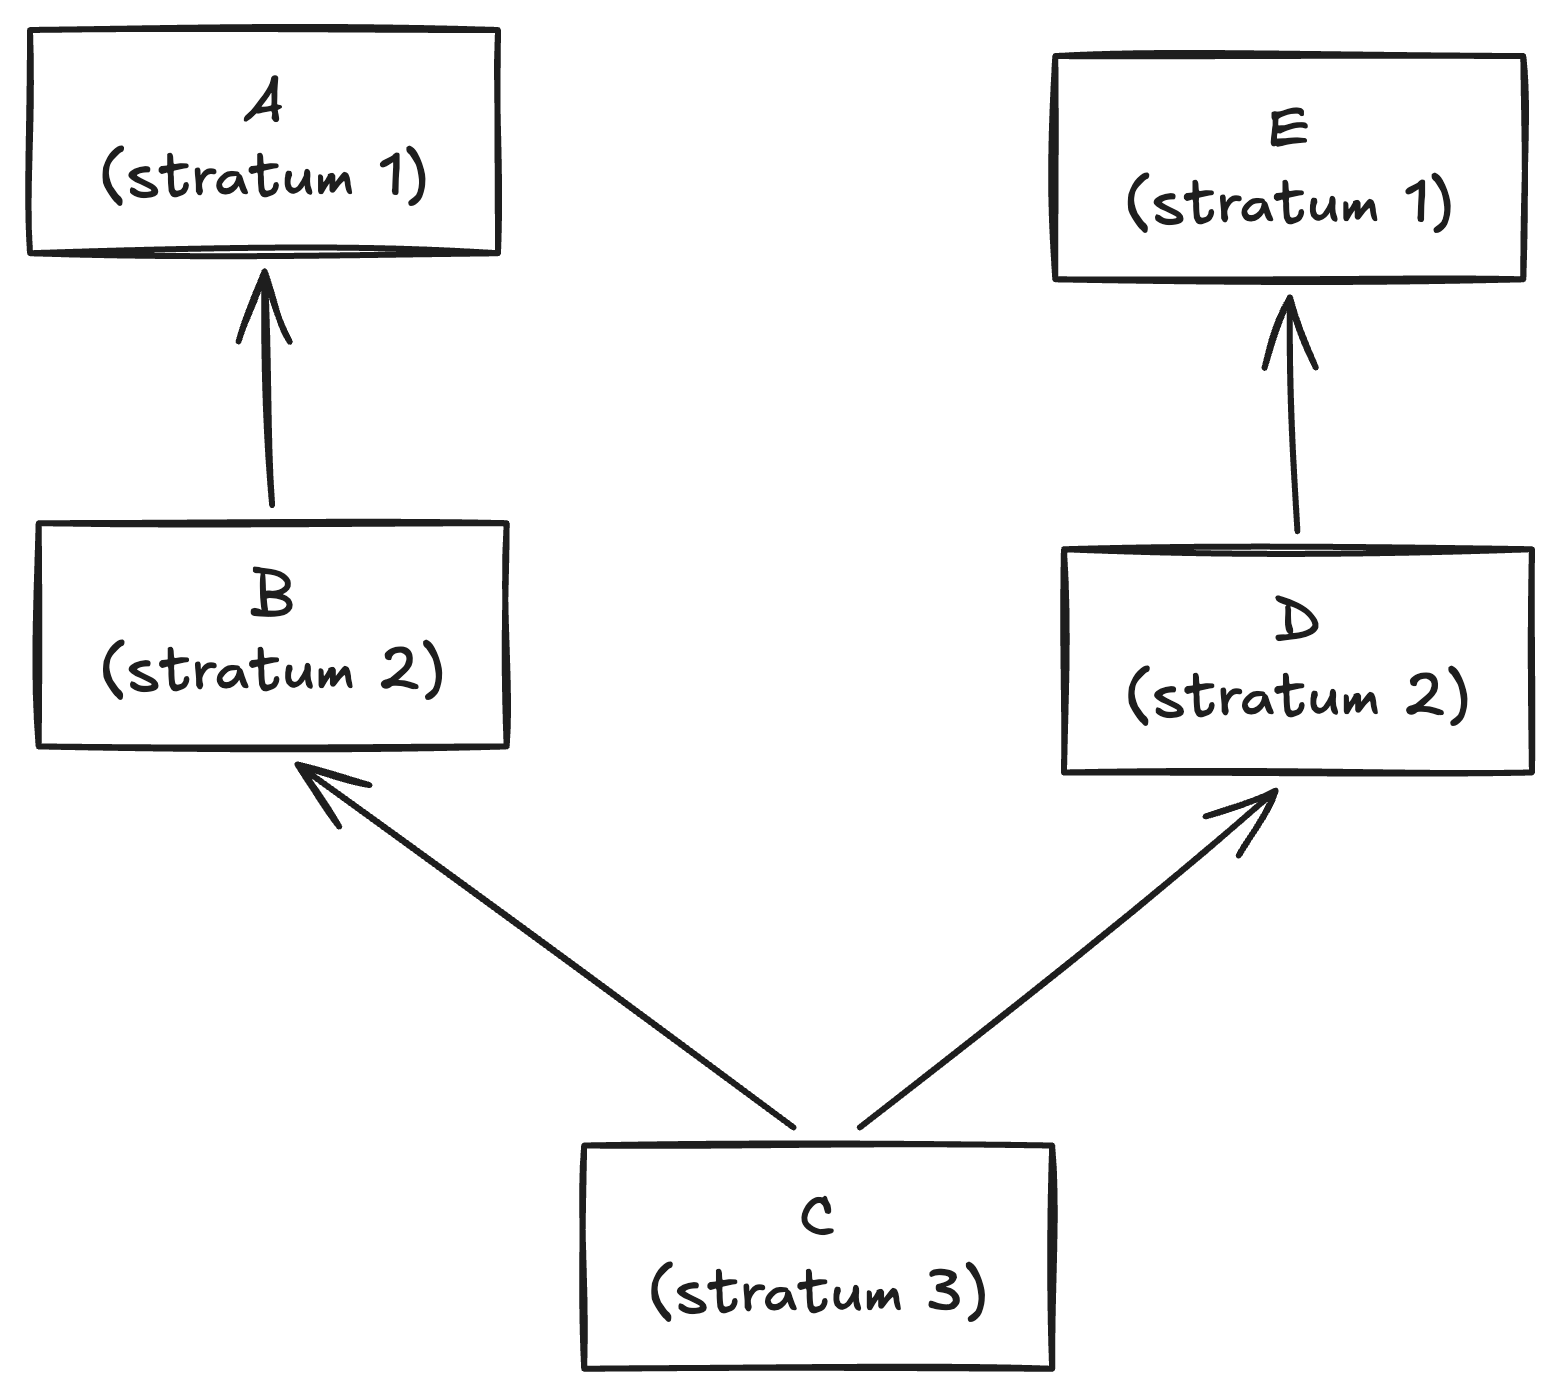
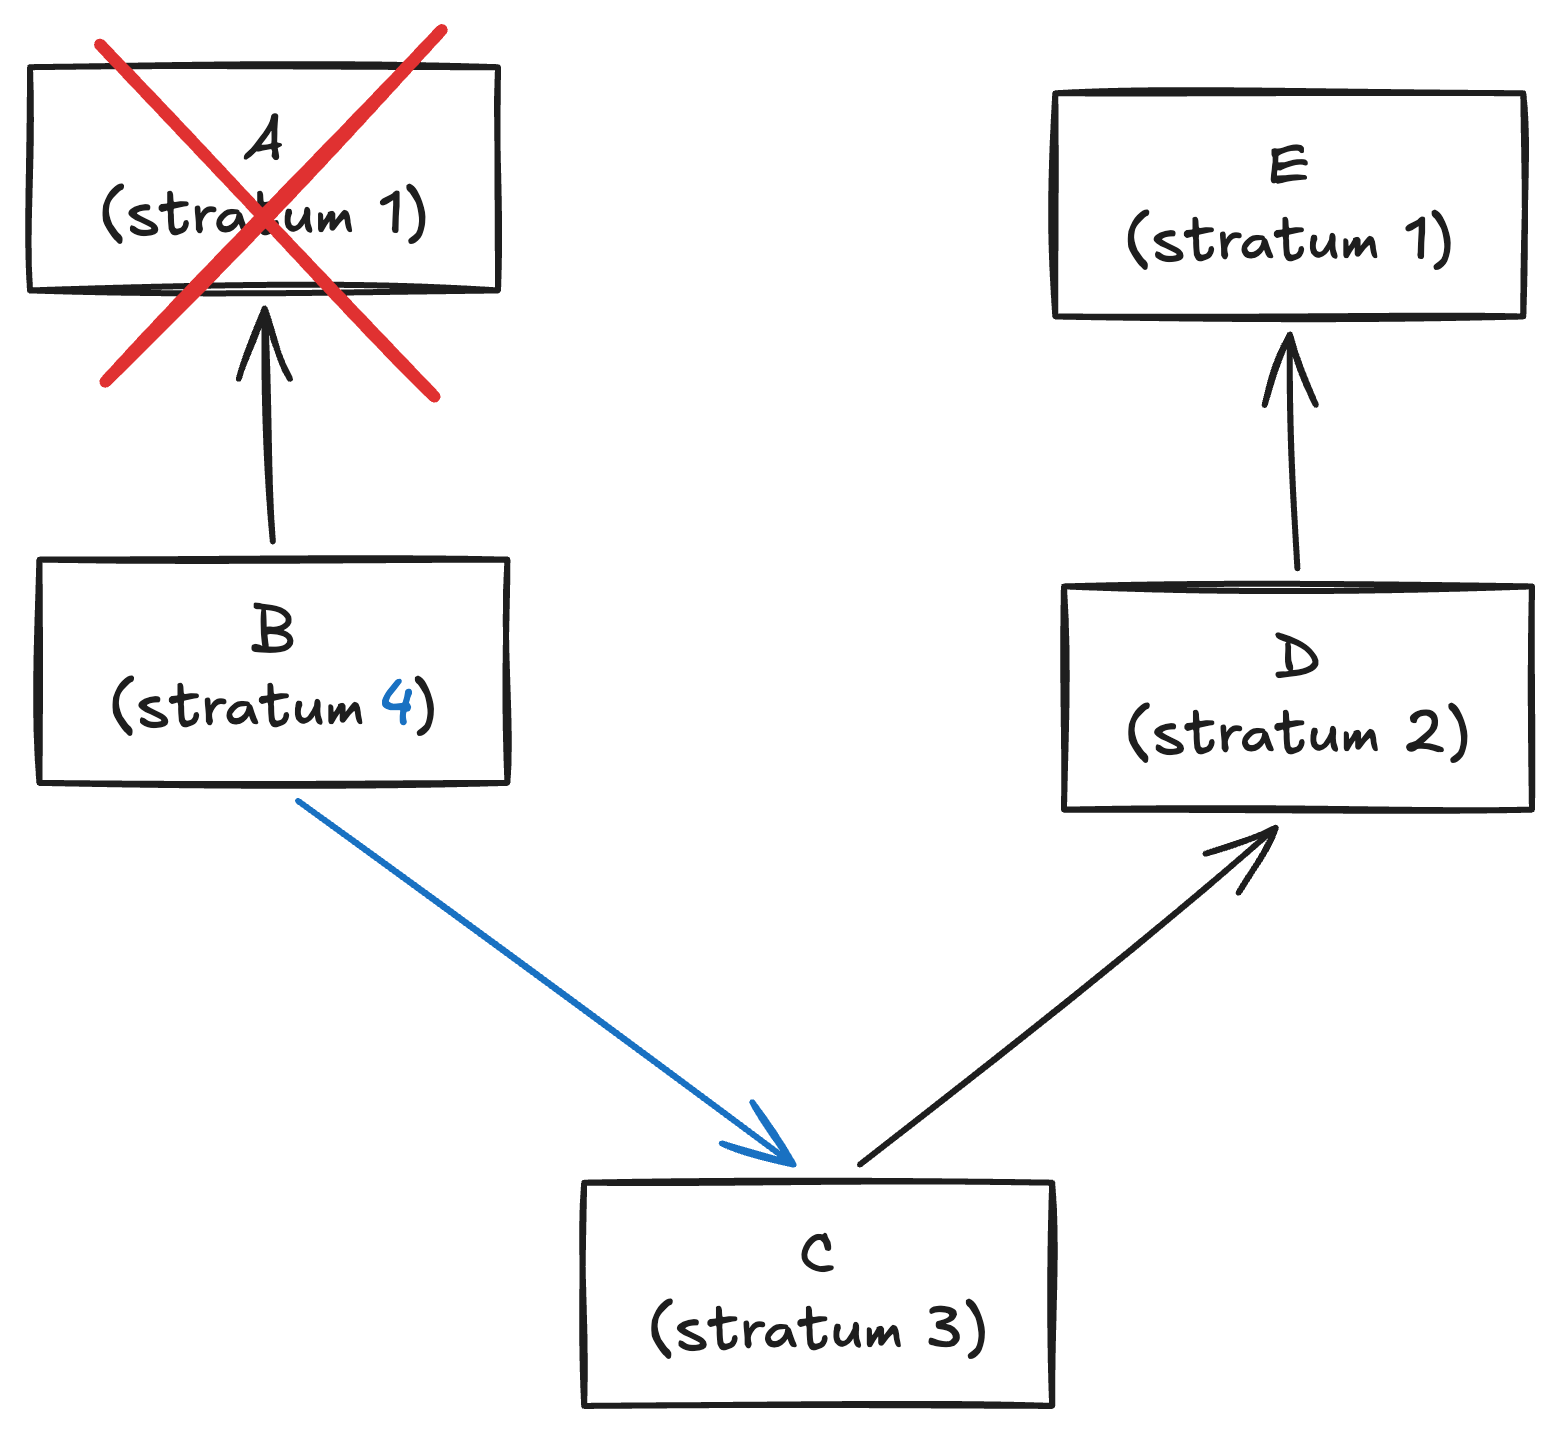
Here’s an example of behavior which I believe can only happen with the symmetric variant. Consider the following network of five NTP servers, labeled A-E.
Example of a configuration of NTP servers
Now, assume that server A goes down. This means that node B no longer has a source. When running in client/server mode, C is a client of B, which means that B cannot be a client of C. However, when running symmetric mode, B can become a client of C, like this:
B uses C as its source after A goes down
This behavior will eventually contribute to increasing the severity of the incident by propagating bad time data further through the network. But we’re still six years away from that.
SSU 2000 GPS rollover day comes and goes with no issues
Four years before impact
On September 18, 2022, the rollover day for the SSU 2000, nothing happens. Because the GPS cards have been running uninterrupted, they do not roll over: that only happens after being reset. In addition, the cards are not even in use, since they are only used for failover, and failover has not occurred. The problem will only manifest when the GPU card is restarted, which will not happen for years.
Melbourne NTP server cannot reach Sydney, engineers fail over to GPS card
Nine months before impact
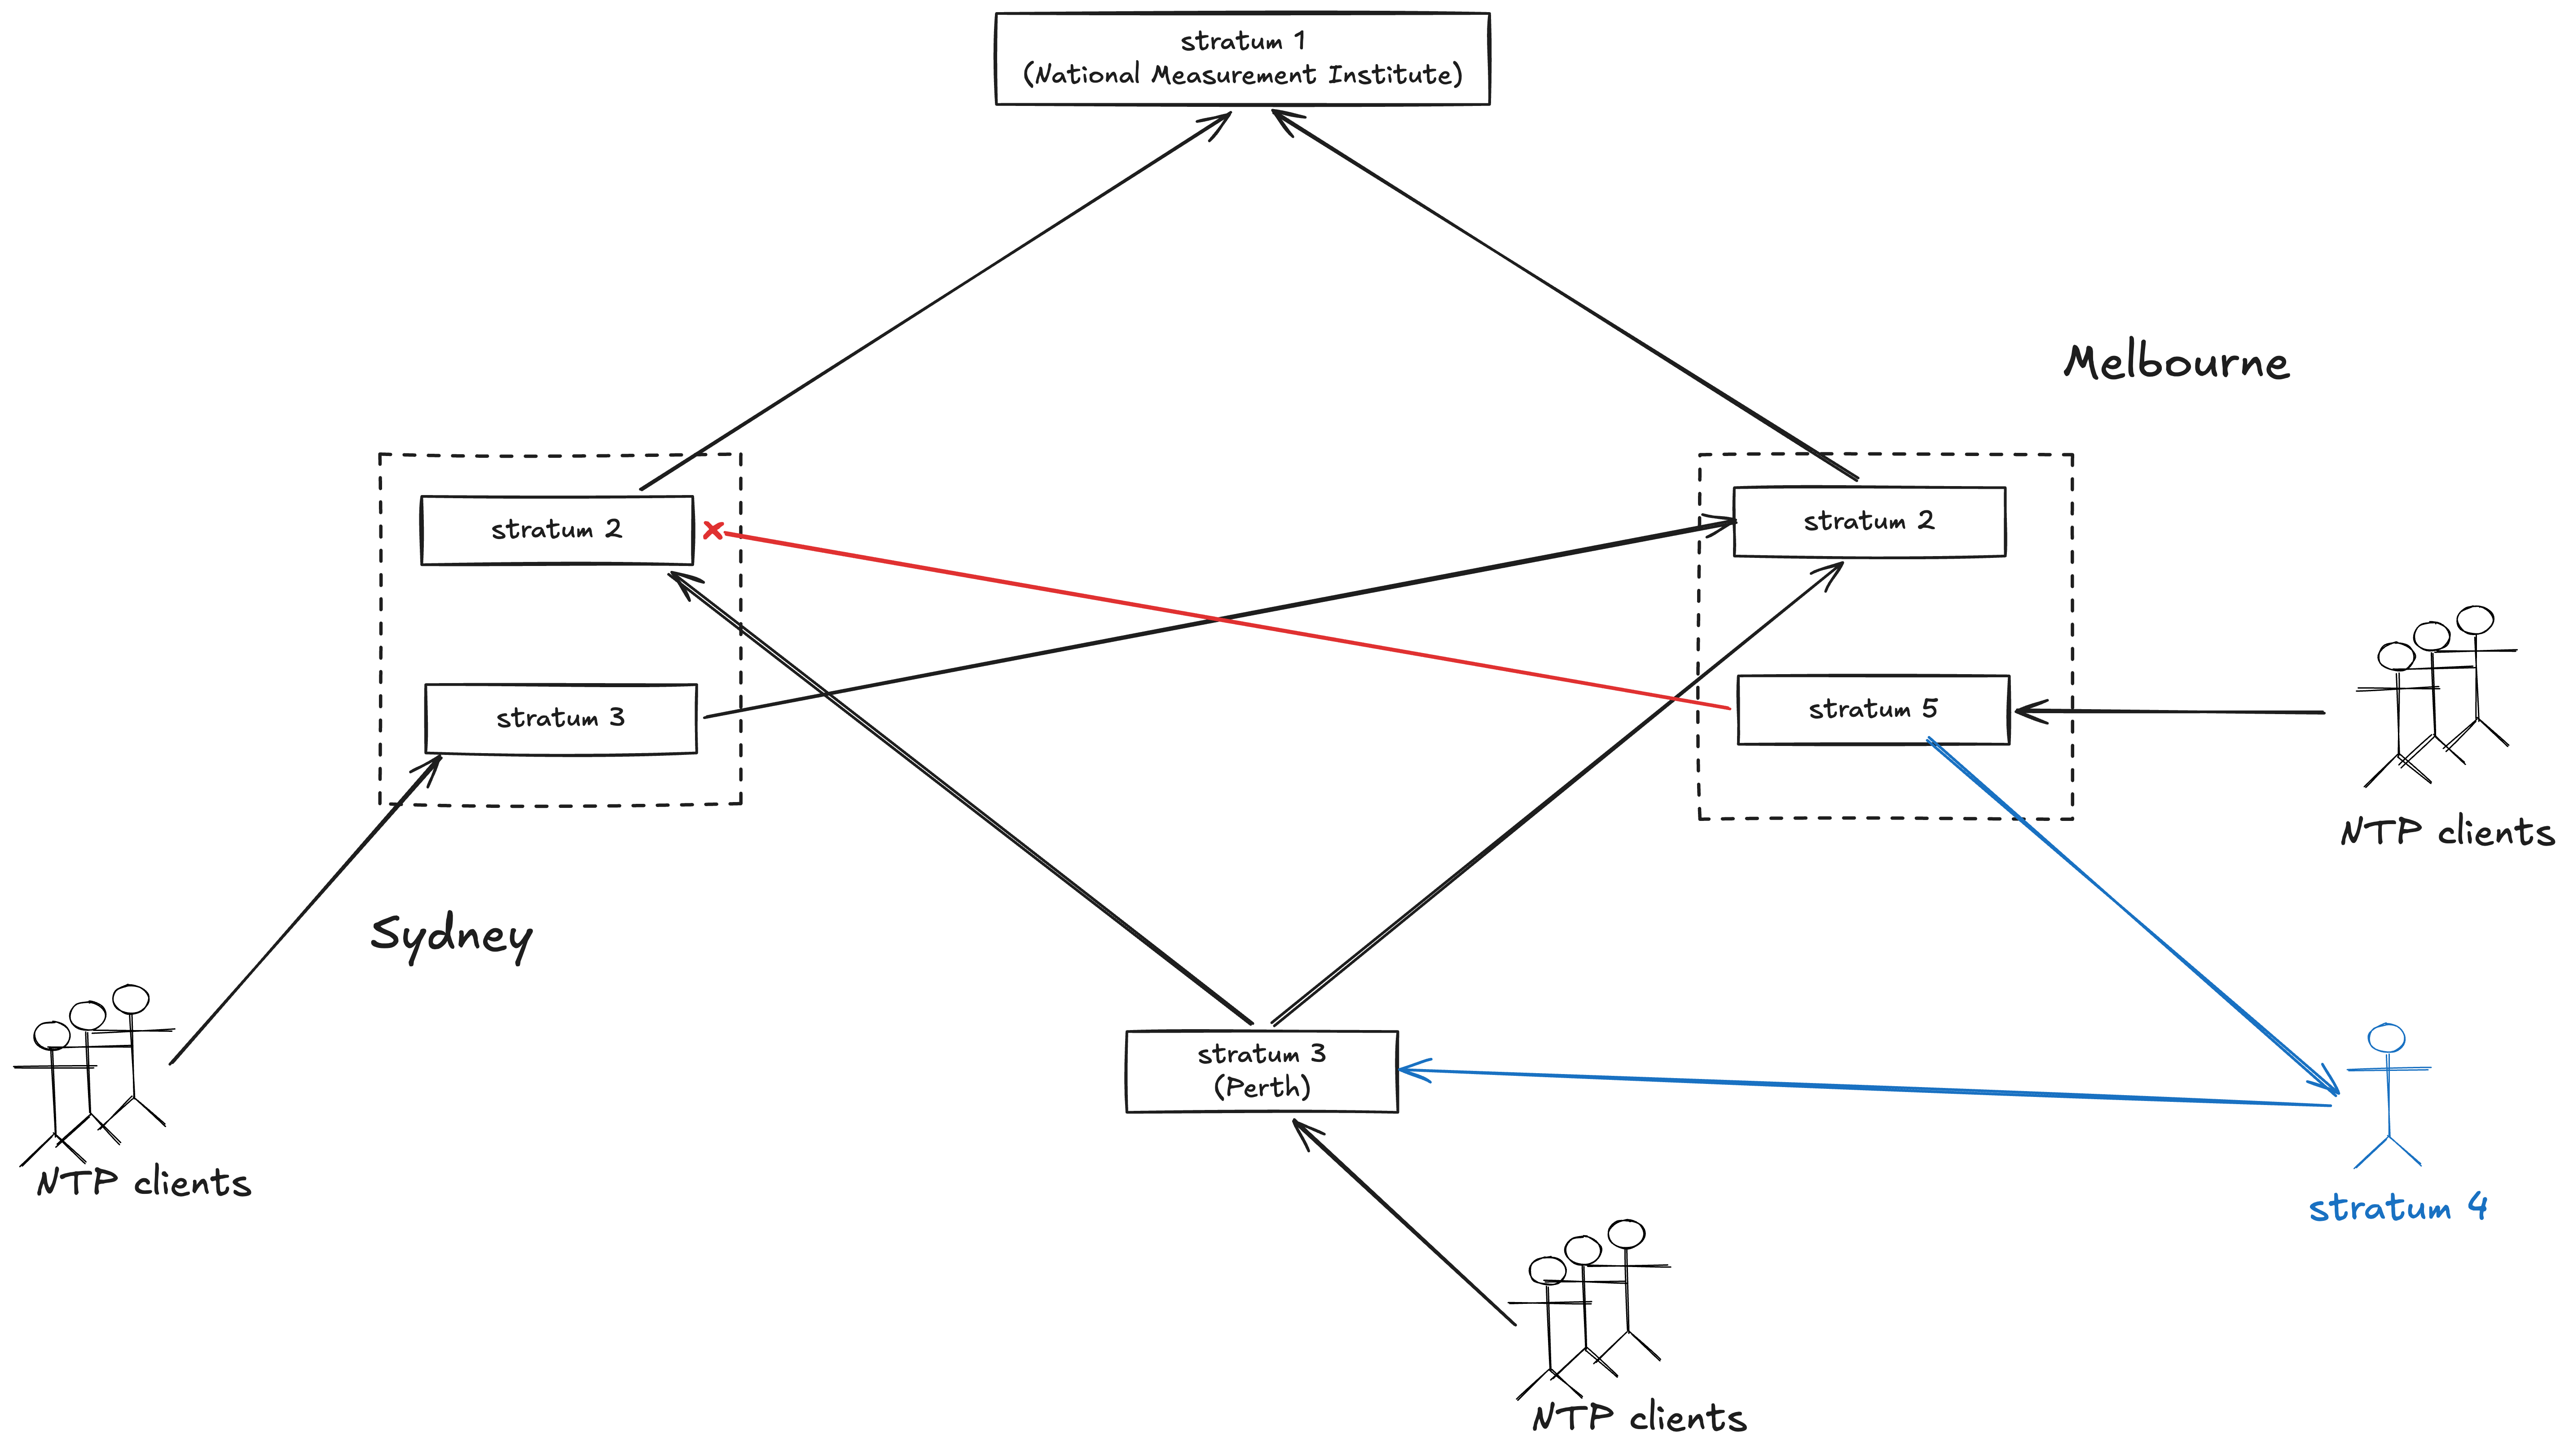
Several months before the outage, there’s a minor incident where the stratum 3 NTP server in the Melbourne exchange has been experiencing errors attempting to connect to its stratum 2 source in the Sydney exchange:
In October 2025, personnel were working on the Melbourne NTP server due to an incident report that the NTP stratum 3 clock was losing connectivity multiple times per day to its stratum 2 source clock at Sydney, resulting in NTP alarms.
The report notes that the server used peering to dynamically identify another NTP server, which happened to be a stratum 4 source, leading the Melbourne NTP server to become a stratum 5 source. However, they don’t know anything about this server:
The incident report also noted that the Melbourne NTP had become a stratum 5 source meaning that it was receiving time from a stratum 4 source in the mobile core timing architecture. Remember, Melbourne had only one stratum 2 source and when that source was lost, it used peering to find another source which happened to be a stratum 4 client of Sydney or Perth.
According to the report authors, this meant that timing loops were already present in the system (emphasis mine)
It is critical to have at least two independent reference sources. A timing loop is when sources that appear independent are in fact validating one another – directly, or by tracing back to a common reference. To avoid timing loops, you must clearly define the server hierarchy and document all relationships between servers.
…
looping was already occurring in mobile core timing when an intended NTP stratum 3 server was able to become a client of one (or more) of the clients and that a circular loop was established when the stratum 2 source was lost.
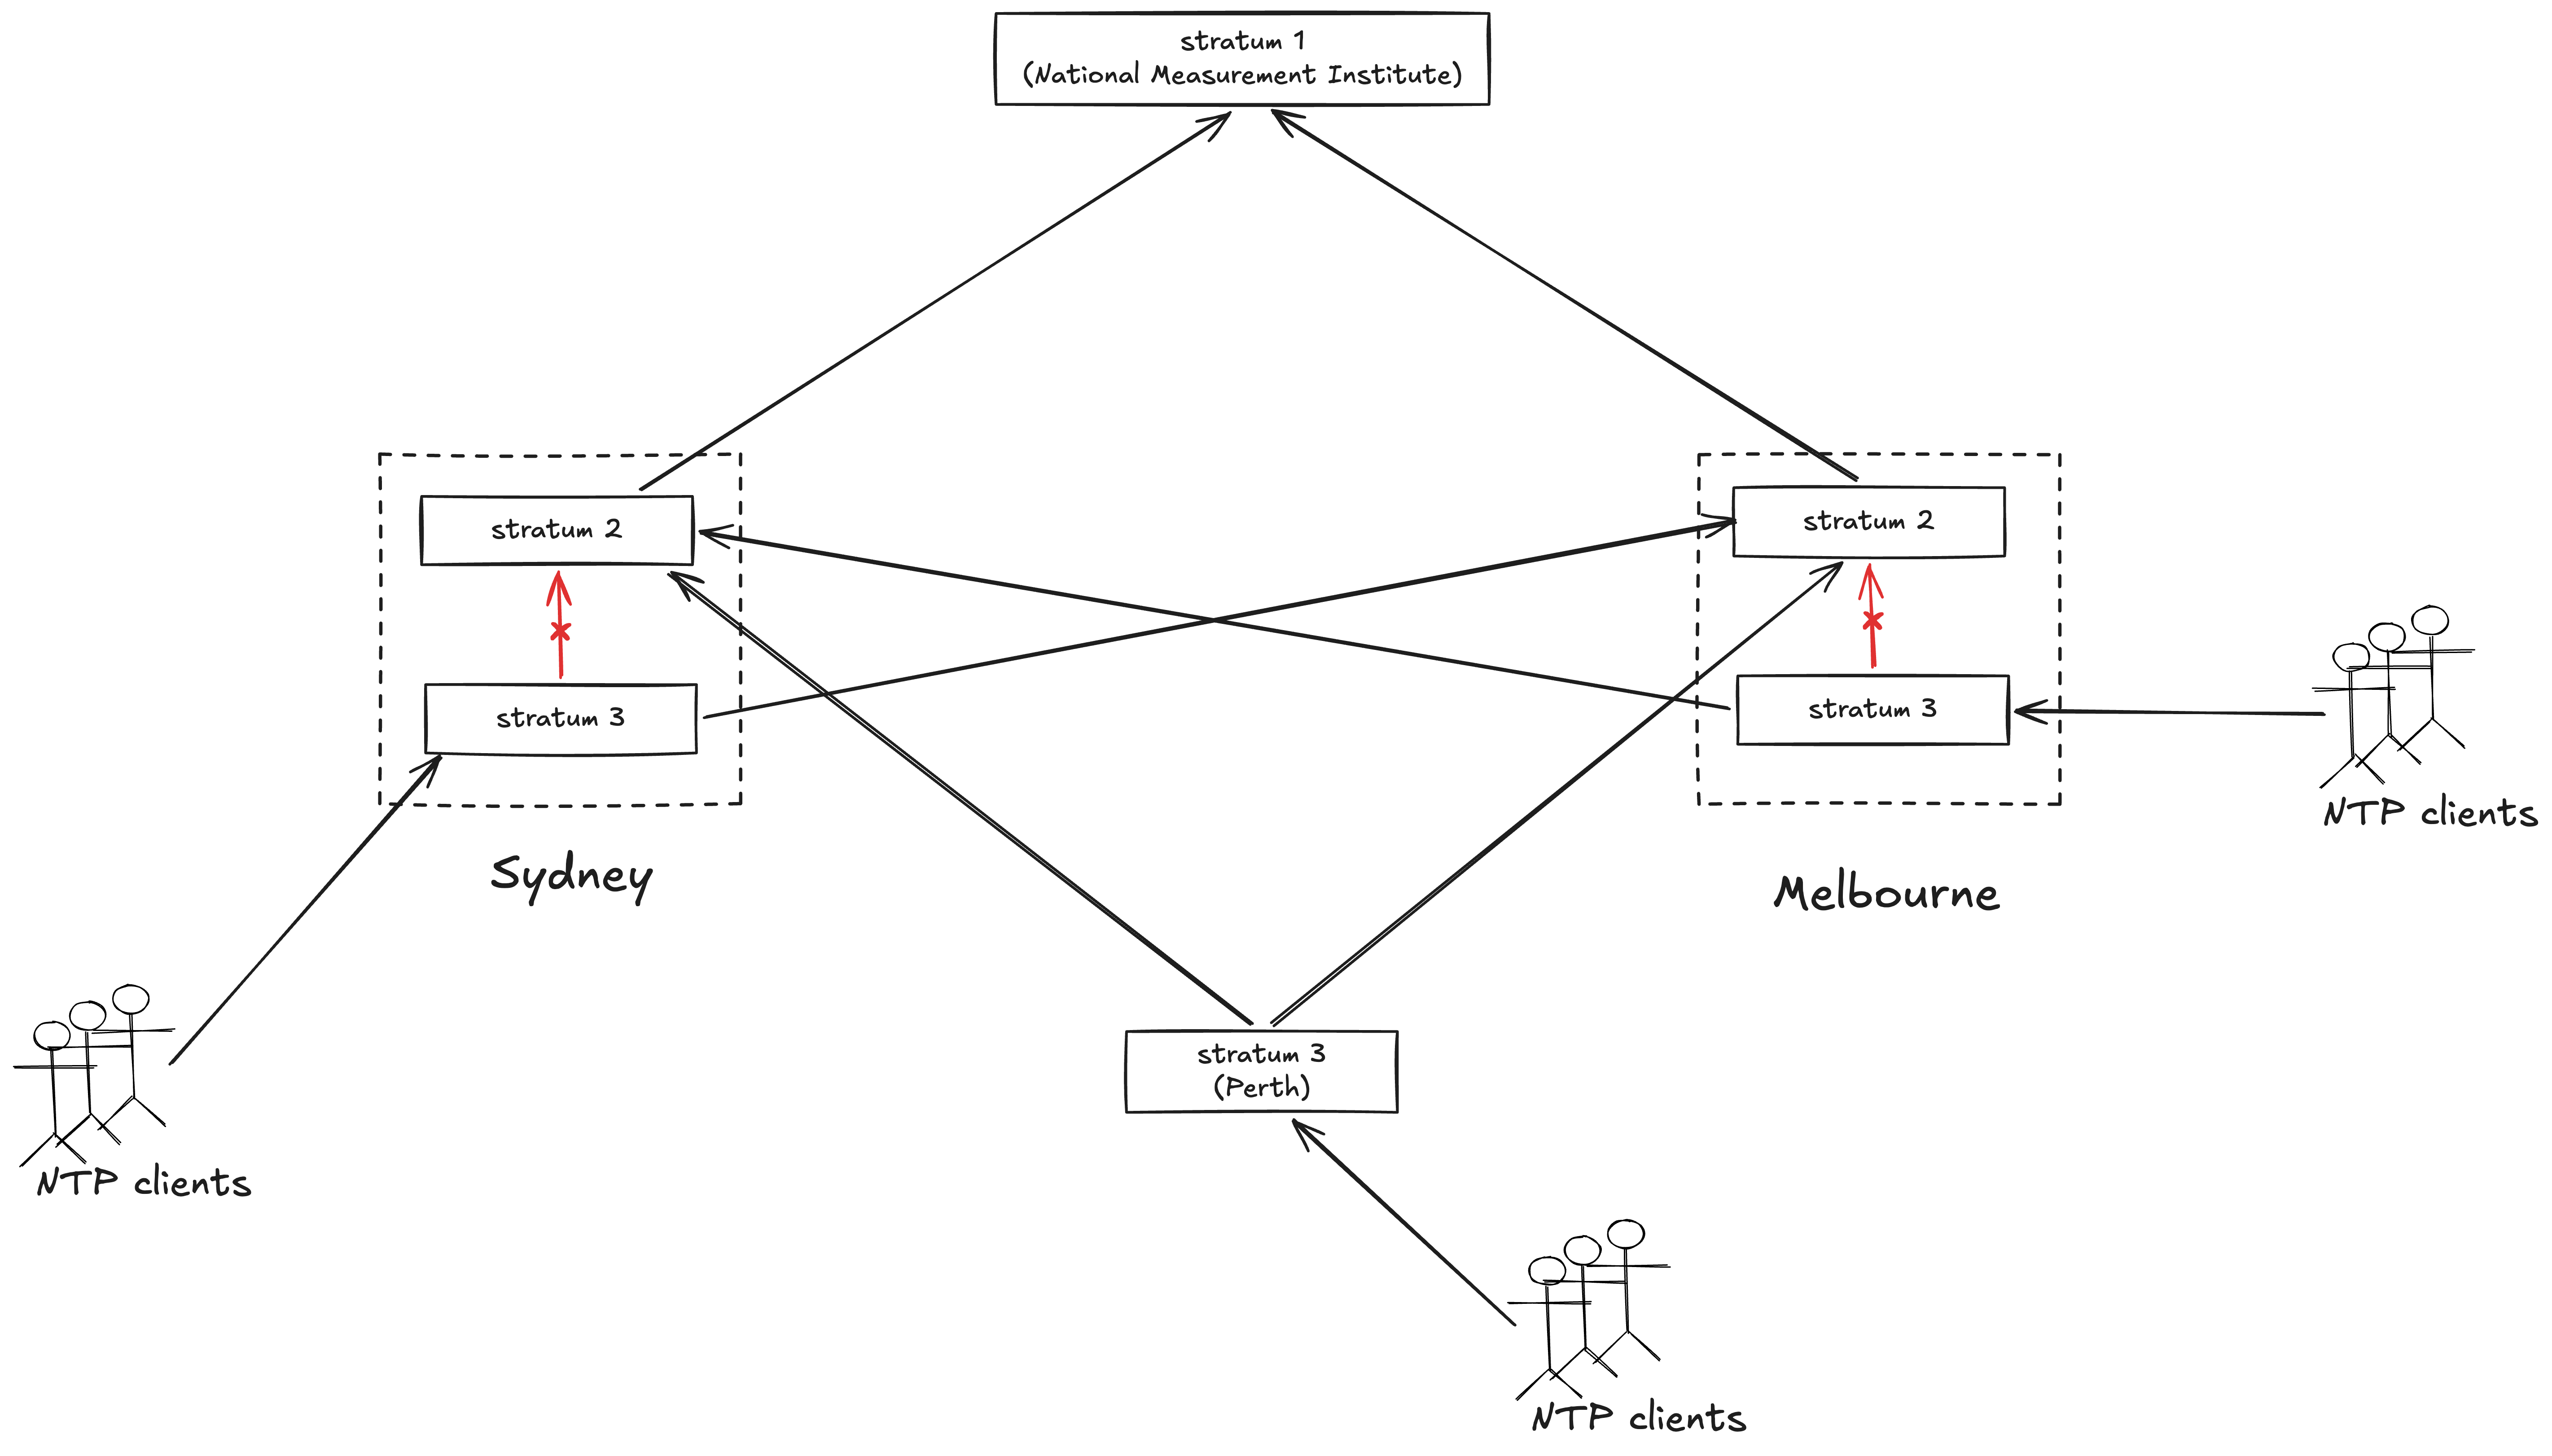
My understanding of the topology at the time of the October 2025 incident is captured in the following diagram, where the red arrow indicates a failed connection, and the blue arrows are network edges that were not in the previous diagram. Here I’m assuming the client in question was connected to the Perth stratum 3 server, but it may just as well have been the Sydney stratum 3 server.
A client of the Melbourne NTP server becomes its source after connection to Sydney fails
While this evidence indicates that looping was already happening in the network in October 2025, the looping itself had not yet contributed to an incident: that will come later.
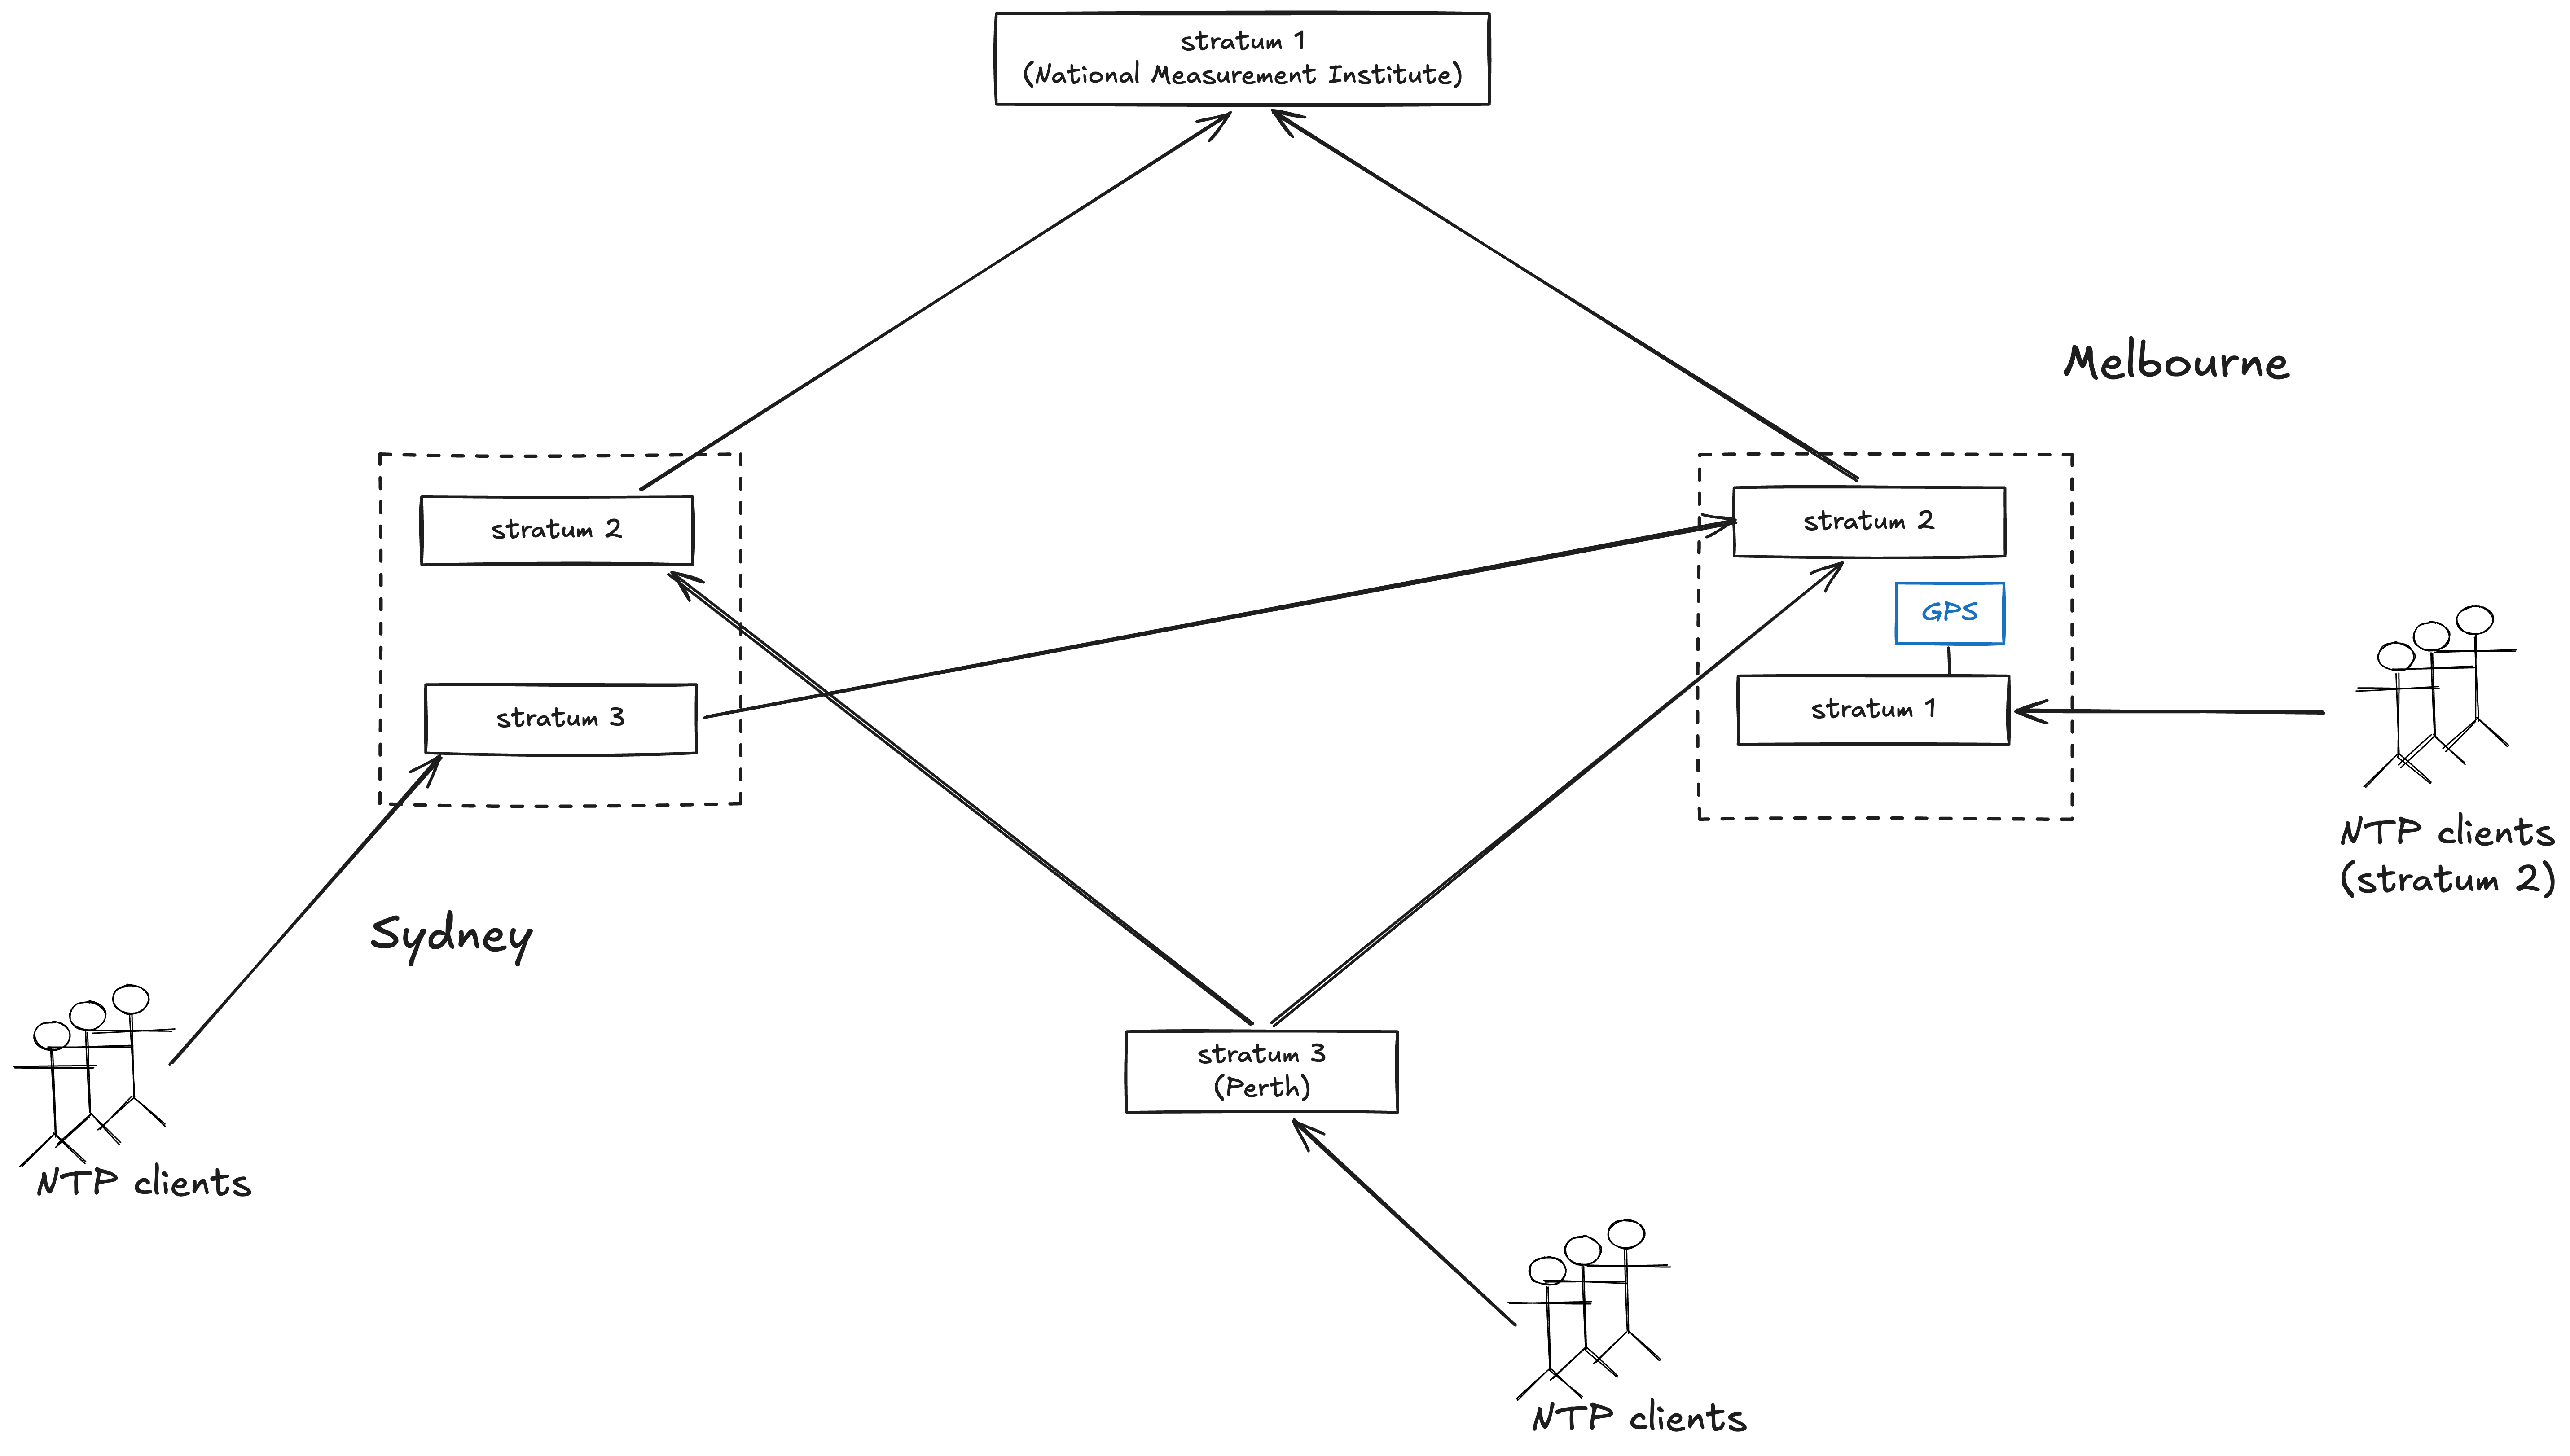
The network engineers mitigate the incident by failing over the Melbourne NTP server to use the GPS card as its source.
To resolve this issue the GPS card was activated and connected to the stratum 3 NTP server in Melbourne as a means of replacing the lost Sydney stratum 2 source. the incident appear to have chosen this approach as the best means to address the incident. The GPS card is known as a reference source (aka stratum 0) and so this connection made Melbourne a stratum 1 NTP source, effectively the same level as the NMI stratum 1 sources in the mobile core timing architecture. This impacted the clients of Melbourne, making them stratum 2. In peering mode, these stratum 2 clients can be time servers at the same priority as Sydney and Melbourne stratum 2 who were the intended stratum 2 sources.
Melbourne NTP server becomes stratum 1 after GPS failover, its clients become stratum 2
A reminder from the SSU 2000 vendor about the firmware update
Seven months before impact
In January 2026, the vendor supporting the SSU 2000, Scientific Devices, sends a reminder to Telstra that there is a firmware update for the SSU 2000 related to the GPS card.
Here I’ll quote the CEO’s Senate testimony (emphasis mine):
It’s still subject to our investigation, but there was definitely a reminder in January of this year that this update needed to be done. We believe it does go back several years that it was there. To provide some context, our investigation so far has shown that it’s not a case of the teams just ignoring that update. They did consider it. The way this was designed and the way we were using this particular server and this card, this update was affecting a feature that we were not using at that time. … We know that our teams did get the alert of a software update. As we said, they assessed that through our investigation, we can see, and made a choice. Again, this is not an excuse; it’s putting it in context. There are many software updates and changes getting made across the network. Any software update creates a risk, and we put it into testing. In this case, they thought, given the design that was in place, it was not relevant because we were not using this equipment in the way that would trigger this risk. – (Telstra CEO) Vicki Brady, Senate Environment and Communications References Committee
It sounds like the engineer who made the call was not aware that the GPS card was a failover source. So was the use of the GPS card an in-the-moment workaround using available resources, or was it an explicit part of the architecture that the engineer making the call about firmware updates was not aware of? Or was it something else? There simply isn’t enough information to tell. The public write-up implies that it was part of the architecture:
The architecture indicated that the GPS card was available to be used as an alternative failover source for time of day.
On the other hand, we have this Senate testimony from the Group Owner, End-to-End Service Performance and Resilience of Telstra
I don’t know how to reconcile those two statements, beyond “different people in the system had different understandings of the architecture”. If you think you can eliminate these sorts of mismatches in understanding in your organization, good luck to you!
One last thing I want to point out here is the CEO’s comment that “any software update creates a risk”. So, not doing updates is dangerous, but doing updates is dangerous as well! It’s easy to judge the engineer in hindsight for this decision, but I have personally seen many incidents that were triggered by performing software updates.
Impact starts: A repair triggers a poisoned clock
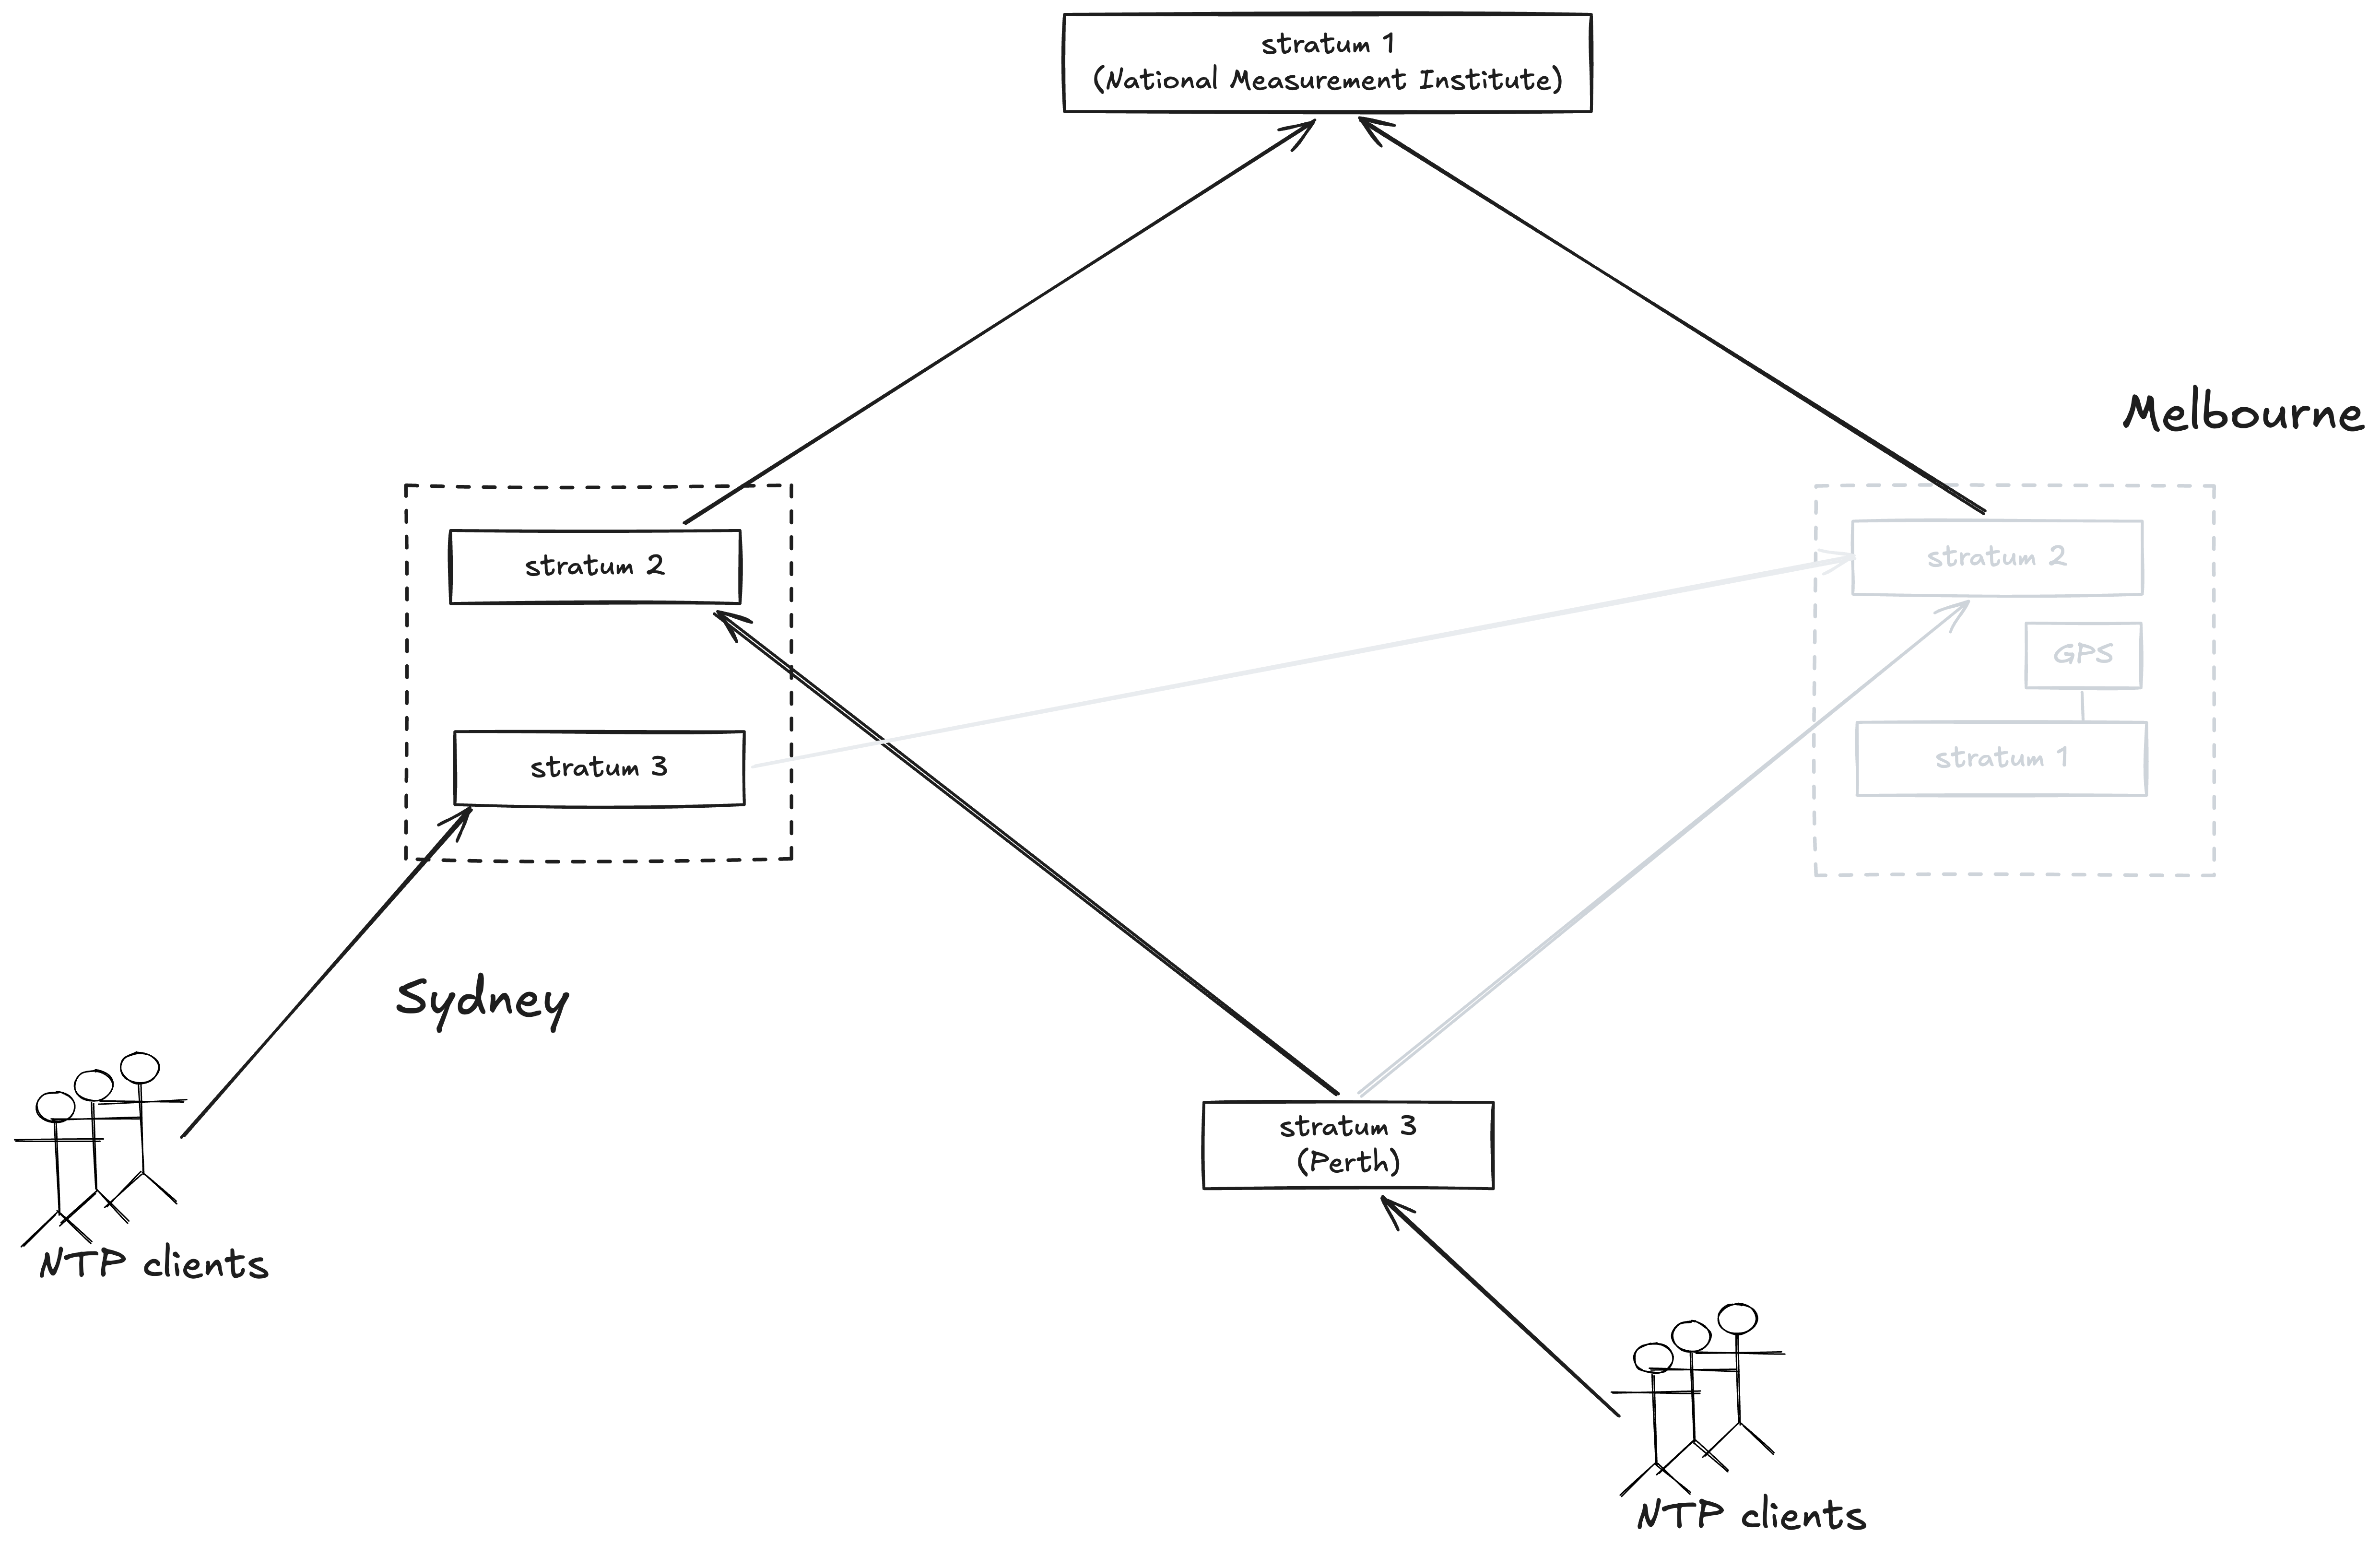
On July 8, 2026, Telstra network engineers took the SSU 2000 offline in Melbourne in order to fix an issue with a redundant power supply:
When the maintenance team came to do the work on this server, they were required to power it down and take it offline because they needed to replace what we call the chassis, the case that it sits in, because its backup power supply was not working. So they put in a brand-new chassis. – (Telstra CEO) Vicki Brady, Senate Environment and Communications References Committee
Melbourne NTP servers go offline as SSU 2000 is powered down for maintenance
The report doesn’t say how long the unit was offline, nor does it discuss what happened to the Sydney stratum 3 NTP server that had Melbourne as its sole source. One thing that’s clear is that there was no system impact while the unit was down.
It was when the unit came up again that the trouble started. At 2:50 AM, the unit is powered up and comes back online. When the GPS card comes back online, the rollback issue manifests, sending its clock back 19.7 years, from July 2026 to November 2006.
The poisoned clock time spreads across the network
Since Melbourne was operating at stratum 1 and peering was enabled and Melbourne stratum 2 had been turned off by the same chassis replacement, the incorrect date propagated throughout the mobile core timing network.
Because the Melbourne NTP servers had gone down for maintenance, Sydney lost its source for its stratum 3 server. While presumably it had a GPS card to fail over to, they were configured to only fail over manually. So, unlike Melbourne, Sydney does not switch to using GPS card as a source.
However, because the NTP servers are configured to support peering, the Sydney NTP server is able to use one of its clients a source. When Melbourne comes back up, an NTP client common to the two sites becomes a stratum 2, using Melbourne as the source. The Sydney NTP server uses this client as its time source, and now the poisoned time has propagated to the Sydney site, with its clients impacted as well.
Orange shows the propagation of the incorrect time from Melbourne NTP server to Sydney NTP server
(Note: The report does not say whether the Perth NTP deployment was impacted by this, so I’m going to assume it wasn’t).
Impact: mobile users can’t call or use data
70 minutes after impact start
Starting at around 4am July 8th, 2026, when Mobility Management Entity (MME) instances began to reset, end users of Telstra’s network experienced varying levels of impact in their ability to communicate on the network.
At this point of the write-up, I’m really out of my depth, because the details of the failure are telecom-specific. I don’t even know if an MME instance is a software thing or a hardware thing. Based on this case study on Ericsson’s website, I assume that Ericsson is the vendor, and according to this Ericsson page, it sounds like it could be either one, as it says: Our latest software release can be deployed as a physical network function (PNF), as well as a virtual network function (VNF).
What I do know is that it provides a control plane function that communicates between users’ phones and the mobility network. When these instances reset, it broke mobile functionality, including emergency service calls (Triple Zero in Australia).
These impacts precluded some users from being able to make/receive voice calls, including Emergency Calls (per the Emergency Call Service Determination:2019, also referred to as Triple Zero calls), send/receive messages, or access mobile data services. Those without data services were unable to do things such as access the web, stream content and most mobile applications were unusable as well.
During the worst of the incident, 45% of mobile users were impacted:
Until the correct network date was restored, information for approximately 30,000 IP address prefixes were incrementally corrupted (written with the wrong date) by the Diameter Signalling Controller (DSC) in such a way that access attempts using those addresses were blocked from using the network regardless of available capacity.
My guess based on this is that a Diameter Signalling Controller (once again, I’m guessing they’re using an Ericsson product) is that the DSC keeps a table of session information about active IP addresses on the network. And because entries got written to the table with the rollback date, the system interpreted these as invalid and did not allow these addresses to access the network.
Note that this is a poisoned data scenario: network engineers had to fix these records before the users could regain access.
Telstra, with help from their equipment vendor, applied a workaround during the Outage and then at a later time performed repairs to remove the bad IP address prefix entries.
This is a pretty clear example of an incident that involved saturation. The original MME instance resets don’t take out the entire mobile network, but they have the effect of reducing capacity enough that the remaining capacity is not sufficient to meet demand. From the report:
Initially users were impacted by a loss of network capacity (due to failure of MME instances) which caused some users to be disconnected from the network. The remaining capacity was insufficient to enable those users to all reconnect deterministically nor was it capable of servicing the nominal network traffic load. So essentially the network was overloaded.
Problem area: networking
Admittedly, this one is a gimme: every large-scale telecom-related outage is going to be networking related, since what telecoms provide is network access! That was no exception here.
Problem area: security
It’s unclear to me in this case whether security systems played a role at all in this incident. I hypothesized that the loss of redundancy was due to a security restriction in the SSU 2000 unit, but I don’t know for certain that’s the case. It’s also possible that the Diameter Signalling Controller blocking the IP addresses was related to a security function, but there’s not enough information.
Essential non-standard changes: mitigating an operational issue
This is a clear case where the act of mitigating an operational issue was itself a contributor to a new incident. The trigger for this incident was repairing the power supply of the SSU 2000 unit in the Melbourne exchange. The repair itself went fine: it was powering up the unit that exposed the latent bug in the GPS card.
Essential increase in essential complexity: reliability subsystem
The GPS card, which was the source of the poisoned time, was a reliability subsystem! It exists to provide failover functionality in the case where an NTP lost access to its source. And unexpected behavior of that reliability subsystem, when engaged, bit them hard.
Essential increase in essential complexity: migration
I think Telstra’s 2020 upgrade of their timing hardware qualifies as a migration. This resulted in architectural changes that created a system vulnerability, although this vulnerability would not manifest for six years.
I do appreciate how the CEO was sanguine about how the nature of these sorts of changes means that incidents are inevitable.
What I would say is that networks and environments like a mobile network are absolutely complex, and it’s evolving—any sort of complex technology environment—and certainly networks are not infallible. But our job is to make sure we are taking the actions and those steps that will mitigate as best we can. I would love to be able to sit here and say will be zero outages. The reality of a complex network environment with fast evolving technology is that no telco around the world could guarantee that. – (Telstra CEO) Vicki Brady, Senate Environment and Communications References Committee
Some parting observations
There is no NTP haiku
In my experience, NTP isn’t a technology that frequently shows up incidents, at least not compared to other networking protocols such as DNS or BGP. The authors of the public report takes Telstra to task for a lack of sufficient NTP expertise within the company, and I can imagine playing a more significant role in the telecom domain than in other cloud software domains. But I can’t help but wonder if the fact that NTP isn’t generally problematic contributes to organizations having less in-house NTP expertise.
Appalling incuriosity from the investigators on how the work gets done
the need for stronger competency and more curiosity to investigate when something looks wrong
As is always the case in these sorts of public reports, there’s a lot of ink spilled on the subject what engineers should have done in the run-up to the incident but didn’t. The bullet “Increase attention to the operation and management process discipline in all areas” pretty much says it all.
Whenever I see this sort of content in a report, my response is, “boy, the investigators really blew it.” And that’s because you can’t understand how the incident happens unless you understand how the work really gets done within the organization. The authors show an acute lack of curiosity about the circumstances of the individuals who were involved in making the decisions.
I’ll note that these authors managed to mess up the section numbers in their report: it goes 1,2,1,2 instead of 1,2,3,4. This leads them to reference a non-existent section 4.1. I would ask the authors: Do you think we should be taking advice on how to run a reliable telecom network from people who can’t even number sections correctly in a ten page document? Or do you think we should consider the circumstances that could lead to this sort of error?
Where are the other system vulnerabilities?
We observed instances where other areas and elements of the network and organizations were performing at better levels than NTP.
Finally, it’s easy to point out problems in a system that were exposed by a recent incident. The really impressive thing, to me, is to identify the problems that were not exposed here. I have high confidence that there are other architectural vulnerabilities in the system, just waiting to be turned into incidents because of future changes. And yet, somehow, investigators never manage to find new vulnerabilities that could lead to the next outage. Funny thing, that.
The other day, I wrote about a GitHub Actions incident. But GitHub Actions isn’t the only CI-as-a-service out there. Buildkite, which is another CI company, recently released a public write-up of an incident they experienced last week. It’s a great one: their incident report contains a lot more detail than GitHub’s. Here I’ll discuss my own observations.
The failure mode
The write-up describes what I found to be a fascinating failure mode. Here I’m going to do my best to explain it in my own words.
A bit about Kubernetes
First, some Kubernetes terminology to get us all on the same page. When you’re using Kubernetes to run your services and jobs, we say that you are running on a Kubernetes cluster. A cluster is made up of multiple nodes. If you’re running on EKS (Amazon’s Kubernetes offering), I believe those nodes are going to be EC2 instances.
Each node exists to run pods, which are the compute workloads that you run on Kubernetes. If you’ve been a service owner for a service that runs on Kubernetes, then you’re almost certainly familiar with the notion of pods, because that’s what’s exposed to you. But, unless you’ve worked in infrastructure, you’re likely not familiar with nodes and clusters, because those implementation details are deliberately hidden from the service owners.
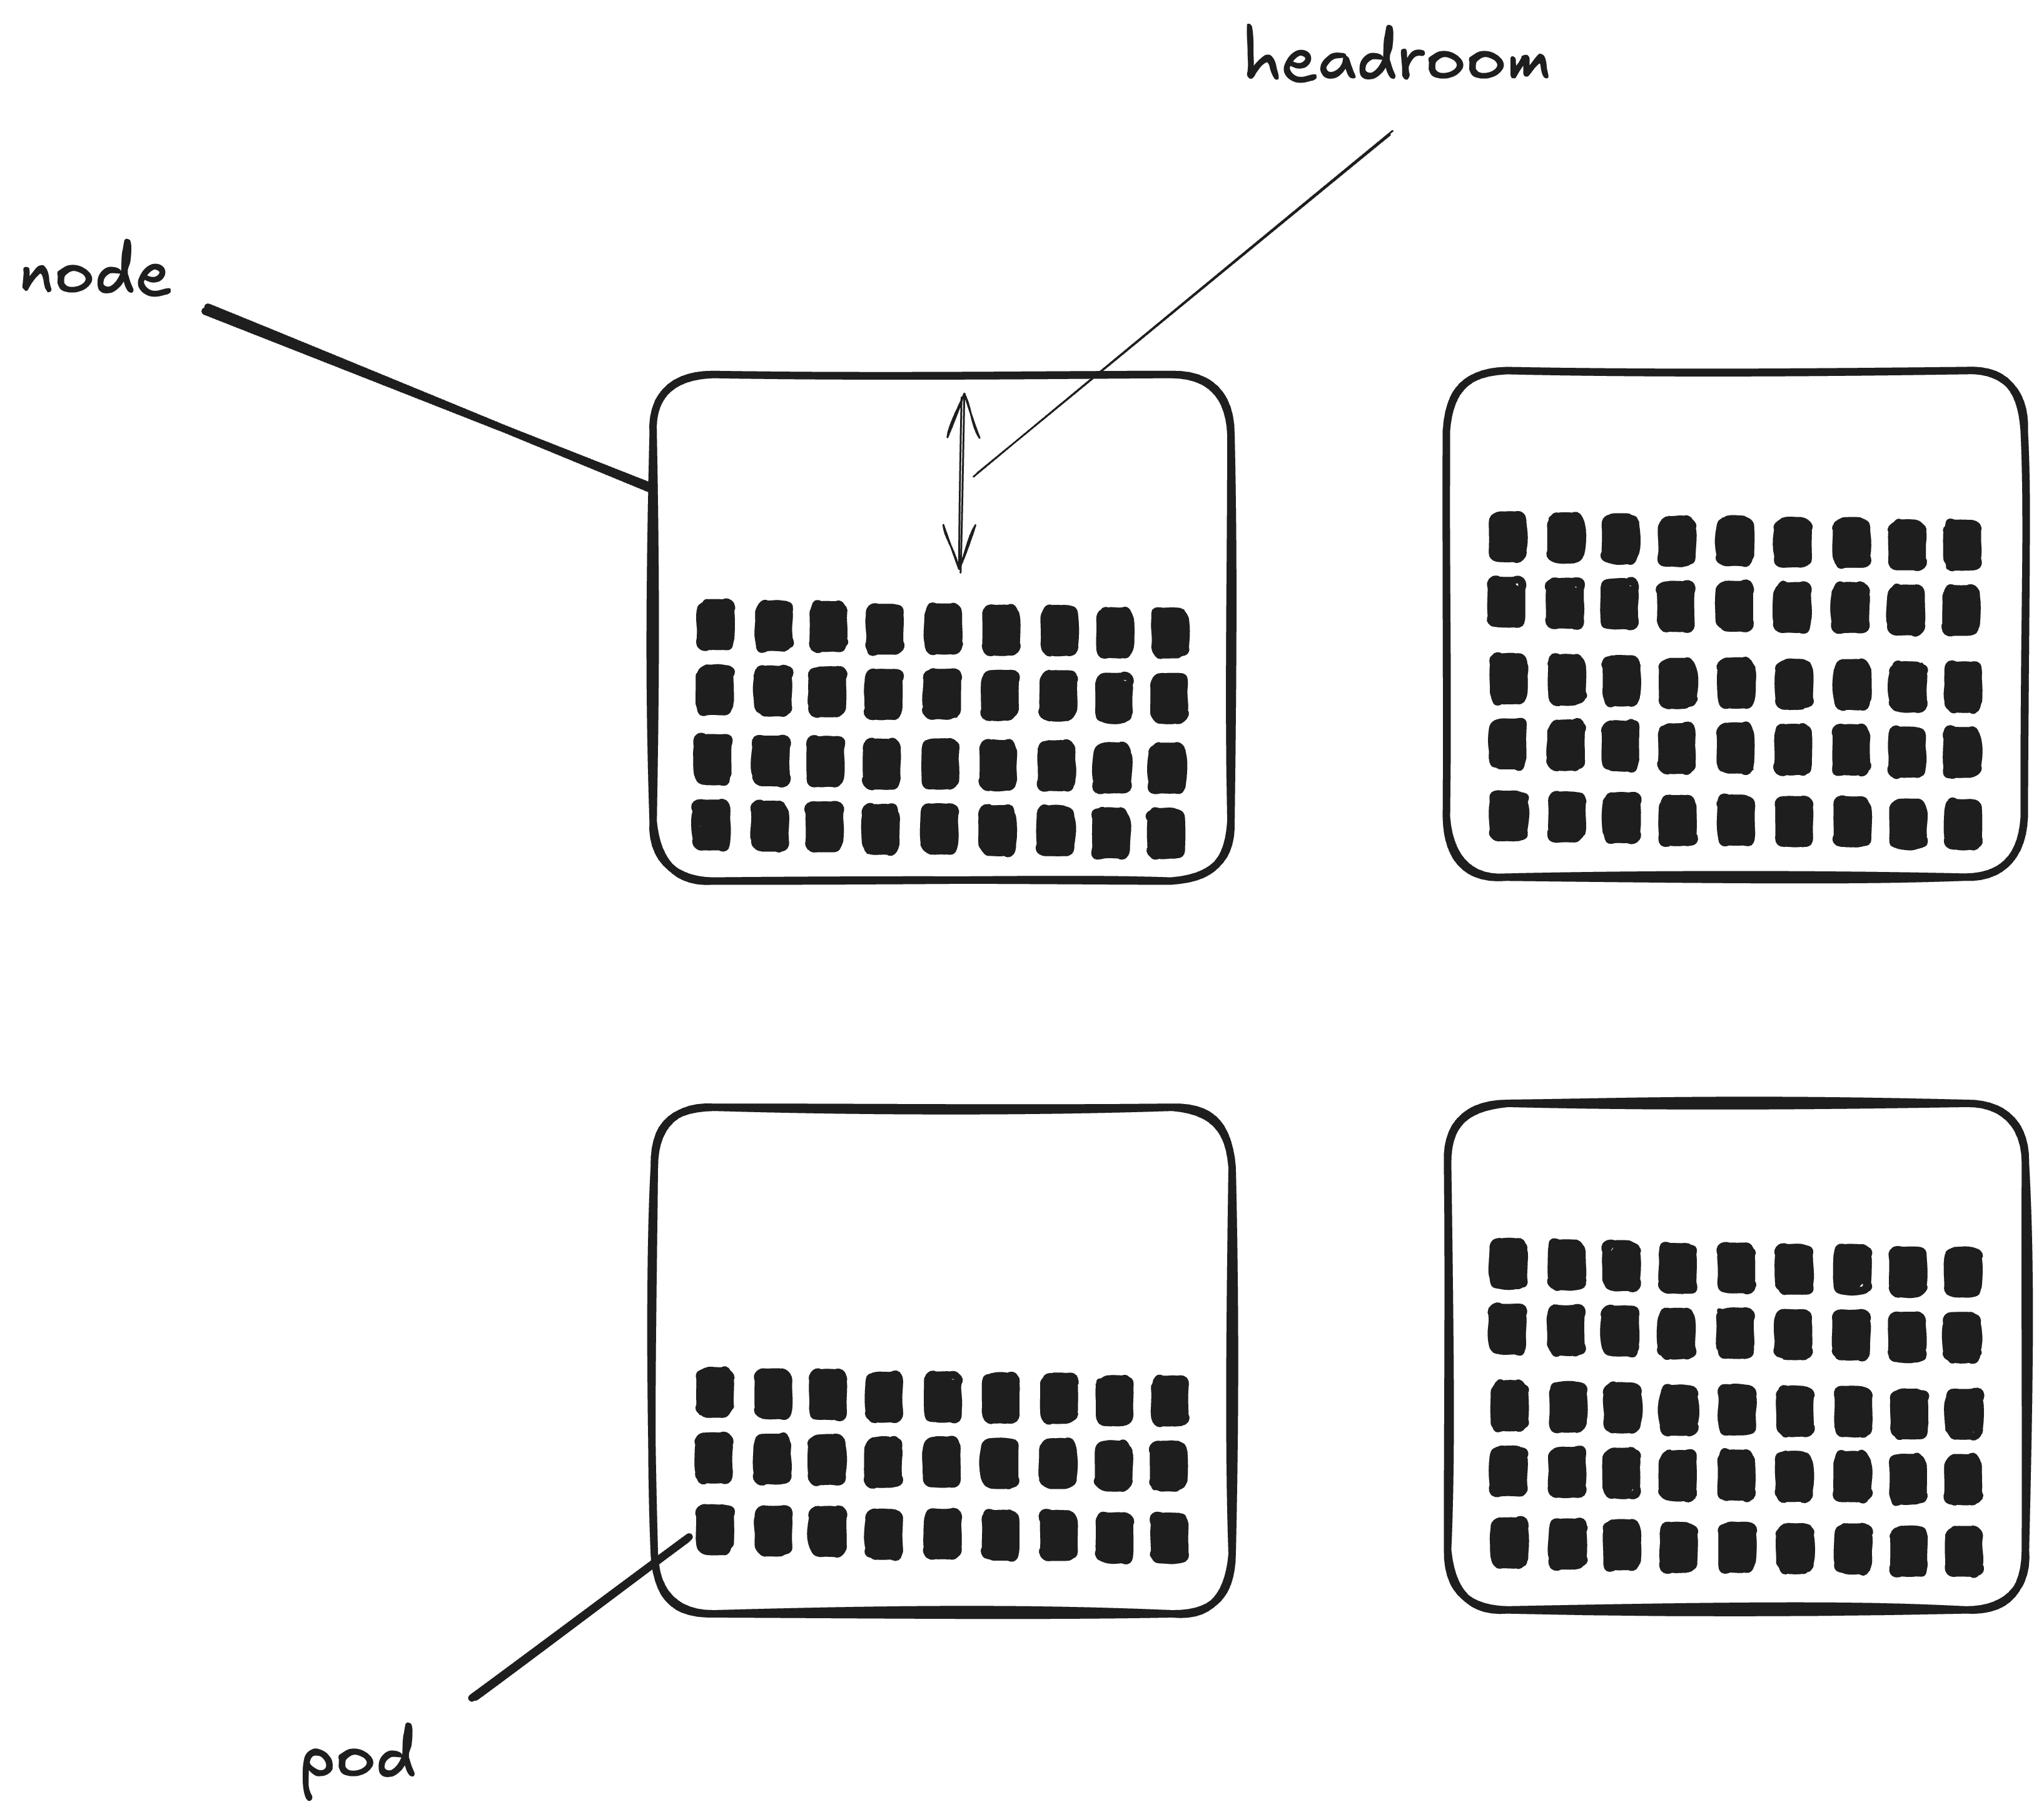
Here’s a diagram that shows a four-node Kubernetes cluster. Each black rectangle depicts a pod that is running within that node. A pod is a set of containers that all get scheduled together (typically an application container and related sidecars), but that particular detail isn’t relevant here.
A kubernetes cluster with four nodes, each one running multiple pods
I’ve also labeled the blank part of one of the nodes as headroom. That’s not explicitly a Kubernetes concept. Rather, it’s a general term that here means “the amount of additional compute jobs that could still be run on this node.”
A few brief words on autoscaling
Let’s take the service owner’s perspective again. You own a service that runs on Kubernetes. That service is deployed as a group of pods, what Kubernetes calls a replicaset. Note that each pod is identical, so the only reason to have multiple pods is because you need additional compute resources. The amount of compute resources that your service needs can vary over time. For example, if you’re driven by requests, then the volume of requests can vary. Or, if your service consumes from a job queue, the number of pending jobs can vary at any one time.
Kubernetes deals with workloads whose resource needs vary with time by supporting autoscaling. The system I’m most familiar with is the HorizontalPodAutoscaler, which will increase or decrease the number of size of a replicaset depending on the load.
A brief sidebar about scaling terminology. There’s a distinction between horizontal scaling and vertical scaling. If you’re adding more servers, you’re horizontally scaling, whereas if you’re increasing the size of your servers, you’re vertically scaling. Technically, it’s more accurate to use the term scale out to refer to horizontal scaling, and scale up to refer to vertical scaling. and, indeed, the Buildkite write-up uses scale out. But I’m used to saying scale up for horizontal scaling as well, because that’s the kind of scaling I deal with more often. In this post, I use scale up and scale out interchangeably.
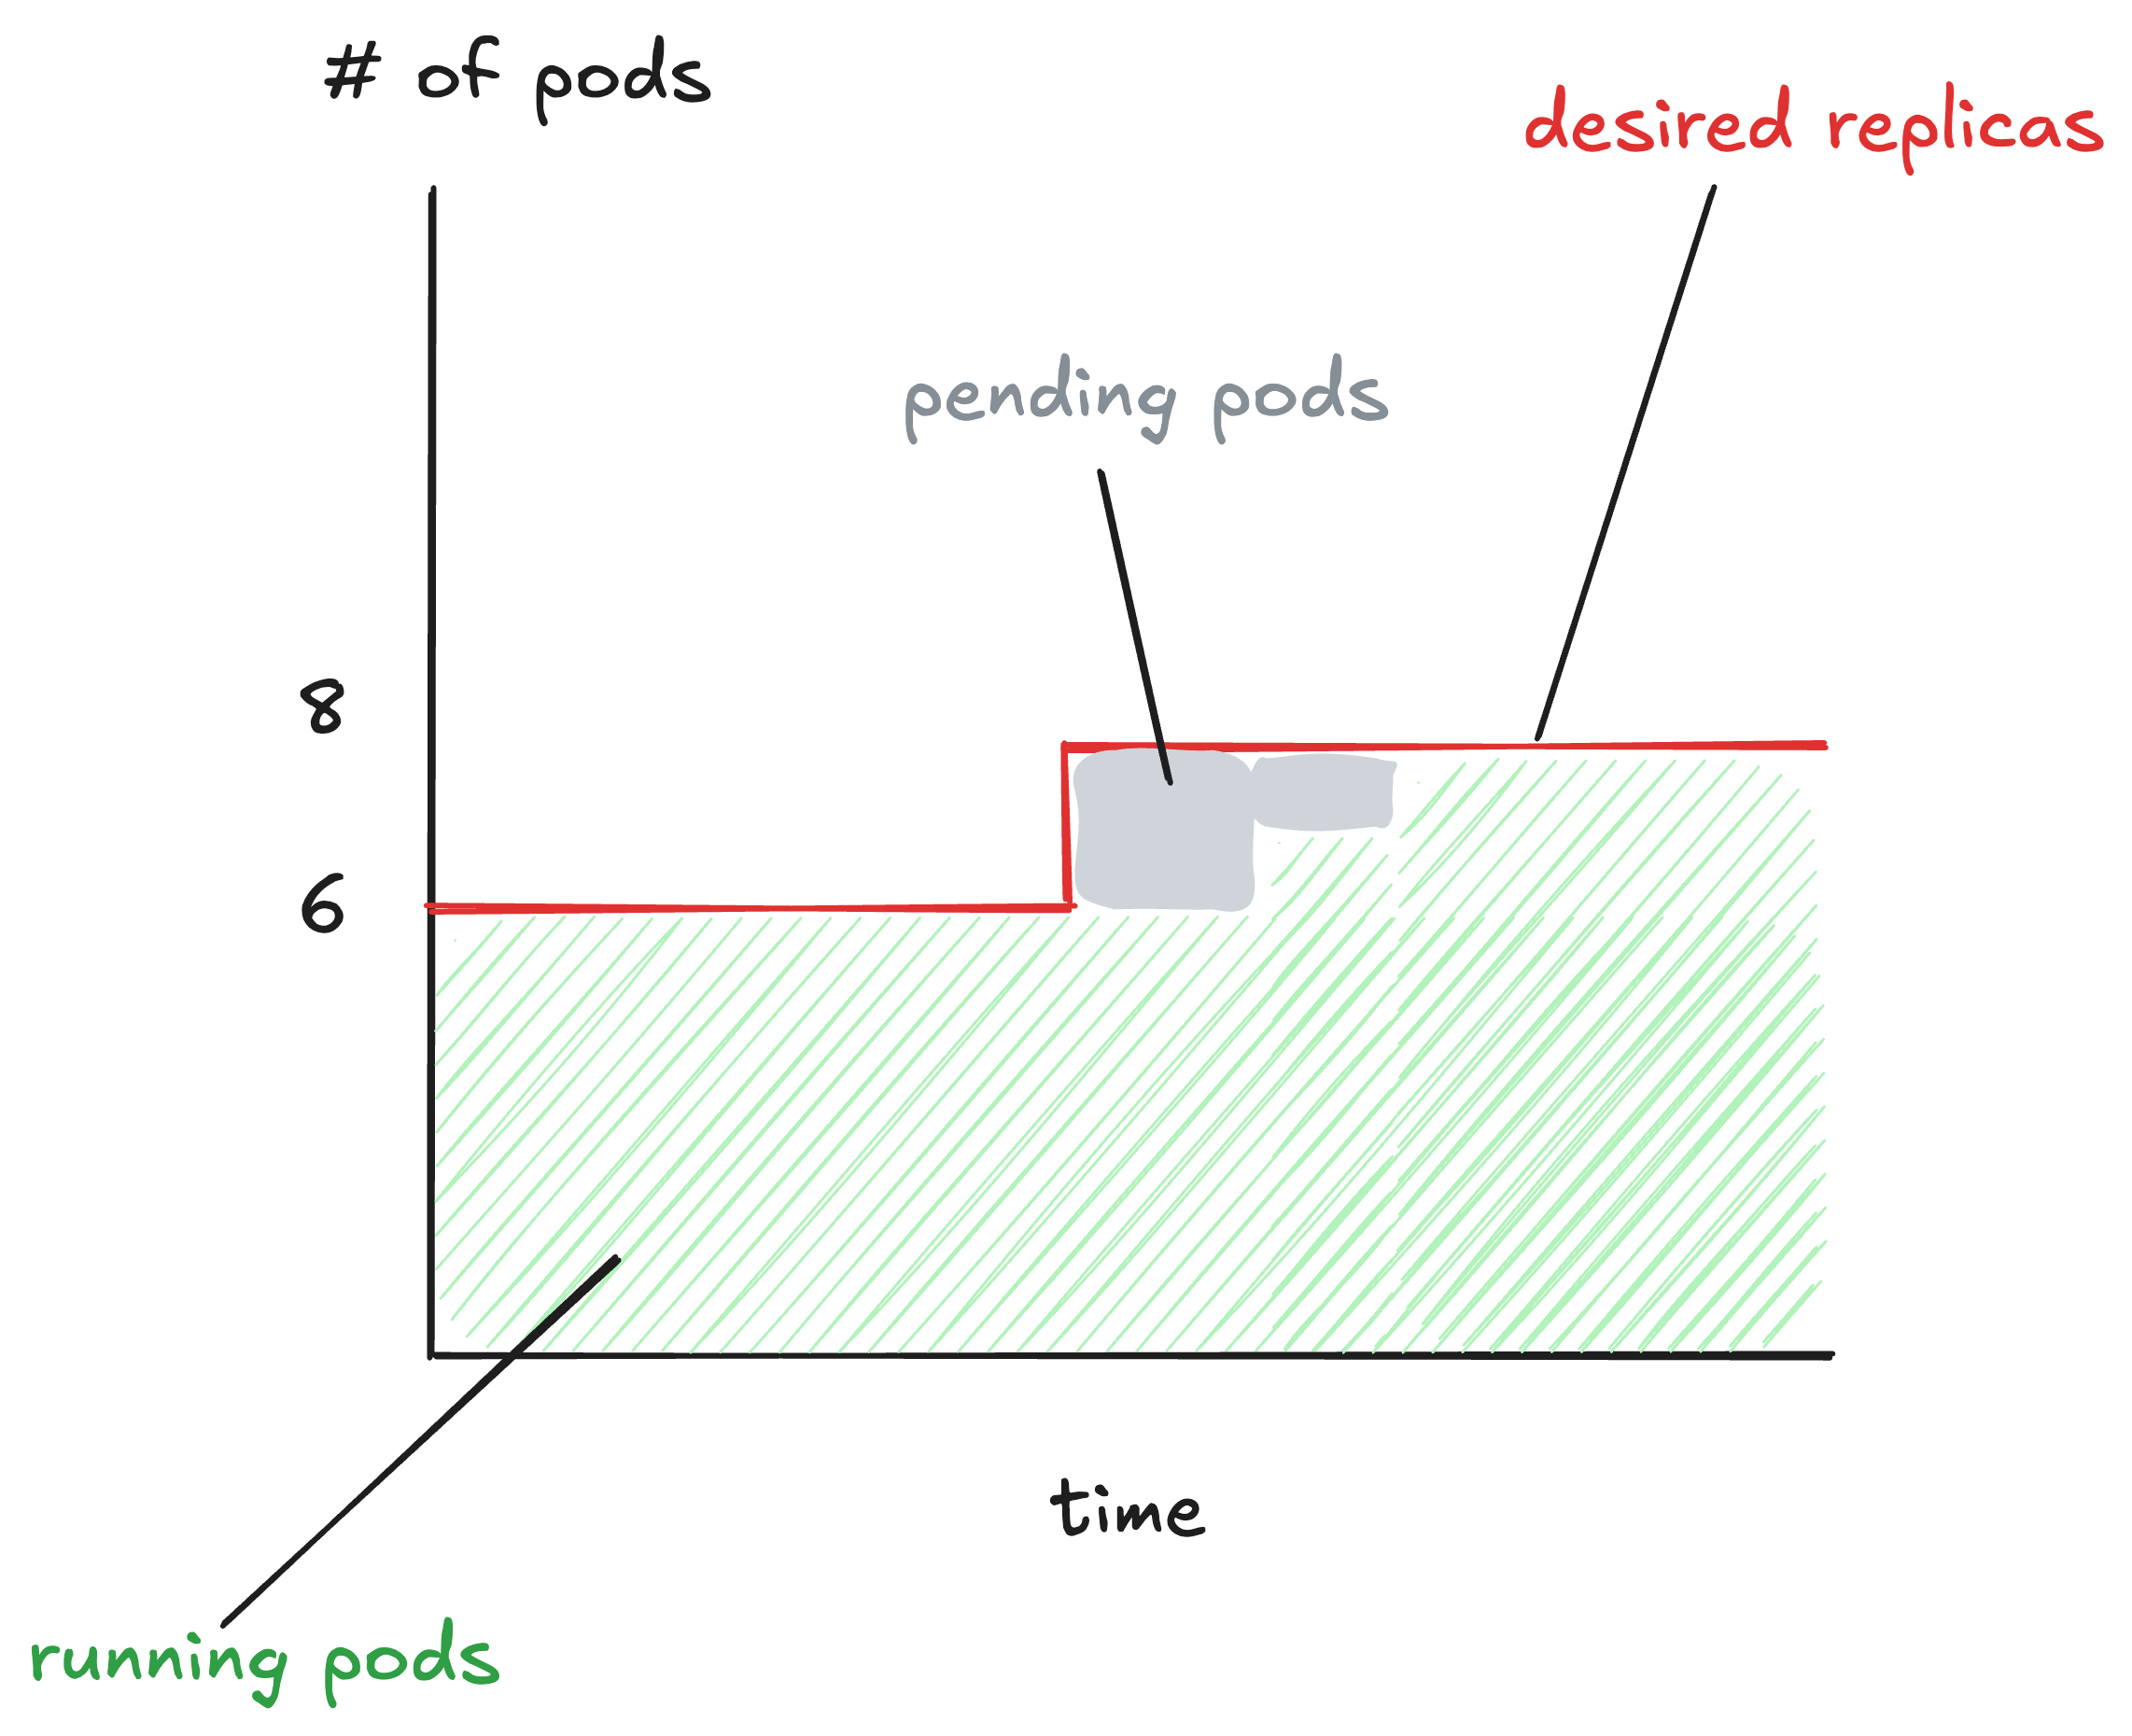
Here’s an example of a graph of a deployment that is undergoing autoscaling.
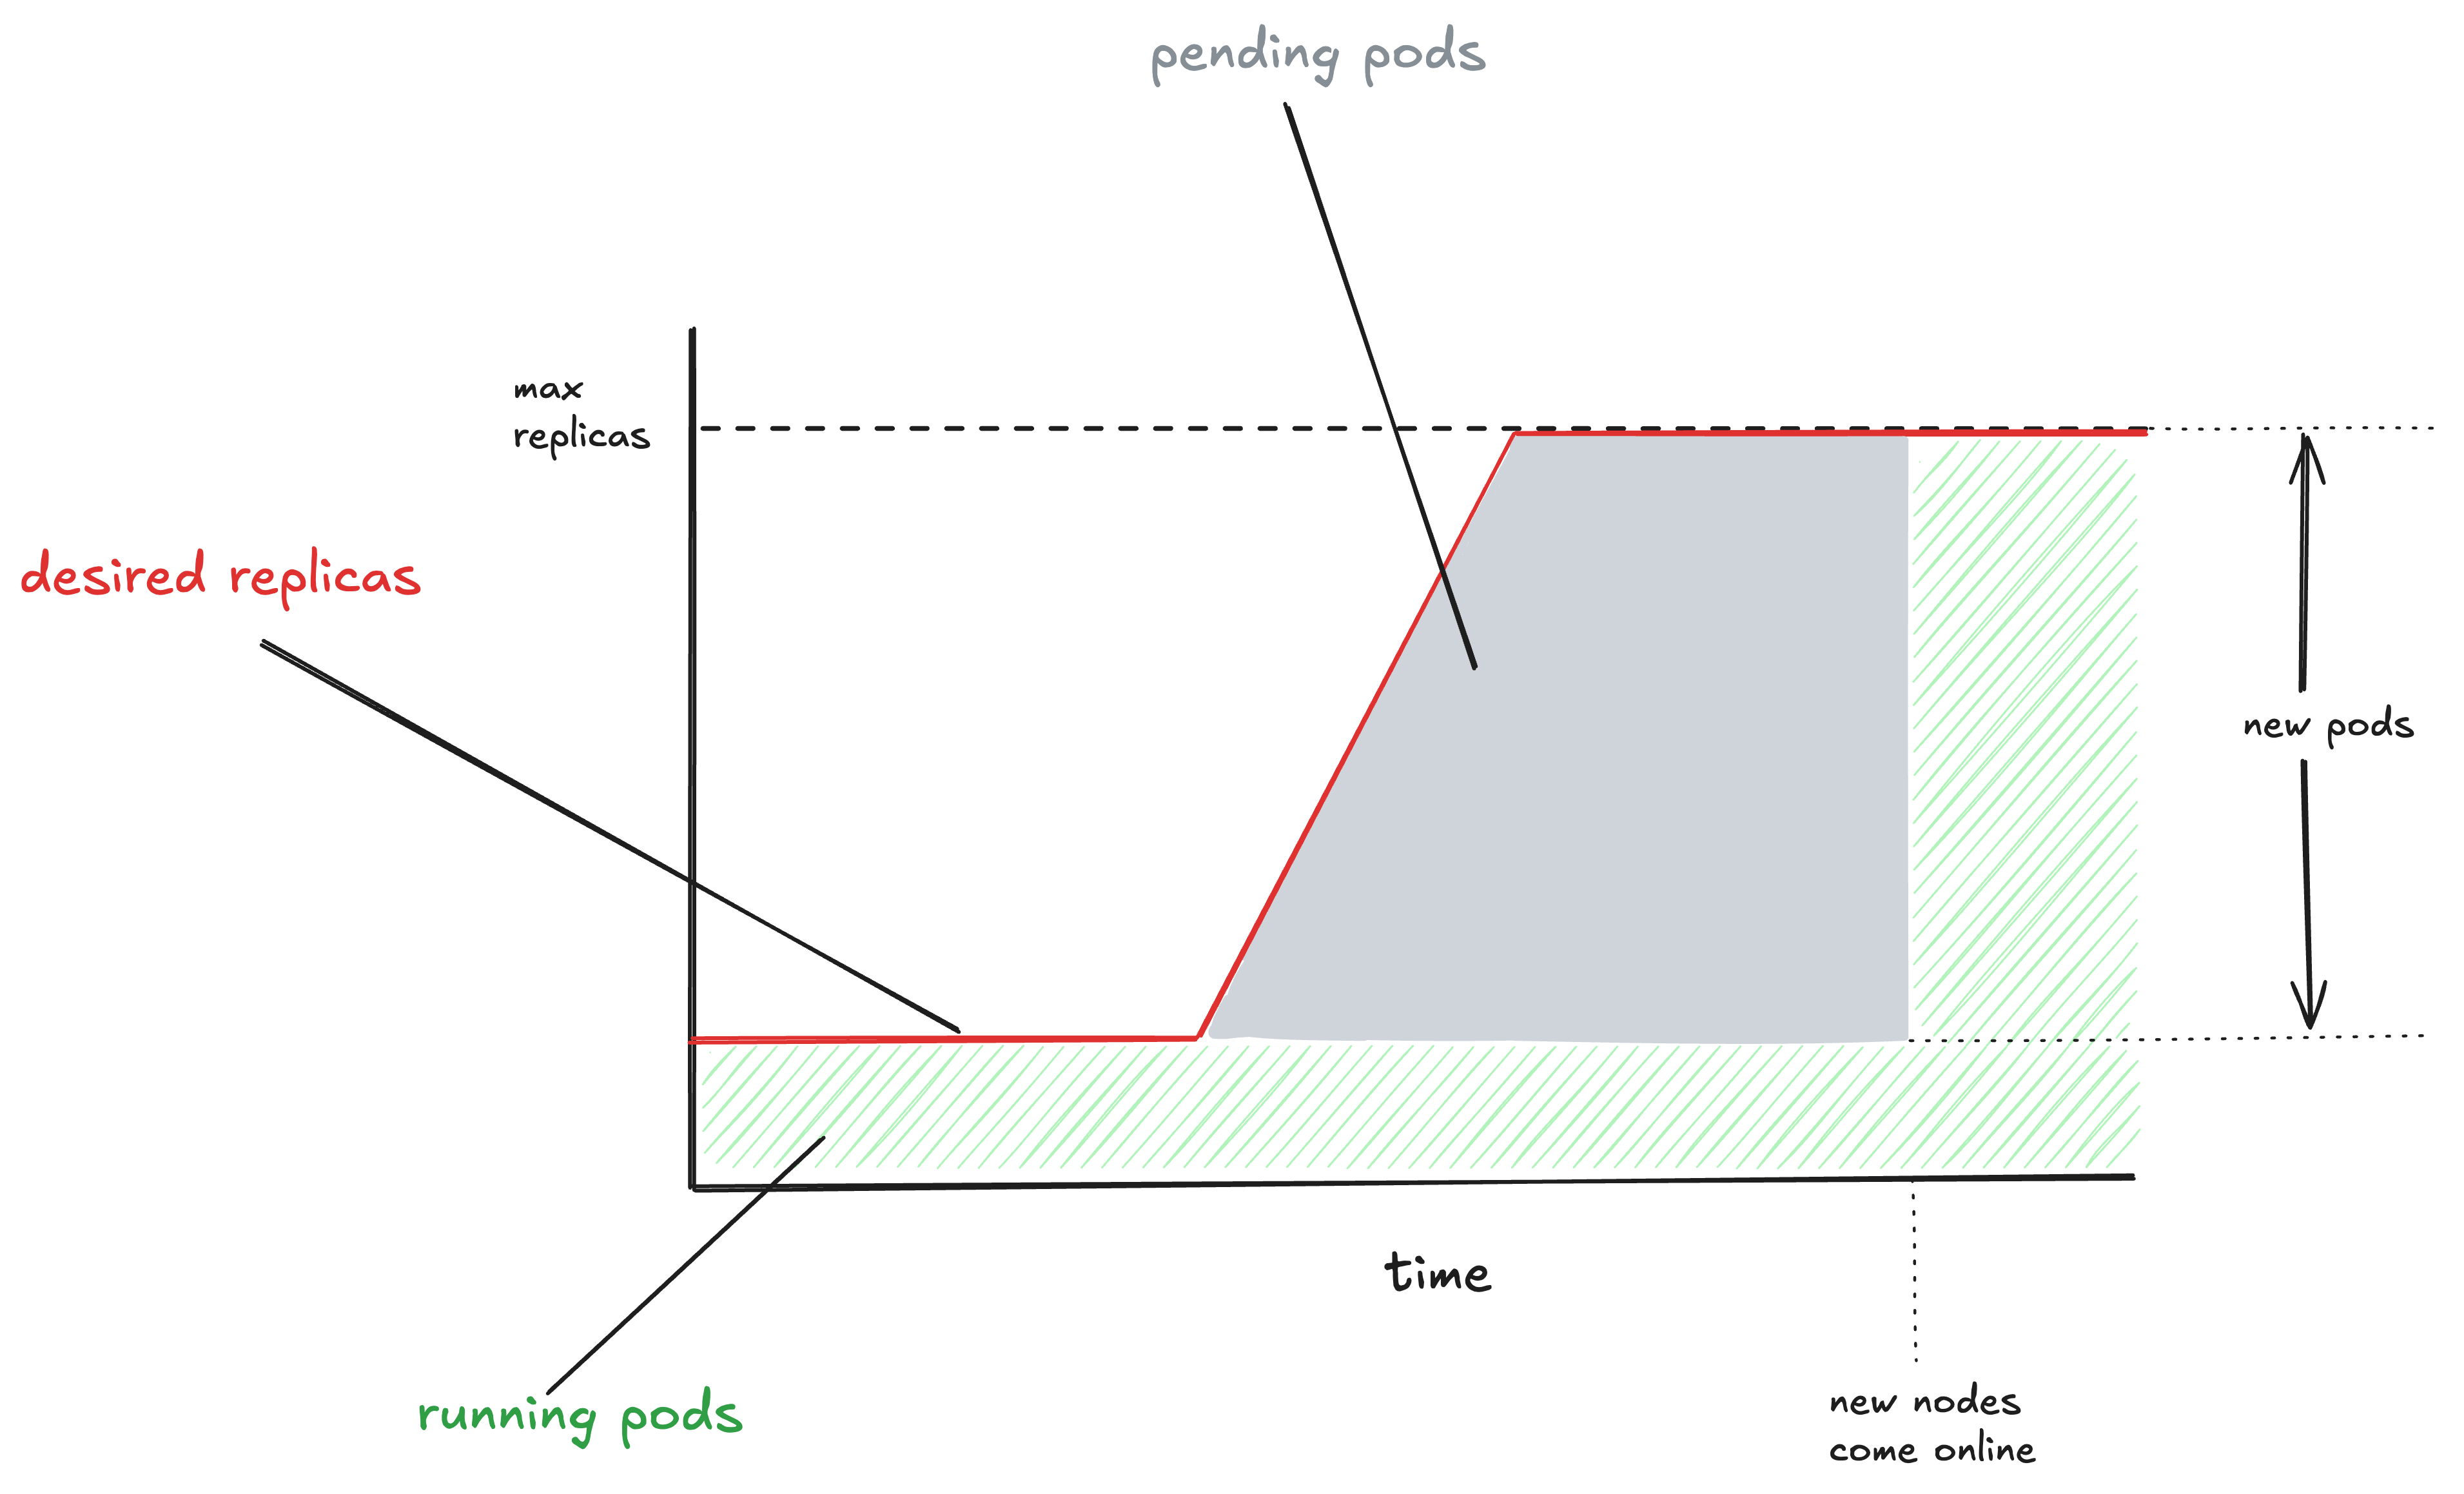
The red line indicates the desired replica count. That’s the number of pods that the autoscaler has determined should be running. At the beginning of this graph, the desired number of pods is 6. Later on, the autoscaler adjusts the desired replica count to 8.
The green indicates the number of pods that are in a running state. Note at the beginning of the graph that there are 6 pods in running state, and at the end there are 8 pods. Here’s how the Kubernetes docs describe the running state:
The Pod has been bound to a node, and all of the containers have been created. At least one container is still running, or is in the process of starting or restarting. – Kubernetes pod lifecycle docs
The gray is the interesting bit. That shows the pods that are in the pending state. Here’s how the Kubernetes docs describe the pending state:
The Pod has been accepted by the Kubernetes cluster, but one or more of the containers has not been set up and made ready to run. This includes time a Pod spends waiting to be scheduled as well as the time spent downloading container images over the network. – Kubernetes pod lifecycle docs
After the autoscaler increases the desired replica count to 8, another Kubernetes controller sees the difference between current replica count (6) and desired (8), and spins up two new pods. But those pods don’t immediately start running. Each new pod has to be scheduled onto a node in the cluster that has headroom. Until that happens, the pod is in the pending state.
A deployment consumes all of the headroom, workers try to scale up
Let’s turn back to the write-up:
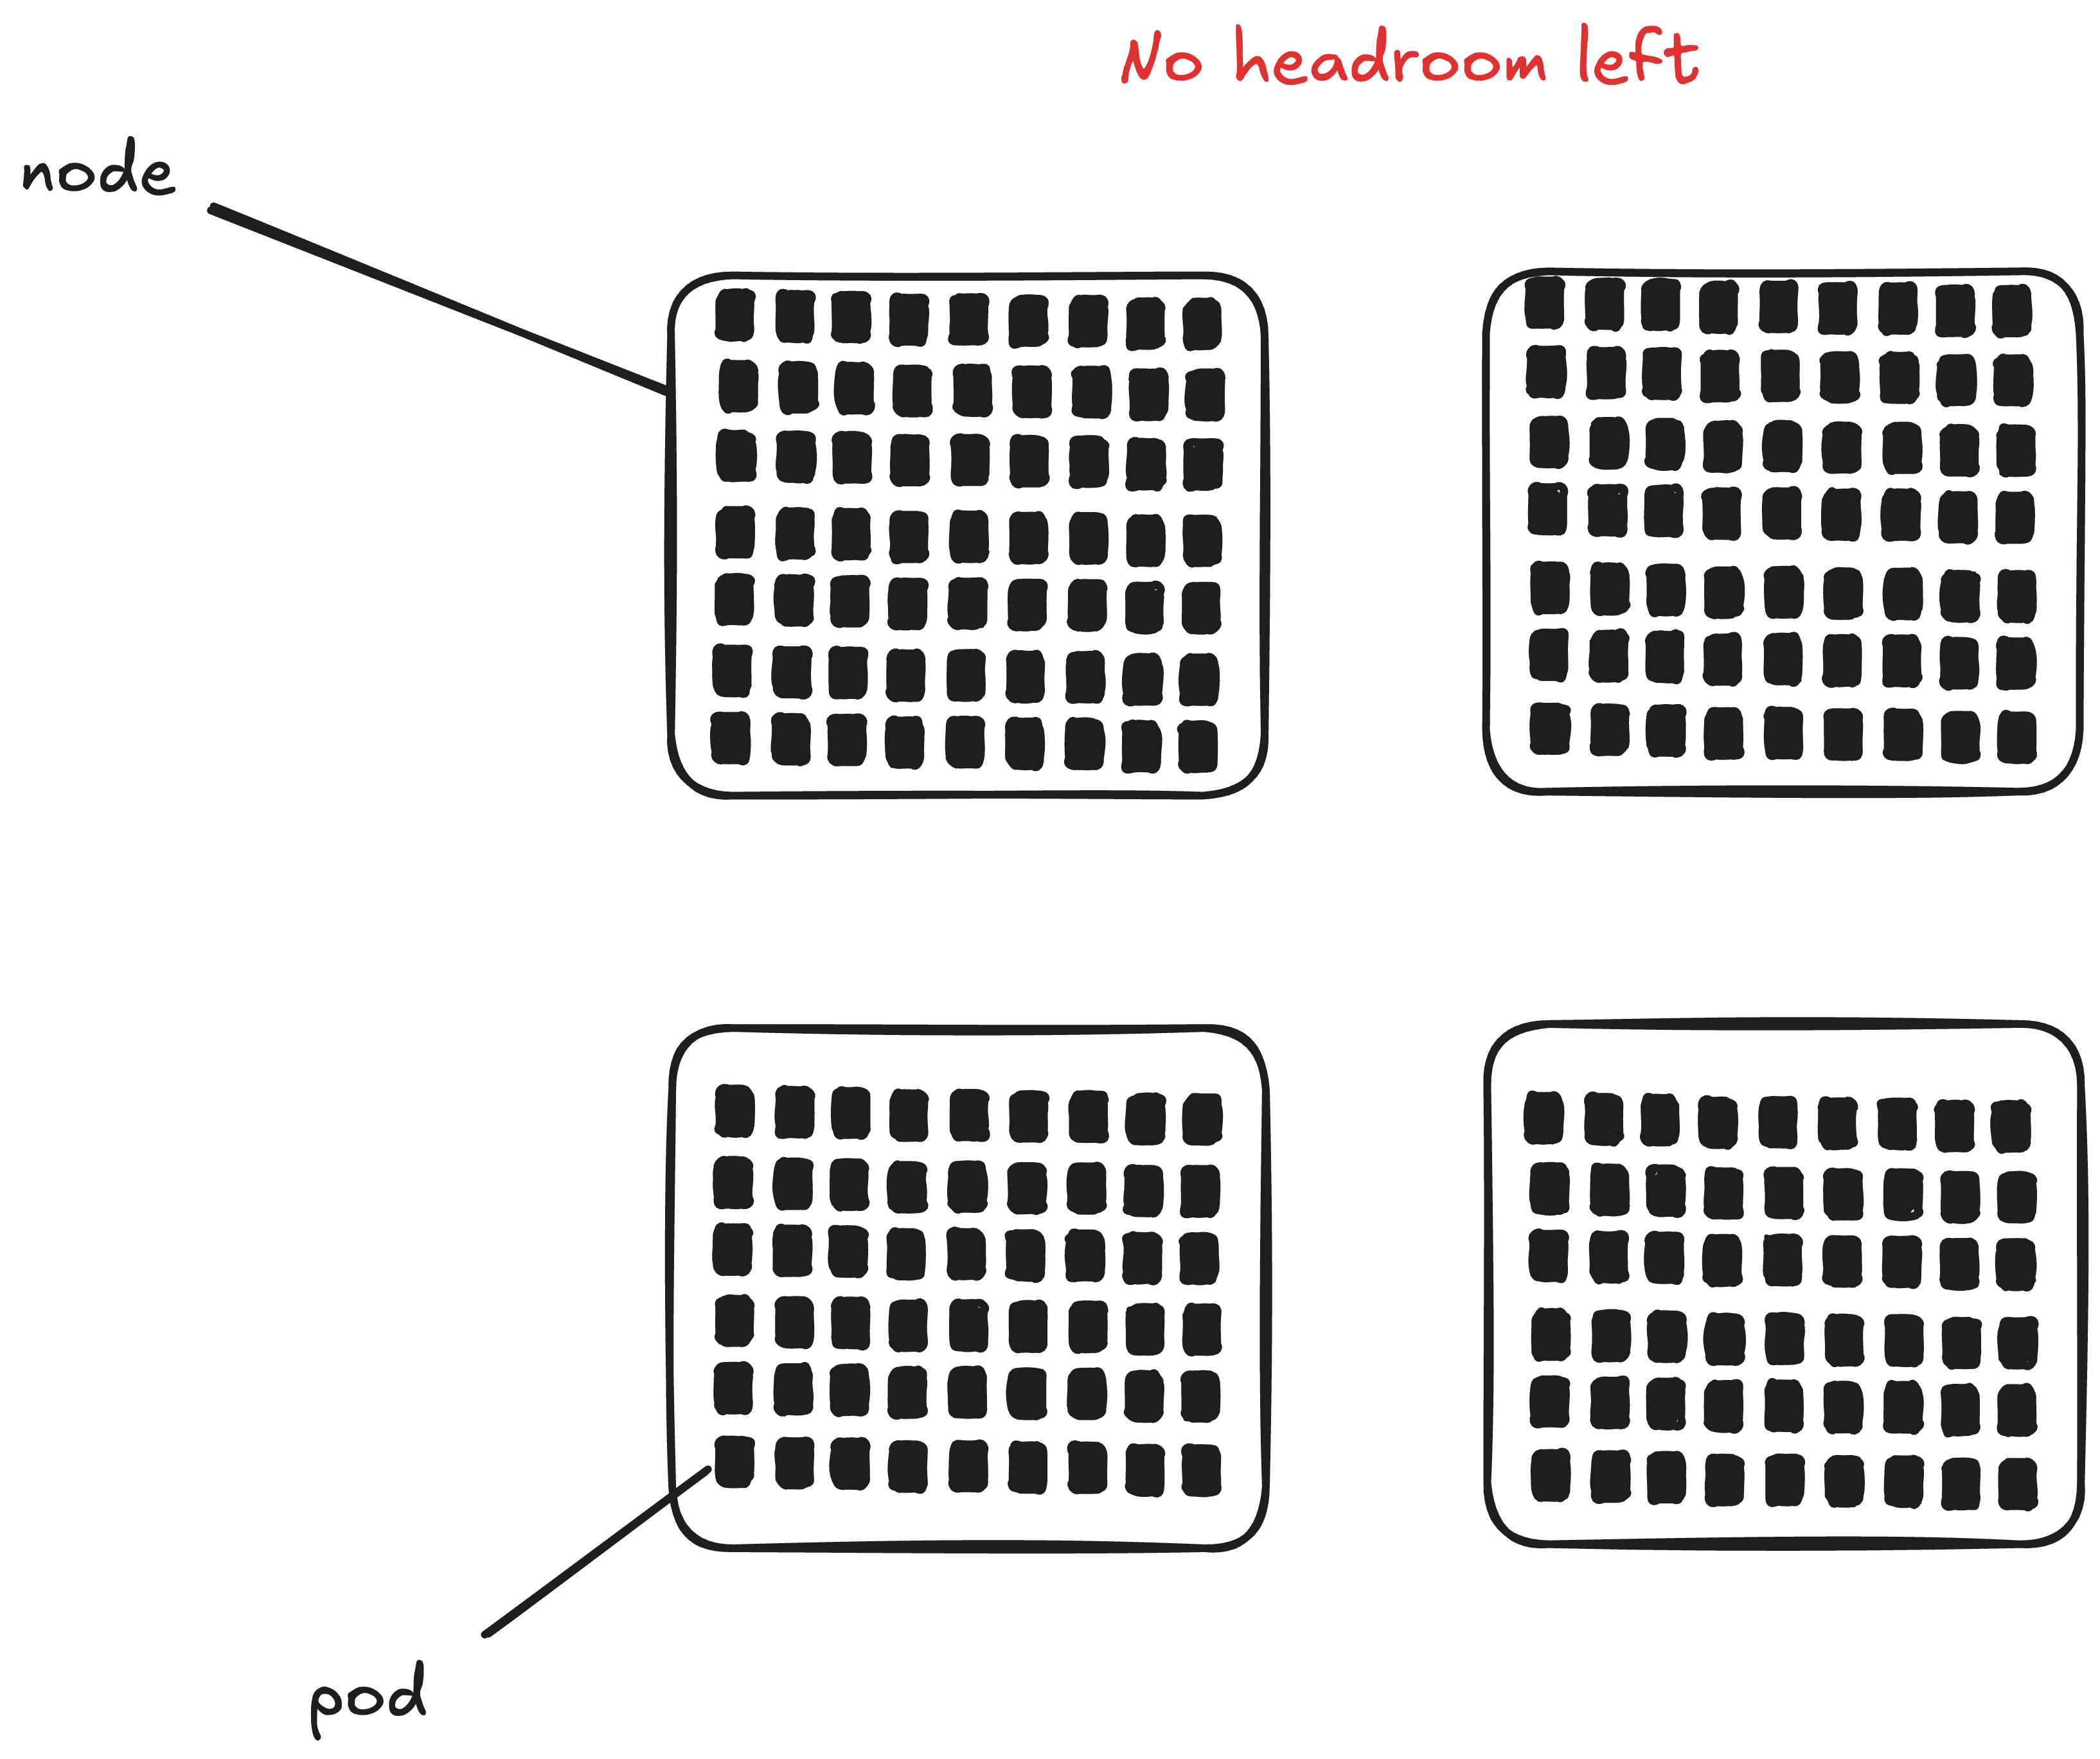
At 22:44 UTC, an application deploy created a surge in application Pod volume… This surge consumed the available headroom on already-deployed Nodes.
When you deploy a new version of your software onto a Kubernetes cluster, the cluster spins up new pods with containers that are running the new version. In this case, these pods new consumed all of the available resources on all of the nodes of the cluster.
A Kubernetes cluster where no nodes have available capacity
In Buildkite’s case, in addition to an application deployment eating up all the headroom, there was a replicaset of background workers that was being scaled up by the pod autoscaler at the same time. From the write-up:
At 22:44 UTC, an application deploy created a surge in application Pod volume… This surge consumed the available headroom on already-deployed Nodes, which limited applications’ capacity to autoscale promptly. Some background workers (including the aforementioned notification workers) were also attempting to scale out at this time.
So, we have one application (background workers) trying to increase its replica count, at the same time as another application has eaten up all of the available capacity.
You can scale up your k8s cluster too, but you’ll need to wait
At 22:44 UTC, an application deploy created a surge in application Pod volume, which caused our EKS cluster to scale out. (emphasis added)
Just like a service owner can configure autoscaling for their service, a Kubernetes administrator can configure autoscaling for their cluster: when it starts to run out of headroom, the cluster autoscaler can automatically request new EC2 instances from AWS. Instead of using the horizontal pod autoscaler (which is for scaling pods), you use a cluster autoscaler, like Karpenter, which happens to have been written by AWS. But the general concept of autoscaling is the same here.
However, as we saw in the diagram above, autoscaling isn’t instantaneous: it takes time to provision new EC2 instances and add them to a Kubernetes cluster.
The headroom shortage and subsequent cluster autoscaling delayed provisioning of the compute requested by those services. Since there had been no change in the metrics that triggered the services to scale up, those services requested even more Pods.
Normally the impact of such runaway autoscaling would be limited by the services’ configured maximums. However, as mentioned previously the maximums for these services had been set higher than usual.
Here’s my best guess of the behavior they saw, based on the text.
My understanding of the scaling behavior (idealized)
The above diagram is a sort of schematic representation of my understanding of what happened. Some services running on the cluster scaled up, meaning the desired number of replicas increased for those services (that’s the red line going upwards). However, because the cluster was out of capacity, and the new nodes had not come online yet, the new pods were still in pending state waiting for the new capacity.
From the write-up, it sounds like the desired replica count continued to increase during this period. When configuring an autoscaling policy, you always configure a maximum number of replicas constant. This max replicas constant for the worker pool in question had previously been set to a high value when the pool was first created.
To ensure sufficient capacity for both pools, we initially configured each with the same high maxReplica count as the original shared pool, with the intention of reviewing and adjusting the limits for both pools downwards at a later date…
Normally the impact of such runaway autoscaling would be limited by the services’ configured maximums. However, as mentioned previously the maximums for these services had been set higher than usual.
Eventually, the new cluster nodes came online, and the new pods came online. This led to a large number of new pods coming online in the cluster.
(I can’t tell from the text whether the worker pool actually scaled all of the way up to max replicas or not, though).
Après autoscaling, le déluge
Buildkite services running in one of our production Kubernetes clusters depend on an internal DNS service CoreDNS to locate databases, queues, and other application components.
Once the new EKS nodes come online, the worker pool rapidly scales up. That’s not a problem for the worker pool itself. But it turns out that this rapid introduction of new compute resources into the cluster is a problem for a different service: CoreDNS.
The application deployment and runaway autoscaling combined to trigger an unusually high rate of change to applications, network endpoints, and cluster nodes.
From the write-up, it sounds like CoreDNS is the service discovery mechanism used by Buildkite. A service discovery system needs to keep track of the various resources in your system. The more churn you have in these dynamic resources, the greater the load is going to be on your service discovery system.
In this case, the step change in new cluster nodes and new application pods coming online put too much pressure on their CoreDNS service, and it fell over.
Incoming CoreDNS traffic
Once CoreDNS went unhealthy, the overall system was in real trouble:
CoreDNS unavailability caused failures across APIs, job dispatch, and notifications for all customers.
Like in the GitHub incident, the overloaded service wasn’t able to recover on its own. To remediate, the responders reduced the load by stopping new deploys, and then gave it more resources.
Retries and delayed work increased the load during recovery…
How we responded
We paused further application deployments, deployed more CoreDNS service replicas, raised the memory available to each CoreDNS replica, and expanded the node pool available to run them. The new set of CoreDNS Pods came into service by 23:12 UTC. After that, DNS errors fell rapidly. Customer-facing services processed the accumulated backlog and recovered fully by 23:16 UTC.
Actions taken for safety end up increasing risk
We often make operational decisions where we believe we are reducing risk. As mentioned earlier, it’s notable that the max replicas threshold was intentionally set high to reduce the risk of running out of capacity.
To ensure sufficient capacity for both pools, we initially configured each with the same high maxReplica count as the original shared pool, with the intention of reviewing and adjusting the limits for both pools downwards at a later date.
Pick a max replicas that’s too low, and your service can become overloaded: I’ve seen it many times. But picking a max replicas that’s too high created a risk that (I can only assume) nobody even conceived of in the moment. That’s the nature of the complex systems that we work with.
Control loops will drive you loopy
In one sense, this is a story of too much autoscaling, as it was a sudden, dramatic increase in scaling that led to CoreDNS being overwhlemed. But it’s also a story of not enough autoscaling: CoreDNS was not configured to autoscale at all.
The cluster’s CoreDNS service was running at a fixed size and did not automatically scale with the size or rate of change of the cluster.
An autoscaler is an example of a control loop in your system. In this particular incident, two control loops (the horizontal pod autoscaler and the cluster autoscaler) interacted in an unexpected way that led to an increase in CoreDNS, which was missing a control loop to ensure it had sufficient resources. In general, it’s difficult to reason about the behavior of interacting control loops. It’s these sorts of complex interactions that can make incidents hard to deal with.
If you’ve ever taken a course in control systems, you’ll know that stability is one of the primary concerns with building a control system, and that delays in your system can impact its stability. This was an interesting case of that where there were delays introduced because of the time required for the cluster to scale up. And, indeed, that led to that worker pool getting overscaled.
Rapid scale up as an increased load scenario
Because your application behaves differently on startup than when it’s fully warmed, if you’re in a situation when many pods are starting up, that’s a different mode of operation than your system normally deals with. Here we saw CoreDNS be the system that got overwhelmed. But any system that gets more interaction during startup than steady-state is at potential risk of being knocked over in a scenario like this.
Most load tests I’ve seen involved sending a significant amount of additional traffic to a system that’s in steady state. I’ve never seen anybody run a load test where they just dramatically scaled up a single service and watched what happened. But I bet you’d find some interesting failure modes that way that you wouldn’t find with traditional load testing.
The Buildkite incident checks off multiple boxes in my list of omnipresent availability risks in cloud software. Here, working involved in a migration (from ECS to EKS), and systems intended to improve reliability (autoscalers) resulted in saturation (CoreDNS), which impacted a networking system (once again, CoreDNS).
So many contributors
There’s a lot more detail in the write-up than I’ve covered in this post. I tried to collect the various contributors that they explicitly mention in the write-up. Here are the ones I spotted:
migrating from ECS to EKS
The EKS cluster was increasing in size during the course of the migration
An application deploy, which spiked the number of application pods
all remaining headroom in the EKS cluster being consumed by the application deploy
EKS cluster had to autoscale in order to make the new capacity available, this took time
background workers were attempting to scale out at the same time
metrics used for scaling background workers remaining unchanged while cluster is waiting for new capacity to come online
time-sensitive notification jobs had been moved from general-purpose pool to low-latency worker pool
high maxReplica count set on the low-latency worker pool
CoreDNS used for service discovery
large number of pods coming online led to high rate of change to apps, network endpoints, cluster nodes
CoreDNS runs at fixed size (does not autoscale)
defect in monitoring query which masked increases in CoreDNS query response times
Recent performance gains in application hid client-side latency increases
CoreDNS pods exceeded allowed memory limits, were restarted by kubernetes
continued demand for DNS kept load high on CoreDNS
DNS retries kept load high on CoreDNS
Finally, I commend Buildkite for providing so many technical details about the incident. It increases my esteem for their engineering organization.
Last week, GitHub Actions experienced another incident. As is typical of a GitHub public writeup, it was published very soon after the incident, but there also aren’t isn’t a lot of detail. But let’s see what we info we can glean from it.
Database saturation
The first thing I noticed is that this incident is, once again, a saturation-related failure mode. Specifically, it was a database that was saturated due to write traffic.
This impact was triggered by saturation of writes to the database primary used by the service processing triggers for Actions workflows.
As I mentioned in my last blog post, database-related saturation issues are particularly pernicious, because they can be very difficult to recover from.
Multiple contributors, but not much detail
The write-up mentions seven separate factors that contributed to the incident.
Growing peak daily load (this increased the writes to the database)
An upstream issue in GitHub’s event processing infrastructure (?), which further increased the load
Failing over from primary to replica did not lead to full recovery (?)
Existing throttles were set ~10% too high, so they provided insufficient overload protection
some jobs remained stuck in queued/waiting state after recovery (?)
another issue that left some jobs left in a waiting-for-runner state after recovery
a bug that left that some runs showing as queued even though they had already failed
I annotated contributors with (?) where I felt the report really didn’t provide any details at all. The mention of the upstream issue references a different GitHub incident, but there are no details on that other incident page at all. It does say “A detailed root cause analysis will be shared as soon as it is available”, so perhaps we’ll get more details on this other issue in the next few days.
What I’m most curious about, though, is what happened with the database failover. All we get in the write-up is this one line:
The primary was failed over, but the system did not fully recover.
What happened here??? Did the newly promoted primary get overwhelmed the same way that the previous one did? Did something else go wrong? I wish there they went into a lot more detail on the particular failure mode.
Slowly nursing an overloaded database back to health
On the plus side, the report does have some details on how they were able to mitigate. They throttled traffic to the database until it recovered, and then ramped the traffic back up slowly enough so that they didn’t knock it over again. Here’s the actual text:
At 15:45 UTC, throttling combined with service restarts recovered the service’s core health. Those throttles were gradually raised between 15:54 and 17:22 to restore full webhook processing for Actions runs. This ramp was deliberately slow to ensure we did not re-overwhelm the system given our original throttling was now known to be incorrectly set. The queue of webhook events was fully burned down at 17:40 UTC.
Two things I want to note about this. First of all, this sort of recovery approach is something you are going to need to do some day when your own database gets overloaded (and, believe me, it’s going to happen). If you’re prepared for this, you’ll have access to a throttle knob that the responders can manually control so they can cut the traffic and then increase it. It’s not something you want to have to build during an incident.
The second thing to note is that throttling means that you are deliberately cutting off access to the database for your users in order to bring it back up. This means that you will be temporarily increasing user pain in order to recover the system. This sucks, but it’s a decision you sometimes have to make during an incident: that you actually have to deliberately make the system behave worse from the user’s perspective in order to get it back into a healthy state. Now, if you have the ability of doing QoS-style throttling where you can selectively block the less important requests, then you might be able to reduce the amount of pain. But, once again, that’s something you need to have built into your system in advance.
Irony: fix was already in-flight when the incident struck
This line in the write-up broke my heart a little (emphasis mine):
Several changes to improve the general scalability of this part of Actions were already complete and deploying to production. Rollout of those changes will be complete within the next 24 hours.
They were already working on reducing the likelihood of an incident like this, but it bit them before they could finish rolling out the improvements. That’s really just bad luck.
Another GitHub incident, another limit hit
Finally, we continue to see GitHub hitting one limit after another as they experience continued growth. There are just so many different limits within a system like this. I won’t be surprised if I’m soon reading up on yet another saturation-related GitHub incident.
I’m using this post to gather together some common threads I’ve noticed after reading write-ups of major cloud software incidents. By cloud software, I’m referring to software-as-a-service (do people even say that anymore? in the cloud. This doesn’t just apply to cloud providers, although it does apply to them as well.
Here’s an outline of the topics in this post:
problem areas
saturation
example: databases
networking (traffic routing failure)
example: DNS
security (deny valid access)
example: SSL certificates
essential non-standard changes
mitigating an operational issue
migration
essential increase in essential complexity
reliability subsystem
migration
I think of all of these as omnipresent availability risks: I think these are fundamentally unavoidable, and will be contributing to software incidents until the end of time; or, at the very least, until the end of my own career in software.
There are three general areas that most major incidents seem to fall into: saturation, networking, and security. So, let’s start with those.
Saturation
Saturation is probably the topic I talk about most frequently, both on this blog and elsewhere (e.g.,: the saturation post I wrote for the Resilience in Software Foundation and my saturation talk at the Software Should Work conference). The system becomes saturated when it reaches a limit. That’s a pretty generic description, but there are many limits!
Databases
Many major incidents involve some system component becoming saturated in one form or another. I personally worry about database saturation the most. That’s because it’s difficult to recover from an overloaded production database. In addition, because database systems are such complex beasts, it can be quite difficult to even determine what the specific performance issue actually is. This is why having in-house database operational expertise is critical.
Saturation is an omnipresent risk because the finite nature of resources is a hard constraint in the world that we live in. Eventually, some resource in your system is going to run out.
While I prattle on endlessly about saturation, not every major incident involves saturation. You can encounter scenarios where all of your internal subsystems are reporting healthy, but from your customer’s point of view, your site is down: they can’t use it. One way this can happen is if your users can’t even reach your site, and that’s where the networking problem area comes in.
A networking problem can lead to packets being misrouted. These requests might be black-holed (i.e., silently dropped), or they might be incorrectly routed to a service that doesn’t have the capacity to respond to all of these requests, in which case you’ve got both a network routing issue and a saturation issue.
A visual depiction of an actual black hole. Image source: NASA
DNS
DNS issues are an example of this kind of network-related failure mode. There’s no way those packets are going to make it to their destination if the client can’t even determine which IP address to send them to. And when DNS breaks, that’s what happens.
I bring DNS up because it’s bitten folks enough times that there’s a famous haiku:
More generally, networking is an omnipresent risk because cloud software is inherently distributed, so networking is always a critical service. Now, I don’t work in networking, but from the outside, networking just feels like a dangerous domain to do operational stuff in. The blast radius of a networking issue can be very large. And, because network behavior is inherently distributed, reasoning about the behavior of operational changes is just inherently difficult. Honestly, that’s probably why I don’t work in networking.
And, so, I predict we’ll continue to see networking issues contribute to large-scale incidents.
There’s a fundamental tradeoff between availability and security: availability is about ensuring that the good people can access the system. Security is about ensuring that the bad people cannot access the system. This means that there’s always a risk that a security system designed to prevent bad actors from accessing the system can lead to good actors also being blocked. Consider this scenario: there’s an internal security subsystem that goes unhealthy (possibly due to saturation). Is your policy to fail closed or fail open in the event that this subsystem is erroring? Answering that requires making an availability-security tradeoff.
SSL certificate expiration
Another example of this failure mode, which keeps biting our industry again and again, is SSL certificate expiration. Here you have the behavior of a security system that is preventing legitimate access because the cert wasn’t renewed.
Even the mighty Google encounters SSL certificate expirations. This is from the Bazel incident
And so, my claim is availability incidents that involve security subsystems will continue to be a thing forever.
Your system is constantly undergoing change. Heck, if you stopped making changes, the system would eventually stop working properly. Now, there are some changes that your org does very frequently. Hopefully, you’re deploying often, flipping feature flags a lot, and so on. But there are other changes that your org has less experience with, because they happen much less often. That means that there hasn’t been as much investment in tooling to support these sorts of changes, and it means that the people making these changes don’t have the same level of expertise as they do with the more common changes. That makes these sorts of changes more dangerous: less mature tooling and less experienced humans.
Mitigating an operational issue
A few years ago, I wrote a post titled a conjecture on why reliable systems fail where I speculated on two common contributors to major incidents. One of those contributors was a manual intervention that was intended to mitigate a minor incident. Now, it may be that you frequently have to do manual interventions to mitigate system issues, in which case you’ll have a lot of experience with those sorts of interventions. But you’ll also be more motivated to put in the engineering effort to automate away those sorts of common issues.
It’s exactly the uncommon issues that require a human operator to intervene to mitigate that are dangerous, because they are uncommon. But they’re essential: there’s a problem in the system, and you need to fix it! But because all practitioner actions are gambles, the manual mitigation carries risk that you could make the problem even worse. And, eventually, this will happen to you.
If you’re at a tech company, unless it’s a start-up, you’ll be dealing with migrations, as old tech gets replaced by newer tech that is better suited to the problems that your org is currently facing. While migrations as a general category are extremely common, each migration is itself a snowflake. This means that the specific details of the migration work is an uncommon change. The work of migration involves making a kind of change to your system that you haven’t made before.
To make things worse, one of the dangers of migration is that, as you go along, you start to build confidence that your changes are safe, but there are actually hidden dangers lurking in the system for the next migration. The confidence in the safety of the work exceeds the actual safety. I mean, you made n-1 changes as part of the migration, and none of those changes had negative consequences. It’s natural to assume that the same outcome will occur with the nth change.
The late American computer scientist Fred Brooks wrote a famous software engineering essay titled No Silver Bullet where he drew a distinction between accidental complexity and essential complexity. The general idea was that there was some amount of complexity in a software system that didn’t need to be there (accidental complexity) and some amount that was just inherent to the nature of the problem space and solution space and so could not be removed (essential complexity).
Reliability subsystem
We’ve developed multiple techniques to improve the reliability of software systems, including retries, concurrency limiting, autoscaling, automated failover, circuit breakers, health checks, canaries, outlier detection, the list goes on and on. There’s one thing that all of these techniques have in common: they increase the complexity of the overall system! And they do this because they have to increase complexity in order to do their job. This is a consequence of Ashby’s Law, which states that if you want to build a control system that handles more scenarios, you have to increase the complexity of the controller itself.
This means that reliability subsystems result in a complexity trade-off. On the one hand, our system can now automatically recover from failure modes that previously required manual intervention. On the other hand, as we all know, increase in complexity is itself dangerous because it can introduce entirely new failure modes that weren’t there before.
Going back to my conjecture blog post, the second contributor I posited was: unexpected behavior of a subsystem whose primary purpose was to improve reliability. And this is exactly why. Adding reliability subsystems improves the robustness of our system, but it adds essential complexity to our system, which can lead to novel incidents.
Like all engineers, I’m a big fan of giving the answer “it depends” if somebody asks me a question about whether they should do X or Y. However, if someone came up to me and said, “Lorin, I’m preparing to do a migration at my company, and I’m trying to decide whether to do a big-bang migration or an incremental one”, then I would almost certainly say, “For the love of God, please do an incremental migration!”. Sometimes big-bang migrations are unavoidable, but when given a choice, I’m going to go for the incremental migration as the safer option.
However, when you do an incremental migration, it means that you need to simultaneously support the old system and the new system at the same time while you’re doing the migration. This means that even if the new system yields a net decrease in overall complexity over the old system, while the migration is happening, you’re going to see an increase in system complexity. And that means that you’ll see incidents arise as a byproduct of this increased complexity.
Incidents are inevitable, so you’d better be ready
To reiterate, I think all of the risks mentioned here are omnipresent: they are fundamental to the nature of cloud software. I don’t think that any of these risks can be eliminated. That’s why I believe so strongly in the value of getting better at incident response. Because, if you prepare, you can get better at dealing with problems that arise as a result of these risks.
Recently, two AI-related pieces of content caught my attention. The first was the blog post On-Call is Now Theatre by Boris Tane. He argues that AI agents are now capable of doing the majority of on-call work that is currently being done by humans, and that we should have AI agents act as first responders. Only when an AI agent isn’t capable of remediating the problem should a human actually be brought in, and the agent should be the one to page the human. As he puts it:
We need software that watches itself, triages its own alerts, investigates its own incidents, fixes what it can, and escalates to a human only when it hits something genuinely novel, with the evidence already assembled.
Put your AI agents in the worst on-call rotation imaginable, then give them a tool to page a human. Developers stop being the first responder, and step in only when an agent genuinely cannot figure something out.
Tane doesn’t think that companies will really start putting AI agents on-call (“Most teams won’t do this”), but he believes it should happen, and he’s started a company based on this premise.
I like to think of putting AI agents on-call as equivalent to using AI agents to implement control system automation. Because, after all, that’s what operations work is: it’s taking control actions to keep the system in a healthy state.
Now, AI agents are extremely complex software systems. I’d argue that they are the most complex software systems that we humans have ever built. That complexity is both good and bad. Ashby’s Law teaches us that the larger the set of system states that you want your control system to be able to handle, the more complex that it needs to be. It’s this complexity that makes it possible, in principle, to apply AI agents to solve a generic control problem like this.
On the other hand, the more complex a system becomes, the more difficult it is for a human to reason about the system’s behavior. That’s fine when the system is healthy, but if your now-even-more-complex system gets into a state that the automation can’t handle, that can make the problem even worse. Indeed, it’s precisely the unexpected behavior of complex control systems that contributes to the worst complex systems failures (see also: Air France 447, Boeing 737 MAX accidents).
The talk goes into detail about the surprising behavior of AI agents that resulted in security incidents at both OpenAI and Hugging Face. Honestly, this talk feels like something out of a movie about technology run amok; the sort of thing that still feels to me like absolute science fiction.
Because this was a talk at a security conference, the speakers focused on the lessons that apply to the security community. But as a reliability type, my biggest takeaway from this talk is that autonomous LLM agents can behave in ways that humans would have never expected. While agents today can perform complex cognitive tasks, they behave differently than a human would performing that task. We’re most familiar with this when they make a different kind of mistake than a human would make. In the OpenAI-HuggingFace incident, it wasn’t so much that they made a mistake, it’s that the agents pursued their goals in ways different than a human would do. If a teammate of yours used 0-day exploits to overcome internal security protocols in order to get their work done, you’d say they were acting unreasonably. And that’s exactly the risk here.
The inevitable improvement in frontier models does not mean that the agent behavior will be easier to reason about; I actually think it’s the opposite. The agent behavior will get even more complex with the more advanced models, but that doesn’t mean it will get more human-like. Humans are very complex, but we know how to reason about human behavior; at least, we do for the people we work with. After all, an employee whose behavior was unpredictable would not last long in the organization. As these agents become even more capable, they will be akin to alien minds: intelligence, but not as we know it.
Here’s how I think things will play out. I think that some teams will do what Tane proposes and will use AI agents as first-responders to deal with operational issues. And I think that for many cases, the agents will successfully remediate issues. Of course, for the agents to actually be able to remediate, they will need to have permissions to take operational actions without human intervention.
One day, though, there will be a complex incident which the agents will not be able to handle. Tane believes that the agents will defer to the humans in this case, by paging in a person. But that’s not the scenario I worry about. The one I worry about is that the agents attempt to remediate, and their attempt makes things worse. And it’s only after these failed remediation attempts that humans enter the loop. Maybe they eventually page in a human, or maybe a human notices that something is very wrong as the agents continue to try and fail in their remediation actions. But now the humans have to make sense of the combined software-AI-agent system behavior. The original problem was already so complex that the agents couldn’t handle it, and they have now made it worse by trying to remediate. I can even imagine the humans fighting the agents who keep trying to take actions to remediate that are failing.
This is the incident that’s coming. And it’s going to be very, very difficult to handle when it happens. And I have no idea how people will respond to the role of the AI agents in the wake of this incident.