You’ll never see attrition referenced in an RCA

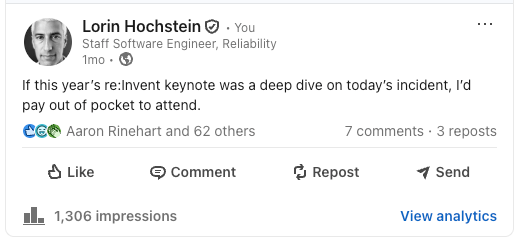
In the wake of the recent AWS us-east-1 outage, I saw speculation online about how the departure of experienced engineers played a role in the outage. The most notable one was from the acerbic cloud economist Corey Quinn, in a column he wrote for The Register: Amazon brain drain finally sent AWS down the spout. Amazon’s recent announcement that it will be laying off about 14,000 employees, which includes cuts to AWS, has added fuel to that fire, as I saw in a LinkedIn post by Java luminary and former AWS-er James Gosling that referenced another speculative column on the subject Amazon Just Proved AI Isn’t The Answer Yet Again. I’m not going to comment on the accuracy of these assessments, or more broadly the role that attrition played on this particular incident, because I don’t have any special knowledge here. Instead, I want to use this as an opportunity to talk about the relationship between attrition and incidents, and how that relationship is captured in incident write-ups, both public and internal.

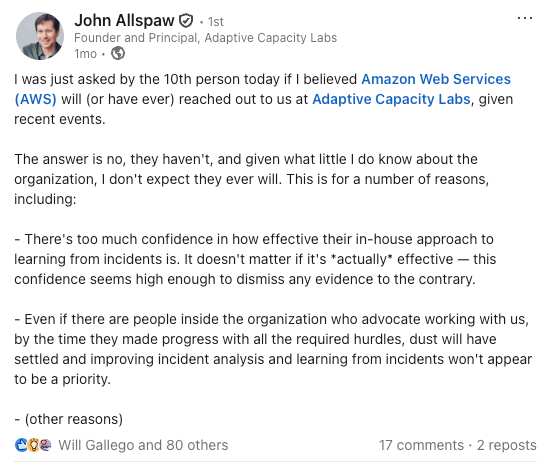
In a public incident write-up, or an RCA provided by a vendor to a customer, you’re never going to see any discussion of the role of attrition. This is because, as noted by John Allspaw in his post What makes public posts about incidents different from analysis write-ups, the purpose of a public write-up is to reassure the audience that the problem that caused the incident is being addressed. This means that the write-up will focus on describing a technical problem and alluding to the technical solution that is being addressed to fix the problem. Attrition isn’t a technical problem, it’s a completely different type of phenomenon. And, as we’ve seen with the recent Amazon layoff announcement, attrition is sometimes an explicit business decision. If a company like Amazon mentioned attrition in a public write-up, it would be much more difficult to answer a question like “how will your upcoming layoff increase the risk of incidents?” There’s no plausible deniability (“it won’t increase the risk of incidents”) if you’ve previously talked about attrition in a public write-up. Because talking about attrition doesn’t fulfill the confidence-building role of the write-up, it’s not going to ever find its way into a document intended for outsiders.

Internal incident write-ups serve a different purpose, and so they don’t have this problem. Indeed, in my own career, I have seen references to the departure of expertise in internal incident write-ups. The first example that comes to mind is the hot potato scenario where there’s a critical service where the original authors are no longer at the company, and the team that originally owned it no longer exists, and so another team becomes responsible for operating that service, even though they don’t have deep knowledge of how the service actually works, and it is so reliable that the team that now owns it doesn’t accumulate operational experience with it. I would wager that every tech company of a certain size has seen this pattern. I’ve also frequently heard discussion of bus factor, which is an explicit reference to attrition risk.

Still, while referencing attrition isn’t a taboo in an internal incident write-up the way it is in a public incident write-up, you’re still not likely to see the topic discussed there. Internal incident write-ups take a narrow view of system failures, focusing on technical details. I wrote a blog post several years ago titled What’s allowed to count as a cause?, and attrition is an example of an issue that falls squarely in the “not allowed to count” category.

Now, you might say, “Lorin, this is exactly why five whys is good, so we can zoom out to identify systemic issues.” My response would be, “attrition is never going to be the sole reason for a failure in a complex system, and identifying only attrition as a factor is just as bad as identifying a different factor and neglecting attrition, because you’re missing so much.” I think of the role of attrition as a contributor to incidents the way that smoking is a contributor to lung cancer, or that climate change is a contributor to severe weather events. It isn’t possible to attribute a particular incidence of lung cancer to smoking, or a particular severe storm to climate changes: smoking is neither necessary nor sufficient for lung cancer, and climate change is neither necessary nor sufficient for a particular storm to be severe. But as with attrition, smoking and climate changes are factors that increase risk. If you use a root cause analysis approach to understanding incidents, you’ll miss the role of contributing factors like attrition.

I would go so far to say that organizational factors play a role in every major incident, where attrition is just one example of an organizational factor. The fact that these don’t appear in the write-up says more about the questions that people didn’t ask than it does about the nature of the incident.

Quick thoughts on the recent AWS outage

AWS recently posted a public write-up of the us-east-1 incident that hit them this past Monday. Here are a couple of quick thoughts on it.

Reliability → Automation → Complexity → New failure modes

Our industry addresses reliability problems by adding automation so that the system can handle faults automatically. But here’s the thing: adding this sort of automation increases the complexity in the system. This increase in complexity due to more sophisticated automation brings two costs along with it. One cost is that the behavior of the system becomes more difficult to reason about. This is the “what is it currently doing, and why is it doing that?” problem that we operators face. The second cost of the increased complexity is that, while this automation eliminates a known class of failure modes, it simultaneously introduces a new class of failure modes. These new failure modes occur much less frequently than the class of failure modes that were eliminated, but when they do occur, they are potentially much more severe.

According to Amazon’s write-up, the triggering event was the unintentional deletion of DNS records related to the DynamoDB service due to a race condition. Even though DNS records were fully restored by 2:25 AM PDT, it wasn’t until 3:01 PM, over twelve and a half hours later, that Amazon declared that all AWS services had been fully restored.

There were multiple issues that complicated the restoration of different AWS services, but the one I want to call out here involved the Network Load Balancer (NLB) service. Delays in the propagation of network state information led to false health check failures: there were EC2 instances that were healthy, but that the NLB categorized as unhealthy because of the network state issue. From the report:

During the event the NLB health checking subsystem began to experience increased health check failures. This was caused by the health checking subsystem bringing new EC2 instances into service while the network state for those instances had not yet fully propagated. This meant that in some cases health checks would fail even though the underlying NLB node and backend targets were healthy. This resulted in health checks alternating between failing and healthy. This caused NLB nodes and backend targets to be removed from DNS, only to be returned to service when the next health check succeeded.

This pathological health check behavior led to availability zone DNS failovers, which reduced capacity and led to connection errors.

The alternating health check results increased the load on the health check subsystem, causing it to degrade, resulting in delays in health checks and triggering automatic AZ DNS failover to occur. For multi-AZ load balancers, this resulted in capacity being taken out of service. In this case, an application experienced increased connection errors if the remaining healthy capacity was insufficient to carry the application load.

Health checks are a classic example of an automation system that is designed to improve reliability. It’s not uncommon for an instance to go unhealthy for some reason, and being able to automatically detect when that happens and take the instance out of the load balancer means that your system can automatically handle failures in individual instances. But, as we see in this case, the presence of this reliability-improving automation made a particular problem (delay in network propagation state) even worse.

As a result of this incident, Amazon is going to change the behavior of the NLB logic in the case of health check failures.

For NLB, we are adding a velocity control mechanism to limit the capacity a single NLB can remove when health check failures cause AZ failover.

Note that this is yet another increase in automation complexity with the goal of improving reliability! That doesn’t mean that this is a bad corrective action, or that health checks are bad. Instead, my point here is that adding automation complexity to improve reliability always involves a trade-off. It’s very easy to forget about that trade-off if you focus only on the existing reliability problem you’re trying to tackle, and not even consider what new reliability problems you are introducing. Even if those new problems are rare, they can be extremely painful, as AWS can attest to.

I’ve written previously about failures due to reliability-improving automation. The other examples from my linked post are also from AWS incidents, but this phenomenon is in no way specific to AWS.

Surprise should not be surprising

Since this situation had no established operational recovery procedure, engineers took care in attempting to resolve the issue with [the DropletWorkflow Manager] without causing further issues.

The Amazon engineers didn’t have a runbook to handle this failure scenario, which meant that they had to improvise a recovery strategy during incident response. This is a recurring theme in large-scale incidents: they involve failures that nobody had previously anticipated. The only thing we can really predict about future high-severity incidents is that they are going to surprise us. We are going to keep encountering failure modes we never anticipated, over and over again.

It’s tempting to focus your reliability engineering resources on reducing the risk of known failure modes. But if you only prepare for the failure scenarios that you can think of, then you aren’t putting yourself in a better position to deal with the inevitable situation that you never imagined would ever happen. And the fact that you’re investing in reliability-improving-but-complexity-increasing automation means that you are planting the seeds of those future surprising failure modes.

This means that if you want to improve reliability, you need to invest in both the complexity-increasing reliability automation (robustness), and also in the capacity to be able to better deal with future surprises (resilience). The resilience engineering researcher David Woods uses the term net adaptive value to describe the ability of a system to deal with both predicted failure modes, and to adapt to effectively unpredicted failure modes.

Part of investing in resilience means building human-controllable leverage points so that engineers have a broad range of mitigation actions available to them during future incidents. That could mean having additional capacity on hand that you can throw at the problem, as well as having built in various knobs and switches. As an example from this AWS incident, part of the engineers’ response was to manually disable the health check behavior.

At 9:36 AM, engineers disabled automatic health check failovers for NLB, allowing all available healthy NLB nodes and backend targets to be brought back into service. This resolved the increased connection errors to affected load balancers.

But having these sorts of knobs available isn’t enough. You need your responders to have the operational expertise necessary to know when to use it. More generally, if you want to get better at dealing with unforeseen failure mode, you need to invest in improving operational expertise, so that your incident responders are best positioned to make sense of the system behavior when faced with a completely novel situation.

The AWS write-up focuses on the robustness improvements, the work they are going to do to be better prepared to prevent a similar failure mode from happening in the future. But I can confidently predict that the next large-scale AWS outage is going to look very different from this one (although it will probably involve us-east-1). It’s not clear to me from the write-up that Amazon has learned the lesson of how it important is to prepare to be surprised.

Caveat promptor

In the wake of a major incident, you’ll occasionally hear a leader admonish the engineering organization that we need to be more careful in the future in order to prevent such incidents from happening in the future. Ultimately, these sorts of admonishments don’t help improve reliability, because they miss an essential truth about the nature of work in organizations.

One of the big ideas from resilience engineering is the efficiency-thoroughness trade-off, also known as the ETTO Principle. The ETTO principle was first articulated by Erik Hollnagel, one of the founders of the field. The idea is that there’s a fundamental trade-off between how quickly we can complete tasks, and how thorough we can be when working on each individual task. Let’s consider the work of doing software development using AI agents through the lens of the ETTO principle.

Coding agents like Claude Code and OpenAI are capable of automatically generating significant amounts of code. Honestly, it’s astonishing what these tools are capable of today. But like all LLMs, while they will always generate plausiblelooking output, they do not always generate correct output. This means that a human needs to check an AI agent’s work to ensure that it’s generating code that’s up to snuff: a human has to review the code generated by the agent.

Screenshot of asking Claude about coding mistakes. Note the permanent warning at the bottom.

As any human software engineer will tell you, reviewing code is hard. It takes effort to understand code that you didn’t write. And larger changes are harder to review, which means that the more work that the agent does, the more work the human in the loop has to do to verify it.

If the code compiles and runs and all tests pass, how much time should the human spend on reviewing it? The ETTO principle tells us there’s a trade-off here: the incentives push software engineers towards completing our development tasks more quickly, which is why we’re all adopting AI in the first place. After all, if it ends up taking just as long to review the AI-generated code as it would have for the human reviewer to write it from scratch, then that defeats the purpose of automating the development task to begin with.

Maybe at first we’re skeptical and we spend more time reviewing the agent code. But, as we get better at working with the agents, and as the AI models themselves get better over time, we’ll figure out where the trouble spots of AI-generated code tend to pop up, and we’ll focus our code review effort accordingly. In essence, we’re riding the ETTO trade-off curve by figuring out how much review effort we should be putting in to and where that effort should go.

Eventually, though, a problem with AI-generated code will slip through this human review process and will contribute to an incident. In the wake of this incident, the software engineers will be reminded that AI agents can make mistakes, and that they need to carefully review the generated code. But, as always, such reminders will do nothing to improve reliability. Because, while AI agents change way that software developers work, they don’t eliminate the efficiency-thoroughness trade-off.

Fixation: the ever-present risk during incident handling

Recent U.S. headlines have been dominated by school shootings. The bulk of the stories have been about the assassination of Charlie Kirk on the campus of Utah Valley University and the corresponding political fallout. On the same day, there was also a shooting at Evergreen High School in Colorado, where a student shot and injured two of his peers. This post isn’t about those school shootings, but rather, one that happened three years ago. On May 24, 2022, at Robb Elementary School in Uvalde, Texas, 19 students and 2 teachers were killed by a shooter who managed to make his way onto the campus.

Law enforcement were excoriated for how they responded to the Uvalde shooting incident: several were fired, and two were indicted on charges of child endangerment. On January 18, 2024, the Department of Justice released the report on their investigation of the shooting:  Critical Incident Review: Active Shooter at Robb Elementary School. According to the report, there were multiple things that went wrong during the incident. Most significantly, the police originally believed that the shooter had barricaded himself in an empty classroom, where in fact shooter was in a classroom with students. There were also communication issues that resulted in a common ground breakdown during the response. But what I want to talk about in this post is the keys.

The search for the keys

During the response to the Uvalde shooting, there was significant effort by the police on the scene to locate master keys to unlock rooms 111/112 (numbered p14, PDF p48, emphasis mine).

Phase III of the timeline begins at 12:22 p.m., immediately following four shots fired inside classrooms 111 and 112, and continues through the entry and ensuing gunfight at 12:49 p.m. During this time frame, officers on the north side of the hallway approach the classroom doors and stop short, presuming the doors are locked and that master keys are necessary.

The search for keys started before this, because room 109 was locked, and had children in it, and the police wanted to evacuate those children (numbered p 13, PDF p48):

By approximately 12:09 p.m., all classrooms in the hallways have been evacuated and/or cleared except rooms 111/112, where the subject is, and room 109. Room 109 is found to be locked and believed to have children inside.

If you look at the Minute-by-Minute timeline section of the report (numbered p17, PDF p50) you’ll see the text “Events: Search for Keys” appear starting at 12:12 PM, all of the way until 12:45 PM.

The irony here is that the door to room 111/112 may have never been locked to begin with, as suggested by the following quote (numbered p15, PDF p48), emphasis mine:

At around 12:48 p.m., the entry team enters the room. Though the entry team puts the key in the door, turns the key, and opens it, pulling the door toward them, the [Critical Incident Review] Team concludes that the door is likely already unlocked, as the shooter gained entry through the door and it is unlikely that he locked it thereafter.

Ultimately, the report explicitly calls out how the search for the keys led to delays in response (numbered p xxviii, PDF p30):

Law enforcement arriving on scene searched for keys to open interior doors for more than 40 minutes. This was partly the cause of the significant delay in entering to eliminate the threat and stop the killing and dying inside classrooms 111 and 112. (Observation 10)

Fixation

In hindsight, we can see that the responders got something very important wrong in the moment: they were searching for keys for a door that probably wasn’t even locked. In this specific case, there appears to have been some communicated-related confusion about the status of the door, as shown by the following (numbered p53, PDF p86):

The BORTAC [U.S. Border Patrol Tactical Unit] commander is on the phone, while simultaneously asking officers in the hallway about the status of the door to classrooms 111/112. UPD Sgt. 2 responds that they do not know if the door is locked. The BORTAC commander seems to hear that the door is locked, as they say on the phone, “They’re saying the door is locked.” UPD Sgt. 2 repeats that they do not know the status of the door.

More generally, this sort of problem is always going to happen during incidents: we are forever going to come to conclusions during an incident about what’s happening that turn out to be wrong in hindsight. We simply can’t avoid that, no matter how hard we try.

The problem I want to focus on here is not the unavoidable getting it wrong in the moment, but the actually-preventable problem of fixation. We “fixate” when we focus solely on one specific aspect of the situation. The problem here is not searching for keys, but on searching for keys to the exclusion of other activities.

During complex incidents, the underlying problem is frequently not well understood, and so the success of a proposed mitigation strategy is almost never guaranteed. Maybe a rollback will fix things, but maybe it won’t! The way to overcome this problem is to pursue multiple strategies in parallel. One person or group focuses on rolling back a deployment that aligns in time, another looks for other types of changes that occurred around the same time, yet another investigates the logs, another looks into scaling up the amount of memory, someone else investigates traffic pattern changes, and so on. By pursuing multiple diagnostic and mitigation strategies in parallel, we reduce the risk of delaying the mitigation of the incident by blocking on the investigation of one avenue that may turn out to not be fruitful.

Doing this well requires diversity of perspectives and effective coordination. You’re more likely to come up with a broader set of options to pursue if your responders have a broader range of experiences. And the more avenues that you pursue, the more the coordination overhead increases, as you now need to keep the responders up to date about what’s going on in the different threads without overwhelming them with details.

Fixation is a pernicious risk because we’re more likely to fixate when we’re under stress. Since incidents are stressful by nature, they are effectively incubators of fixation. In the heat of the moment, it’s hard to take a breath, step back for a moment, understand what’s been tried already, and calmly ask about what the different possible options are. But the alternative is to tumble down the rabbit hole, searching for keys to a door that is already unlocked.

The hidden trade-offs of fine-grained progressive rollouts

A progressive rollout refers to the act of rolling out some new functionality gradually rather than all at once. This means that, when you initially deploy it, the change only impacts a fraction of your users. The idea behind a progressive rollout is to reduce the risk of a deployment by reducing the blast radius: if something goes wrong with the new thing during deployment, then the impact is much smaller than if you had deployed it all-at-once, to all of the traffic.

The impact of a bad rollout is shown in red

There are two general strategies for doing a progressive rollout. One strategy is coarse grained, where you stage your deploys across domains. For example, deploying the new functionality to one geographic region at a time. The second strategy is more fine-grained, where you define a ramp up schedule (e.g., 1% of traffic to the new thing, then 5%, then 10%, etc.).

Note that the two strategies aren’t mutually exclusive: you can stage your deploy across regions, and within each region, you can do a fine-grained ramp-up within each regions. And you can also think of it as a spectrum rather than two separate categories, since you can control the granularity. But I make the distinction here because I want to talk specifically about the fine-grained approach, where we use a ramp.

The ramp is clearly superior if you’re able to detect a problem during deployment, as shown in the diagram above. It’s a real win if you have automation that can automatically detect based on a metric like error rate. The problem with the ramp is the scenario when you don’t detect that there’s a problem with the deployment.

My claim here in this post is that if you don’t detect a problem with a fine-grained progressive rollout until after the rollout has completed, then it will tend to take you longer to diagnose what the problem is:

Paradoxically, progressive rollout can increase the blast radius by making after-the-fact diagnosis harder

Here’s my argument: once you know something is wrong with your system, but you don’t know what it is that has gone wrong, one of the things you’ll do is to look at dashboard graphs to look for a signal that identifies when the problem started, such as an increase in error rate or request latency. When you do a fine-grained progressive rollout, if something has gone wrong, then the impact will get smeared out over time, and it will be harder to identify the rollout as the relevant change by looking at a dashboard. If you’re lucky, your observability tools will let you slice on the rollout dimension. This is why I like coarse-grained rollouts, because if you have explicit deployment domains like geographical regions, then your observability tools will almost certainly let you slice the data based on those. Heck, you should have existing dashboards that already slice on it. But for fine-grained rolled-out, you may not think to slice on a particular rollout dimension (especially if you’re rolling out a bunch of things at once, all of them doing fine-grained deployments), and you might not even be able to.

To determine whether fine-grained rollouts are a net win depends on a number of factors whose values are not obvious, including:

  • the probability you detect a problem during the rollout vs after the rollout
  • how much longer it takes to diagnose the problem if not caught during rollout
  • your cost model for an incident

On the third bullet: the above diagram implicitly assumes that impact to the business is linear with respect to time. However, it might be non-linear: an hour-long incident may turn out to be more than twice as expensive as two half-hour-long incidents.

As someone who works in the reliability space, I’m acutely aware of the pain of incidents that take a long time to mitigate because they are difficult to diagnose. But I think that the trade-off of fine-grained progressive rollouts are generally not recognized as such: it’s easy to imagine the benefits when the problems are caught earlier, it’s harder to imagine the scenarios where the problem isn’t caught until later, and how harder things get because of it.

Nothing fails like a history of success

The Axiom of Experience: the future will be like the past, because, in the past, the future was like the past. – Gerald M. Weinberg, An Introduction to General Systems Thinking

Last Friday, the San Francisco Bay Area Rapid Transit system (known as BART) experienced a multiple hour outage. Later that day, the BART Deputy General Manager released a memo about the outage with some technical details. The memo is brief, but I was honestly surprised to see this amount of detail in a public document that was released so quickly after an incident, especially from a public agency. What I want to focus on in this post is this line (emphasis mine):

Specifically, network engineers were performing a cutover to a new network switch at
Montgomery St. Station… The team had already successfully performed eight similar cutovers earlier this year.

This reminded me of something I read in the Buildkite writeup from an incident that happened back in January of this year (emphasis mine):

Given the confidence gained by initial load testing and the migrations already performed over the past year, we wanted to allow customers to take advantage of their seasonal low periods to perform shard migrations, as a win-win. This caused us to discount the risk of performing migrations during a seasonal low period and what impacts might emerge when regular peak traffic returned.

It also reminded me about the 2022 Rogers Telecommunications outage in Canada (emphasis mine, [redacted] comments in the original):

Rogers had assessed the risk for the initial change of this seven-phased process as “High”. Subsequent changes in the series were listed as “Medium.” [redacted] was “Low” risk based on the Rogers algorithm that weighs prior success into the risk assessment value. Thus, the risk value for [redacted] was reduced to “Low” based on successful completion of prior changes.

Whenever we make any sort of operational change, we have a mental model of the risk associated with the change. We view novel changes (I’ve never done something like this before!) as riskier than changes we’ve performed successfully multiple times in the past (I’ve done this plenty of times). I don’t think this sort of thinking is a fallacy: rather, it’s a heuristic, and it’s generally a pretty effective one! But, like all heuristics, it isn’t perfect. As shown in the examples above, the application of this heuristic can result in a miscalibrated mental model of the risk associated with a change.

So, what’s the broader lesson? In practice, our risk models (implicit or otherwise) are always miscalibrated: a history of past successes is just one of multiple avenues that can lead us astray. Trying to achieve a perfect risk model is like trying to deploy software that is guaranteed to have zero bugs: it’s never going to happen. Instead, we need to accept the reality that, like our code, our models of risk will always have defects that are hidden from us until it’s too late. So we’d better get damned good at recovery.

“What went well” is more than just a pat on the back

When writing up my impressions of the GCP incident report, Cindy Sridharan’s tweet reminded me that I failed to comment on an important part of it, how the responders brought the overloaded system back to a healthy state.

Which brings me to the topic of this post: the “what went well” section of an incident write-up. Generally, public incident write-ups don’t have such sections. This is almost certainly for rational political reasons: it would be, well, gauche to recount to your angry customers about what a great job you did handling the incident. However, internal write-ups often have such sections, and that’s my focus here.

In my experience, “What went well” is typically the shortest section in the entire incident report, with a few brief bullet points that point out some positive aspects of the response (e.g., people responded quickly). It’s a sort of way-to-go!, a way to express some positive feedback to the responders on a job well done. This is understandable, as people believe that if we focus more on what went wrong than what went well, then we are more likely to improve the system, because we are focusing on repairing problems. This is why “what went wrong” and “what can we do to fix it” takes the lion’s share of the attention.

But the problem with this perspective is that it misunderstands the skills that are brought to bear during incident response, and how learning from a previously well-handled incident can actually help other responders do better in future incidents. Effective incident response happens because the responders are skilled. But every incident response team is an ad-hoc one, and just because you happened to have people with the right set of skills responding last time, doesn’t mean you’ll have the people with the right set the next time. This means that if you gloss over what went well, your next incident might be even worse than the last one, because you’ve described those future responders of the opportunity to learn from observing the skilled responders last time.

To make this more concrete, let’s look back at that the GCP incident report. In this scenario, the engineers had put in a red-button as a safety precaution and exercised it to remediate the audience.

As a safety precaution, this code change came with a red-button to turn off that particular policy serving path… Within 2 minutes, our Site Reliability Engineering team was triaging the incident. Within 10 minutes, the root cause was identified and the red-button (to disable the serving path) was being put in place. 

However, that’s not the part that interests me so much. Instead, it’s the part about how the infrastructure became overloaded as a consequence of the remediation, and how the responders recovered from overload.

Within some of our larger regions, such as us-central-1, as Service Control tasks restarted, it created a herd effect on the underlying infrastructure it depends on (i.e. that Spanner table), overloading the infrastructure…. It took up to ~2h 40 mins to fully resolve in us-central-1 as we throttled task creation to minimize the impact on the underlying infrastructure and routed traffic to multi-regional databases to reduce the load.

This was not a failure scenario that they had explicitly designed for in advance of deploying the change: there was no red-button they could simply exercise to roll back the system to a non-overloaded state. Instead, they were forced to improvise a solution based on the controls that were available to them. In this case, they were able to reduce the load by turning down the rate of task creation, as well as by re-routing traffic away from the overloaded database.

And this sort of work is the really interesting bit an incident: how skilled responders are able to take advantage of generic functionality that is available in order to remediate an unexpected failure mode. This is one of the topics that the field of resilience engineering focuses on, how incident responders are able to leverage generic capabilities during a crunch. If I was an engineer at Google in this org, I would be very interested to learn what knobs are available and how to twist them. Describing this in detail in an incident write-up will increase my chances of being able to leverage this knowledge later. Heck, even just leaving bread crumbs in the doc will help, because I’ll remember the incident, look up the write-up, and follow the links.

Another enormously useful “what went well” aspect that often gets short shrift is a description of the diagnostic work: how the responders figured out what was going on. This never shows up in public incident write-ups, because the information is too proprietary, so I don’t blame Google for not writing about how the responders determined the source of the overload. But all too often these details are left out of the internal write-ups as well. This sort of diagnostic work is a crucial set of skills for incident response, and having the opportunity to read about how experts applied their skills to solve this problem help transfers these skills across the organization.

Here’s my claim: providing details on how things went well will reduce your future mitigation time even more than focusing on what went wrong. While every incident is different, the generic skills are common, and so getting better at response will get you more mileage than preventing repeats of previous incidents. You’re going to keep having incidents over and over. The best way to get better at incident handling is to handle more incidents yourself. The second best way is to watch experts handle incidents. The better you do at telling the stories of how your incidents were handled, the more people will learn about how to handle incidents.

Quick takes on the GCP public incident write-up

On Thursday (2025-06-12), Google Cloud Platform (GCP) had an incident that impacted dozens of their services, in all of their regions. They’ve already released an incident report (go read it!), and here are my thoughts and questions as I read it.

Note that the questions I have shouldn’t be explicitly seen as a critique as of the write-up, as the answers to the questions generally aren’t publicly shareable. They’re more in the “I wish I could be a fly on the wall inside of Google” questions.

Quick write-up

First, a meta-point: this is a very quick turnaround for a public incident write-up. As a consumer of these, I of course appreciate getting it faster, and I’m sure there was enormous pressure inside of the company to get a public write-up published as soon as possible. But I also think there are hard limits on how much you can actually learn about an incident when you’re on the clock like this. I assume that Google is continuing to investigate internally how the incident happened, and I hope that they publish another report several weeks from now with any additional details that they are able to share publicly.

Staging land mines across regions

Note that impact (June 12) happened two weeks after deployment (May 29).

This code change and binary release went through our region by region rollout, but the code path that failed was never exercised during this rollout due to needing a policy change that would trigger the code.

The system involved is called Service Control. Google stages their deploys of Service Control by region, which is a good thing: staging your changes is a way of reducing the blast radius if there’s a problem with the code. However, in this case, the problematic code path was not exercised during the regional rollout. Everything looked good in the first region, and so they deployed to the next region, and so on.

This the land mine risk: when the code you are rolling out contains a land mine which is not tripped during the rollout.

How did the decisions make sense at the time?

I have no information about how this incident came to be but I can confidently predict that people will blame it on greedy execs and sloppy devs, regardless of what the actual details are. And they will therefore learn nothing from the details.

Lorin Hochstein (@norootcause.surfingcomplexity.com) 2024-07-19T19:17:47.843Z

The issue with this change was that it did not have appropriate error handling nor was it feature flag protected. Without the appropriate error handling, the null pointer caused the binary to crash.

This is the typical “we didn’t do X in this case and had we done X, this incident wouldn’t have happened, or wouldn’t have been as bad” sort of analysis that is very common in these write-ups. The problem with this is that it implies sloppiness on the part of the engineers, that important work was simply overlooked. We don’t have any sense on how the development decisions made sense at the time.

If this scenario was atypical (i.e., usually error handling and feature flags are added), what was different about this development case? We don’t have the context about what was going on during development, which means we (as external readers) can’t understand how this incident actually was enabled.

Feature flags are used to gradually enable the feature region by region per project, starting with internal projects, to enable us to catch issues. If this had been flag protected, the issue would have been caught in staging.

How do they know it would have been caught in staging, if it didn’t manifest in production until two weeks after roll-out? Are they saying that adding a feature flag would have led to manual testing of the problematic code path in staging? Here I just don’t know enough about Google’s development processes to make sense of this observation.

Service Control did not have the appropriate randomized exponential backoff implemented to avoid [overloading the infrastructure].

As I discuss later, I’d wager it’s difficult to test for this in general, because the system generally doesn’t run in the mode that would exercise this. But I don’t have the context, so it’s just a guess. What’s the history behind Service Control’s backoff behavior? By definition, Without knowing its history, we can’t really understand how its backoff implementation came to be this way.

Red buttons and feature flags

As a safety precaution, this code change came with a red-button to turn off that particular policy serving path. The issue with this change was that it did not have appropriate error handling nor was it feature flag protected. (emphasis added)

Because I’m unfamiliar with Google’s internals, I don’t understand how their “red button” system works. In my experience, the “red button” type functionality is built on top of feature flag functionality, but that does not seem to be the case at Google, since here there was no feature flag, but there was a big red button.

It’s also interesting to me that, while this feature wasn’t feature-flagged it was big-red-buttoned. There’s a story here! But I don’t know what it is.

New feature: additional policy quota checks

On May 29, 2025, a new feature was added to Service Control for additional quota policy checks… On June 12, 2025 at ~10:45am PDT, a policy change was inserted into the regional Spanner tables that Service Control uses for policies.

I have so many questions.. What were these additional quota policy checks? What was the motivation for adding these checks (i.e., what problem are the new checks addressing)? Is this customer-facing functionality (e.g., GCP Cloud Quotas), or is this an internal-only? What was the purpose of the policy change that was inserted on June 12 (or was it submitted by a customer)? Did that policy change take advantage of the new Service Control features that were added on May 29? Was that the first policy change that happened since the new feature was deployed, or had there been others? How frequently do policy changes happen?

Global data changes

Code changes are scary, config changes are scarier, and data changes are the scariest of them all.

Lorin Hochstein (@norootcause.surfingcomplexity.com) 2025-06-14T19:32:32.669Z

Given the global nature of quota management, this metadata was replicated globally within seconds.

While code and feature flag changes are staged across regions, apparently quota management metadata is designed to replicate globally.

Regardless of the business need for near instantaneous consistency of the data globally (i.e. quota management settings are global), data replication needs to be propagated incrementally with sufficient time to validate and detect issues. (emphasis mine)

The implication I take from from the text was that there was a business requirement for quota management data changes to happen globally rather than staged, and that they are now going to push back on that.

What was the rationale for this business requirement? What are the tradeoffs involved in staging these changes versus having them happen globally? What new problems might arise when data changes are staged like this?

Are we going to be reading a GCP incident report in a few years that resulted from inconsistency of this data across regions due to this change?

Saturation!

From an operational perspective, I remain terrified of databases

Lorin Hochstein (@norootcause.surfingcomplexity.com) 2025-06-13T17:21:16.810Z

Within some of our larger regions, such as us-central-1, as Service Control tasks restarted, it created a herd effect on the underlying infrastructure it depends on (i.e. that Spanner table), overloading the infrastructure.

Here we have a classic example of saturation, where a database got overloaded. Note that saturation wasn’t the trigger here, but it made recovery more difficult. Our system is in a different mode during incident recovery than it is during normal mode, and it’s generally very difficult to test for how it will behave when it’s in recovery mode.

Does this incident match my conjecture?

I have a long-standing conjecture that once a system reaches a certain level of reliability, most major incidents will involve:

  • A manual intervention that was intended to mitigate a minor incident, or
  • Unexpected behavior of a subsystem whose primary purpose was to improve reliability

I don’t have enough information in this write-up to be able to make a judgment in this case: it depends on whether or not the quota management system’s purpose is to improve reliability. I can imagine it going either way. If it’s a public-facing system to help customers limit their costs, then that’s more of a traditional feature. On the other hand, if it’s to limit the blast radius of individual user activity, then that feels like a reliability improvement system.

What are the tradeoffs of the corrective actions?

The write-up lists seven bullets of corrective actions. The questions I always have of corrective actions are:

  • What are the tradeoffs involved in implementing these corrective actions?
  • How might they enable new failure modes or make future incidents more difficult to deal with?

The same incident never happens twice, but the patterns recur over and over

“No man ever steps in the same river twice. For it’s not the same river and he’s not the same man” – attributed to Heraclitus

After an incident happens, many people within the organization are worried about the same incident happening again. In one sense, the same incident can never really happen again, because the organization has changed since the incident has happened. Incident responders will almost certainly be more effective at dealing with a failure mode they’ve encountered recently than one they’re hitting for the first time.

In fairness, if the database falls over again, saying, “well, actually, it’s not the same incident as last time because we now have experience with the database falling over so we were able to recover more quickly” isn’t very reassuring to the organization. People are worried that there’s an imminent risk that remains unaddressed, and saying “it’s not the same incident as last time” doesn’t alleviate the concern that the risk has not been dealt with.

But I think that people tend to look at the wrong level of abstraction when they talk about addressing risks that were revealed by the last incident. They suffer from what I’ll call no-more-snow-goon-ism:

Calvin is focused on ensuring the last incident doesn’t happen again

Saturation is an example of a higher-level pattern that I never hear people talk about when focusing on eliminating incident recurrence. I will assert that saturation is an extremely common pattern in incidents: I’ve brought it up when writing about public incident writeups at Canva, Slack, OpenAI, Cloudflare, Uber, and Rogers. The reason you won’t hear people discuss saturation is because they are generally too focused on the specific saturation details of the last incident. But because there are so many resources you can run out of, there are many different possible saturation failure modes. You can exhaust CPU, memory, disk, threadpools, bandwidth, you can hit rate limits, you can even breach limits that you didn’t know existed and that aren’t exposed as metrics. It’s amazing how much different stuff there is that you can run out of.

My personal favorite pattern is unexpected behavior of a subsystem whose primary purpose was to improve reliability, and it’s one of the reasons I’m so bear-ish about the emphasis on corrective actions in incident reviews, but there are many other patterns you can identify. If you hit an expired certificate, you may think of “expired certificate” as the problem, but time-based behavior change is a more general pattern for that failure mode. And, of course, there’s the ever-present production pressure.

If you focus too narrowly on preventing the specific details of the last incident, you’ll fail to identify the more general patterns that will enable your future incidents. Under this narrow lens, all of your incidents will look like either recurrences of previous incidents (“the database fell over again!”) or will look like a completely novel and unrelated failure mode (“we hit an invisible rate limit with a vendor service!”). Without seeing the higher level patterns, you won’t understand how those very different looking incidents are actually more similar than you think.

Labeling a root cause is predicting the future, poorly

Why do we retrospect on our incidents? Why spend the time doing those write-ups and holding review meetings? We don’t do this work as some sort of intellectual exercise for amusement. Rather, we believe that if we spend the time to understand how the incident happened, we can use that insight to improve the system in general, and availability in particular. We improve availability by preventing incidents as well as reducing the impact of incidents that we are unable to prevent. This post-incident work should help us do both.

The typical approach to post-incident work is to do a root cause analysis (RCA). The idea of an RCA is to go beyond the surface-level symptoms to identify and address the underlying problems revealed by the incident. After all, it’s only by getting at the root at the problem that we will be able to permanently address it. When doing an RCA, when we attach the label root cause to something, we’re making a specific claim. That claim is: we should focus our attention on the issues that we’ve labeled “root cause”, because spending our time addressing these root causes will yield the largest improvements to future availability. Sure, it may be that there were a number of different factors involved in the incident, but we should focus on the root cause (or, sometimes, a small number of root causes), because those are the ones that really matter. Sure, the fact that Joe happened to be on PTO that day, and he’s normally the one that spots these sorts of these problems early, that’s interesting, but it isn’t the real root cause.

Remember that an RCA, like all post-incident work, is supposed to be about improving future outcomes. As a consequence, a claim about root cause is really a prediction about future incidents. It says that of all of the contributing factors to an incident, we are able to predict which factor is most likely to lead to an incident in the future. That’s quite a claim to make!

Here’s the thing, though. As our history of incidents teaches us over and over again, we aren’t able to predict how future incidents will happen. Sure, we can always tell a compelling story of why an incident happened, through the benefit of hindsight. But that somehow never translates into predictive power: we’re never able to tell a story about the next incident the way we can about the last one. After all, if we were as good at prediction as we are at hindsight, we wouldn’t have had that incident in the first place!

A good incident retrospective can reveal a surprisingly large number of different factors that contributed to the incident, providing signals for many different kinds of risks. So here’s my claim: there’s no way to know which of those factors is going to bite you next. You simply don’t possess a priori knowledge about which factors you should pay more attention to at the time of the incident retrospective, no matter what the vibes tell you. Zeroing in on a small number of factors will blind you to the role that the other factors might play in future incidents. Today’s “X wasn’t the root cause of incident A” could easily be tomorrow’s “X was the root cause of incident B”. Since you can’t predict which factors will play the most significant roles in future incidents, it’s best to cast as wide a net as possible. The more you identify, the more context you’ll have about the possible risks. Heck, maybe something that only played a minor role in this incident will be the trigger in the next one! There’s no way to know.

Even if you’re convinced that you can identify the real root cause of the last incident, it doesn’t actually matter. The last incident already happened, there’s no way to prevent it. What’s important is not the last incident, but the next one: we’re looking at the past only as a guide to help us improve in the future. And while I think incidents are inherently unpredictable, here’s a prediction I’m comfortable making: your next incident is going to be a surprise, just like your last one was, and the one before that. Don’t fool yourself into thinking otherwise.