
The other day, I wrote about a GitHub Actions incident. But GitHub Actions isn’t the only CI-as-a-service out there. Buildkite, which is another CI company, recently released a public write-up of an incident they experienced last week. It’s a great one: their incident report contains a lot more detail than GitHub’s. Here I’ll discuss my own observations.
The failure mode
The write-up describes what I found to be a fascinating failure mode. Here I’m going to do my best to explain it in my own words.
A bit about Kubernetes
First, some Kubernetes terminology to get us all on the same page. When you’re using Kubernetes to run your services and jobs, we say that you are running on a Kubernetes cluster. A cluster is made up of multiple nodes. If you’re running on EKS (Amazon’s Kubernetes offering), I believe those nodes are going to be EC2 instances.
Each node exists to run pods, which are the compute workloads that you run on Kubernetes. If you’ve been a service owner for a service that runs on Kubernetes, then you’re almost certainly familiar with the notion of pods, because that’s what’s exposed to you. But, unless you’ve worked in infrastructure, you’re likely not familiar with nodes and clusters, because those implementation details are deliberately hidden from the service owners.
Here’s a diagram that shows a four-node Kubernetes cluster. Each black rectangle depicts a pod that is running within that node. A pod is a set of containers that all get scheduled together (typically an application container and related sidecars), but that particular detail isn’t relevant here.
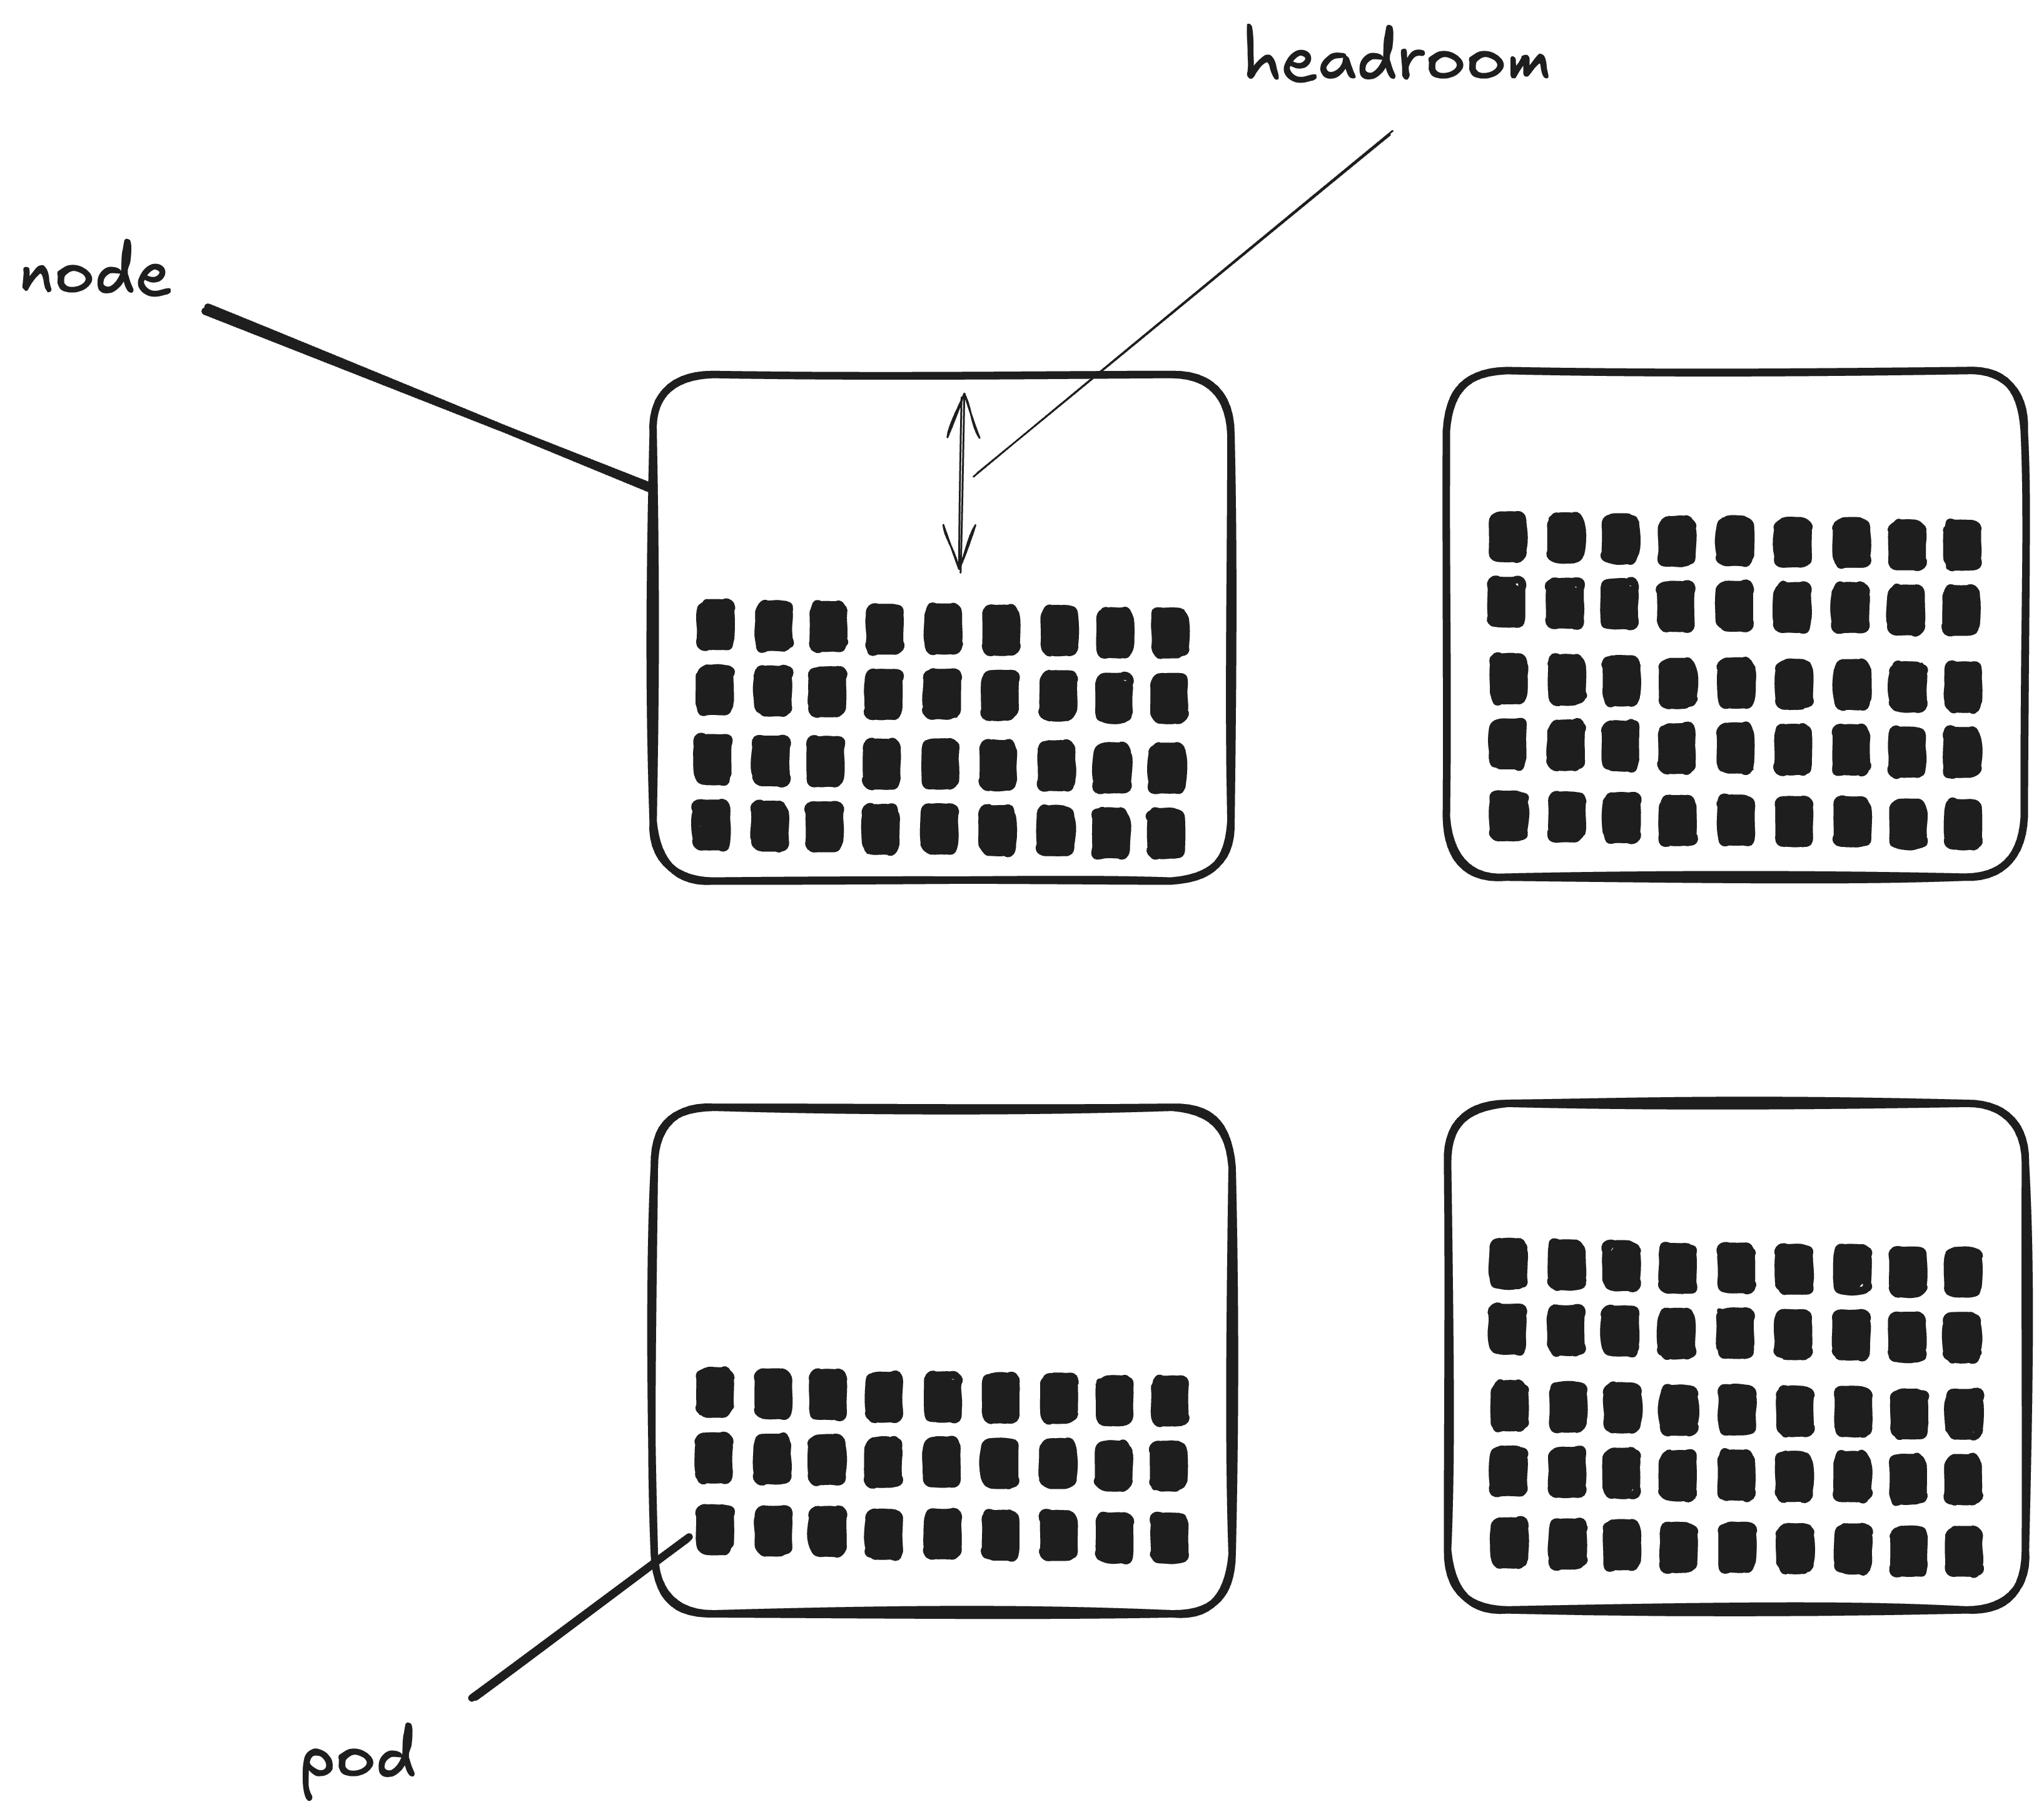
I’ve also labeled the blank part of one of the nodes as headroom. That’s not explicitly a Kubernetes concept. Rather, it’s a general term that here means “the amount of additional compute jobs that could still be run on this node.”
A few brief words on autoscaling
Let’s take the service owner’s perspective again. You own a service that runs on Kubernetes. That service is deployed as a group of pods, what Kubernetes calls a replicaset. Note that each pod is identical, so the only reason to have multiple pods is because you need additional compute resources. The amount of compute resources that your service needs can vary over time. For example, if you’re driven by requests, then the volume of requests can vary. Or, if your service consumes from a job queue, the number of pending jobs can vary at any one time.
Kubernetes deals with workloads whose resource needs vary with time by supporting autoscaling. The system I’m most familiar with is the HorizontalPodAutoscaler, which will increase or decrease the number of size of a replicaset depending on the load.
A brief sidebar about scaling terminology. There’s a distinction between horizontal scaling and vertical scaling. If you’re adding more servers, you’re horizontally scaling, whereas if you’re increasing the size of your servers, you’re vertically scaling. Technically, it’s more accurate to use the term scale out to refer to horizontal scaling, and scale up to refer to vertical scaling. and, indeed, the Buildkite write-up uses scale out. But I’m used to saying scale up for horizontal scaling as well, because that’s the kind of scaling I deal with more often. In this post, I use scale up and scale out interchangeably.
Here’s an example of a graph of a deployment that is undergoing autoscaling.
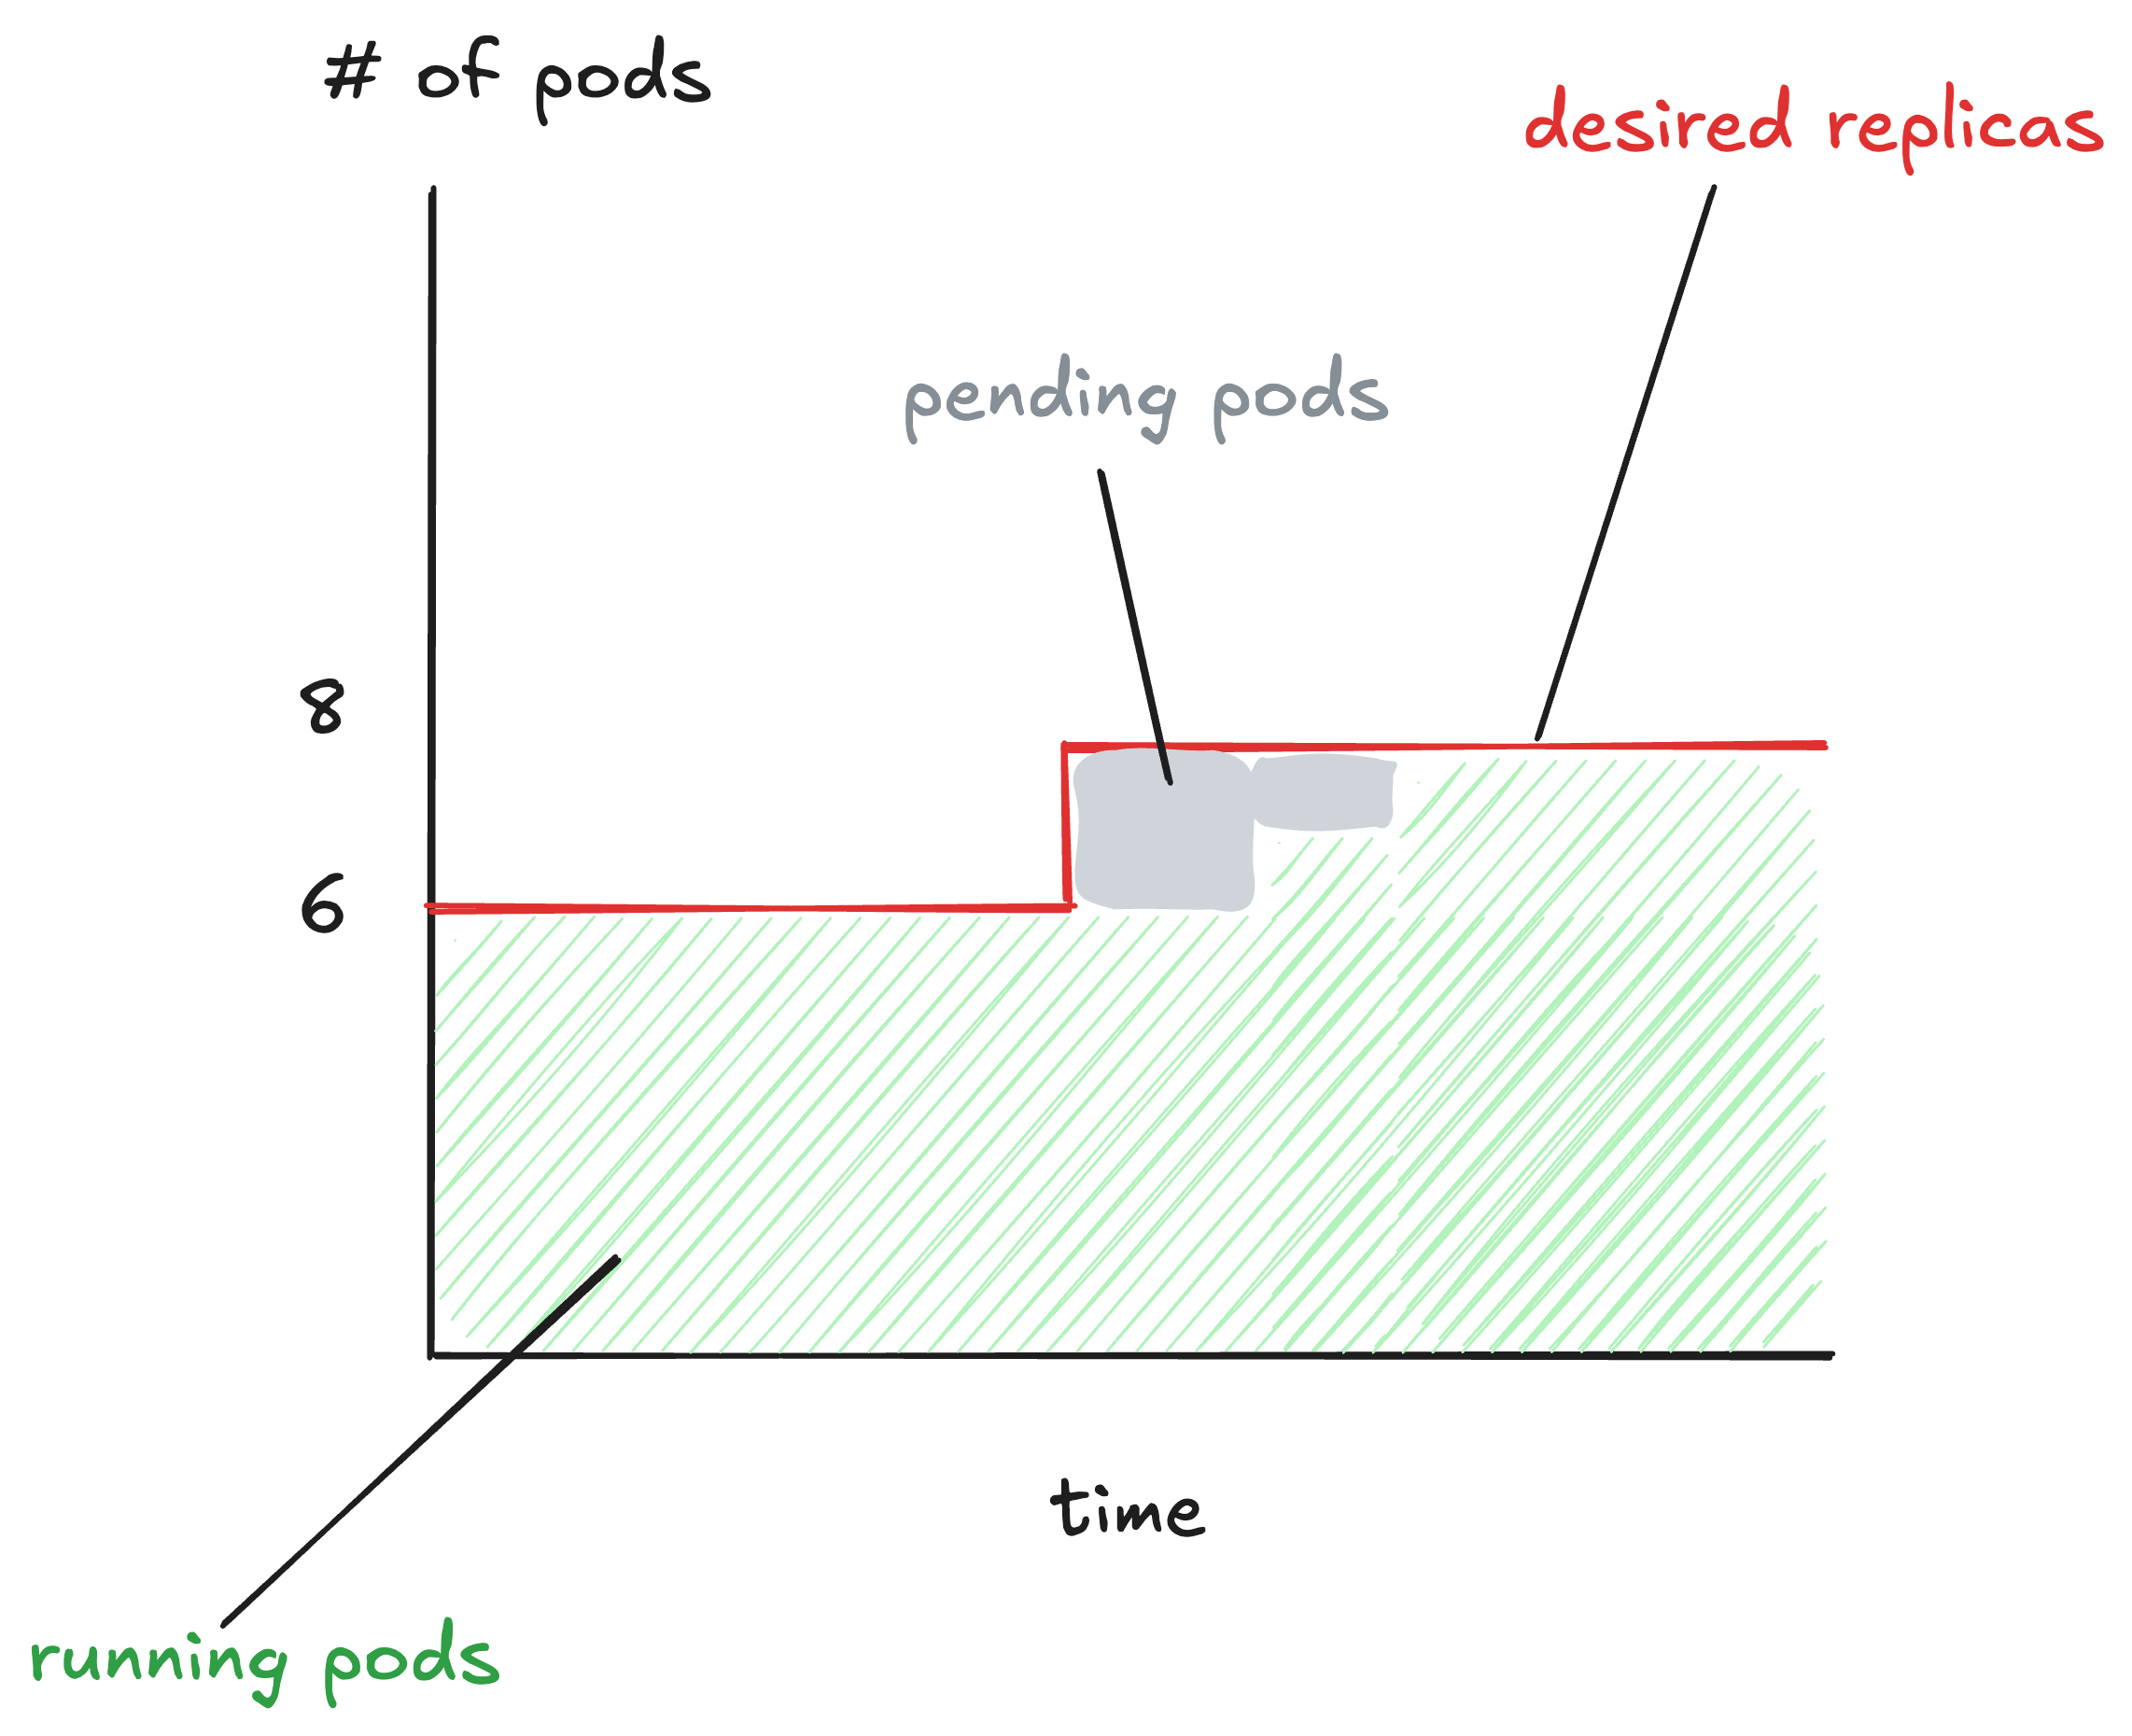
The red line indicates the desired replica count. That’s the number of pods that the autoscaler has determined should be running. At the beginning of this graph, the desired number of pods is 6. Later on, the autoscaler adjusts the desired replica count to 8.
The green indicates the number of pods that are in a running state. Note at the beginning of the graph that there are 6 pods in running state, and at the end there are 8 pods. Here’s how the Kubernetes docs describe the running state:
The Pod has been bound to a node, and all of the containers have been created. At least one container is still running, or is in the process of starting or restarting. – Kubernetes pod lifecycle docs
The gray is the interesting bit. That shows the pods that are in the pending state. Here’s how the Kubernetes docs describe the pending state:
The Pod has been accepted by the Kubernetes cluster, but one or more of the containers has not been set up and made ready to run. This includes time a Pod spends waiting to be scheduled as well as the time spent downloading container images over the network. – Kubernetes pod lifecycle docs
After the autoscaler increases the desired replica count to 8, another Kubernetes controller sees the difference between current replica count (6) and desired (8), and spins up two new pods. But those pods don’t immediately start running. Each new pod has to be scheduled onto a node in the cluster that has headroom. Until that happens, the pod is in the pending state.
A deployment consumes all of the headroom, workers try to scale up
Let’s turn back to the write-up:
At 22:44 UTC, an application deploy created a surge in application Pod volume… This surge consumed the available headroom on already-deployed Nodes.
When you deploy a new version of your software onto a Kubernetes cluster, the cluster spins up new pods with containers that are running the new version. In this case, these pods new consumed all of the available resources on all of the nodes of the cluster.
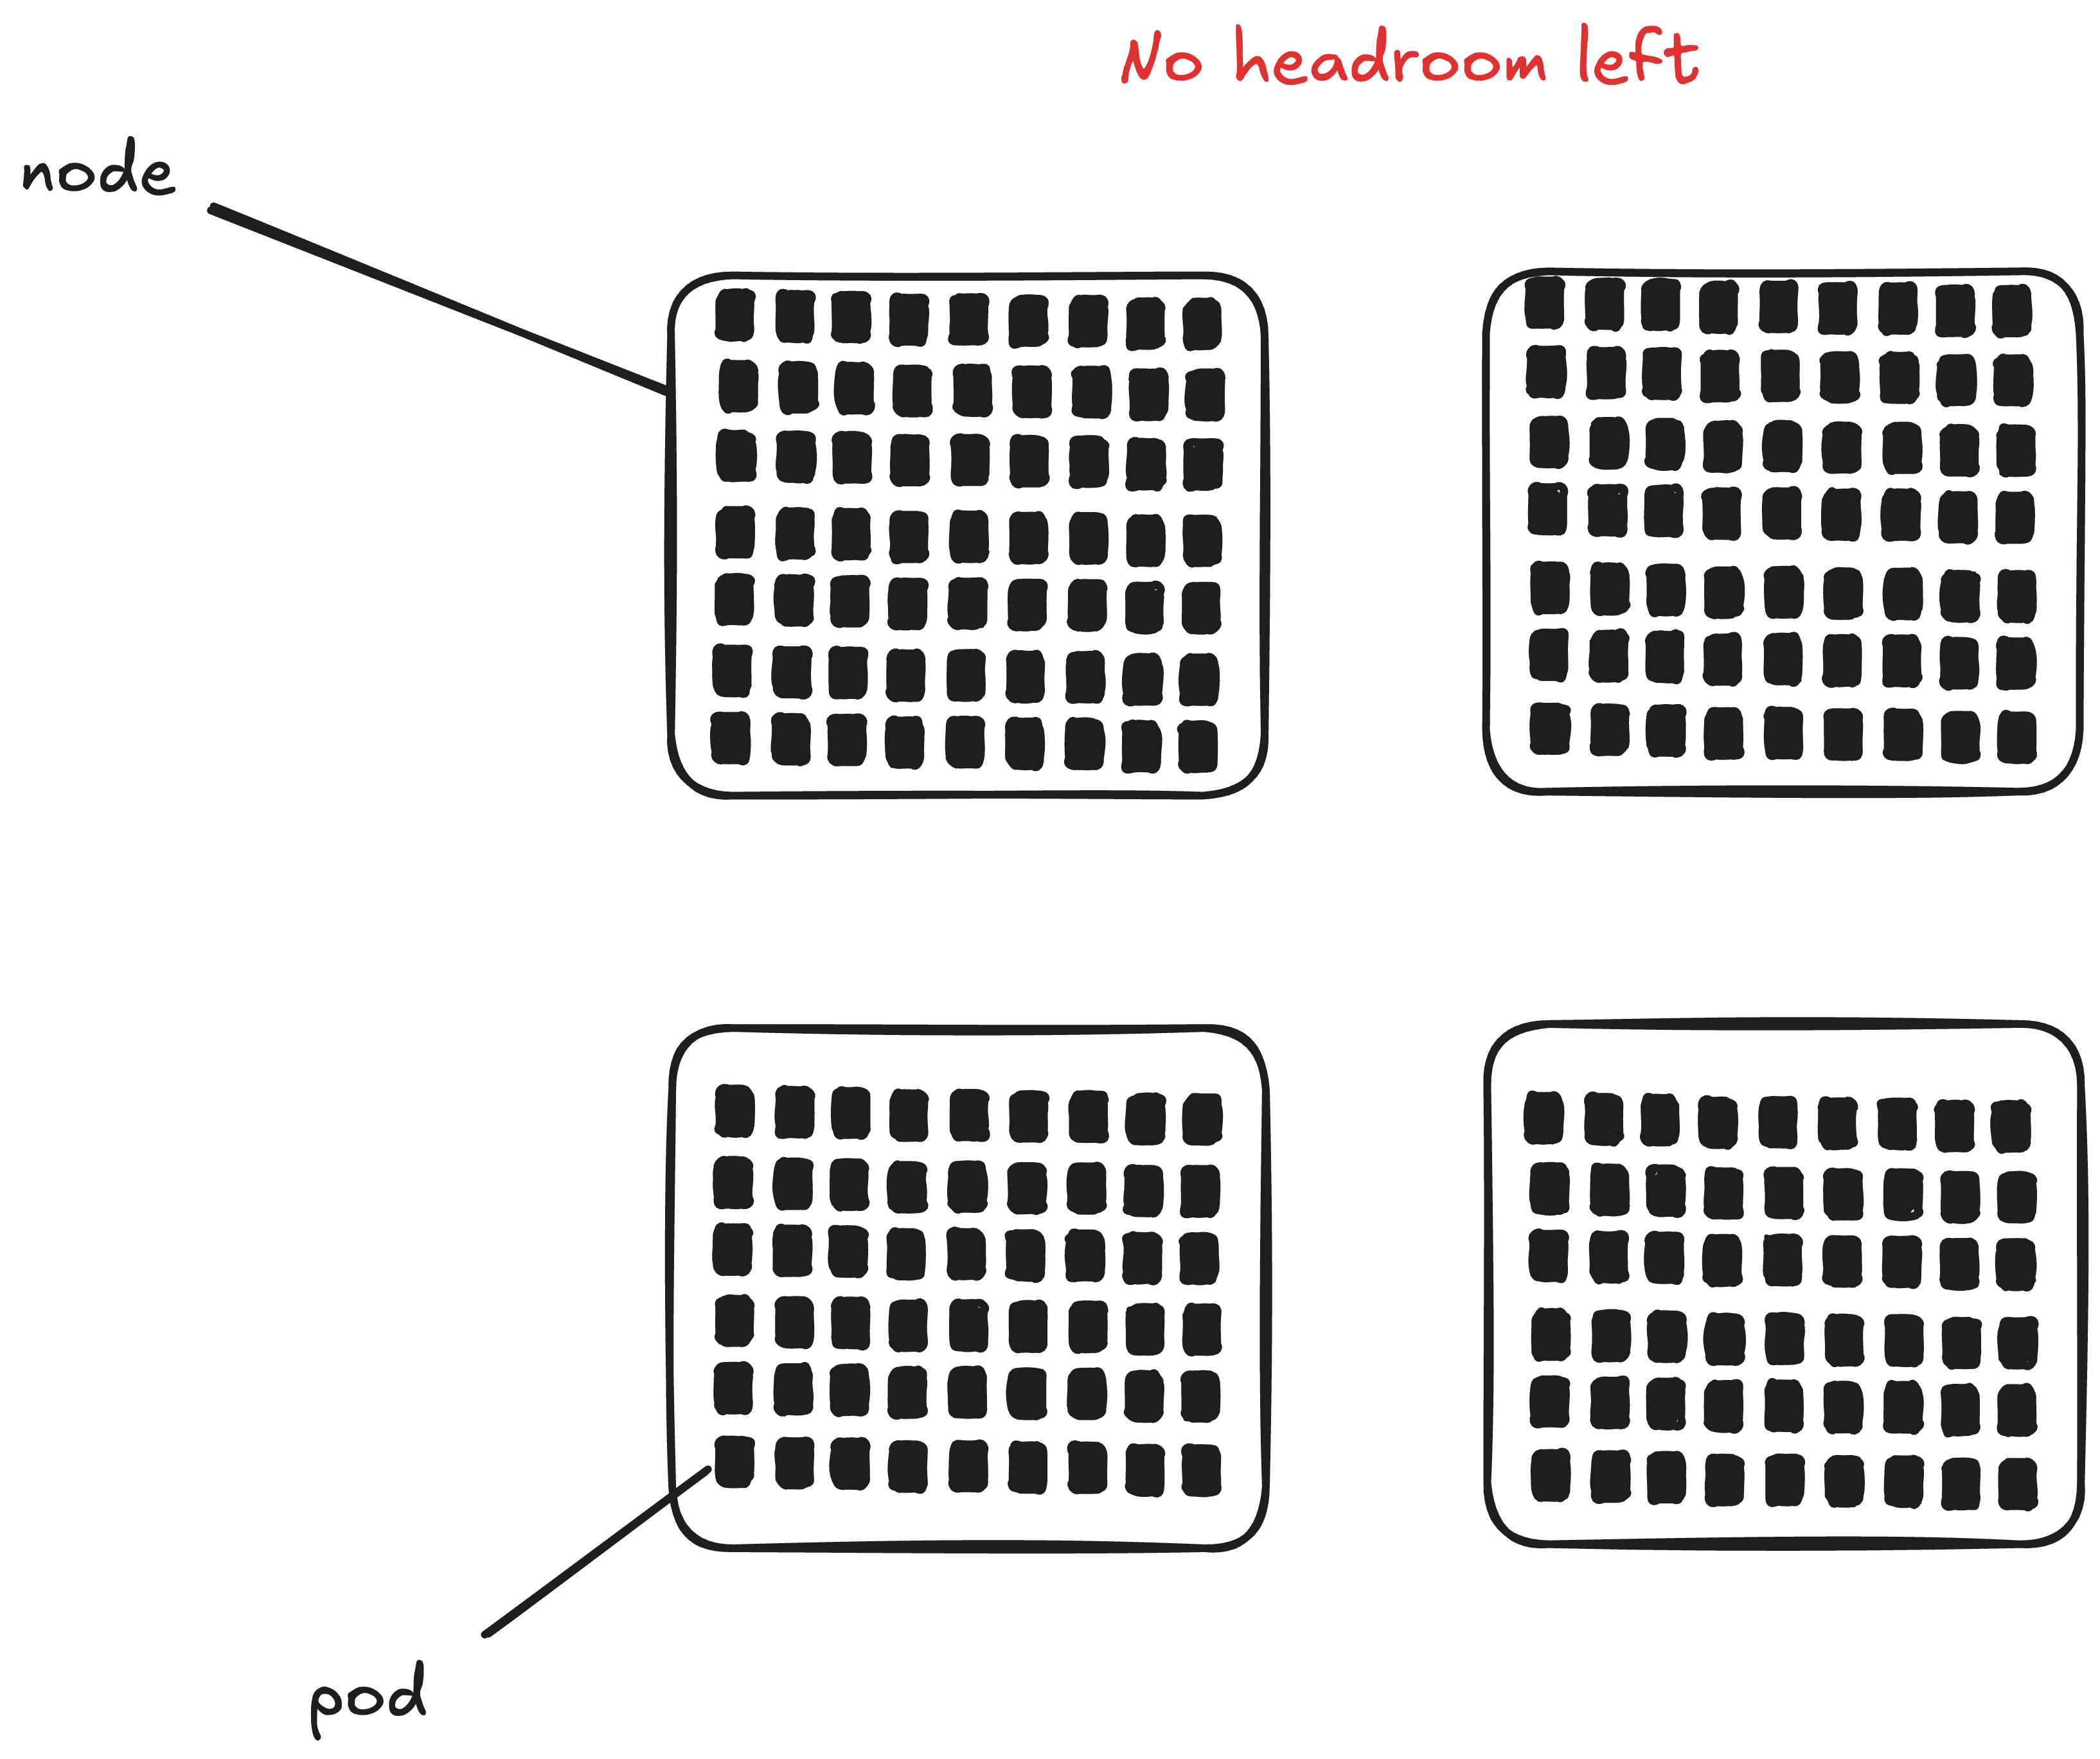
In Buildkite’s case, in addition to an application deployment eating up all the headroom, there was a replicaset of background workers that was being scaled up by the pod autoscaler at the same time. From the write-up:
At 22:44 UTC, an application deploy created a surge in application Pod volume… This surge consumed the available headroom on already-deployed Nodes, which limited applications’ capacity to autoscale promptly. Some background workers (including the aforementioned notification workers) were also attempting to scale out at this time.
So, we have one application (background workers) trying to increase its replica count, at the same time as another application has eaten up all of the available capacity.
You can scale up your k8s cluster too, but you’ll need to wait
At 22:44 UTC, an application deploy created a surge in application Pod volume, which caused our EKS cluster to scale out. (emphasis added)
Just like a service owner can configure autoscaling for their service, a Kubernetes administrator can configure autoscaling for their cluster: when it starts to run out of headroom, the cluster autoscaler can automatically request new EC2 instances from AWS. Instead of using the horizontal pod autoscaler (which is for scaling pods), you use a cluster autoscaler, like Karpenter, which happens to have been written by AWS. But the general concept of autoscaling is the same here.
However, as we saw in the diagram above, autoscaling isn’t instantaneous: it takes time to provision new EC2 instances and add them to a Kubernetes cluster.
The headroom shortage and subsequent cluster autoscaling delayed provisioning of the compute requested by those services. Since there had been no change in the metrics that triggered the services to scale up, those services requested even more Pods.
Normally the impact of such runaway autoscaling would be limited by the services’ configured maximums. However, as mentioned previously the maximums for these services had been set higher than usual.
Here’s my best guess of the behavior they saw, based on the text.
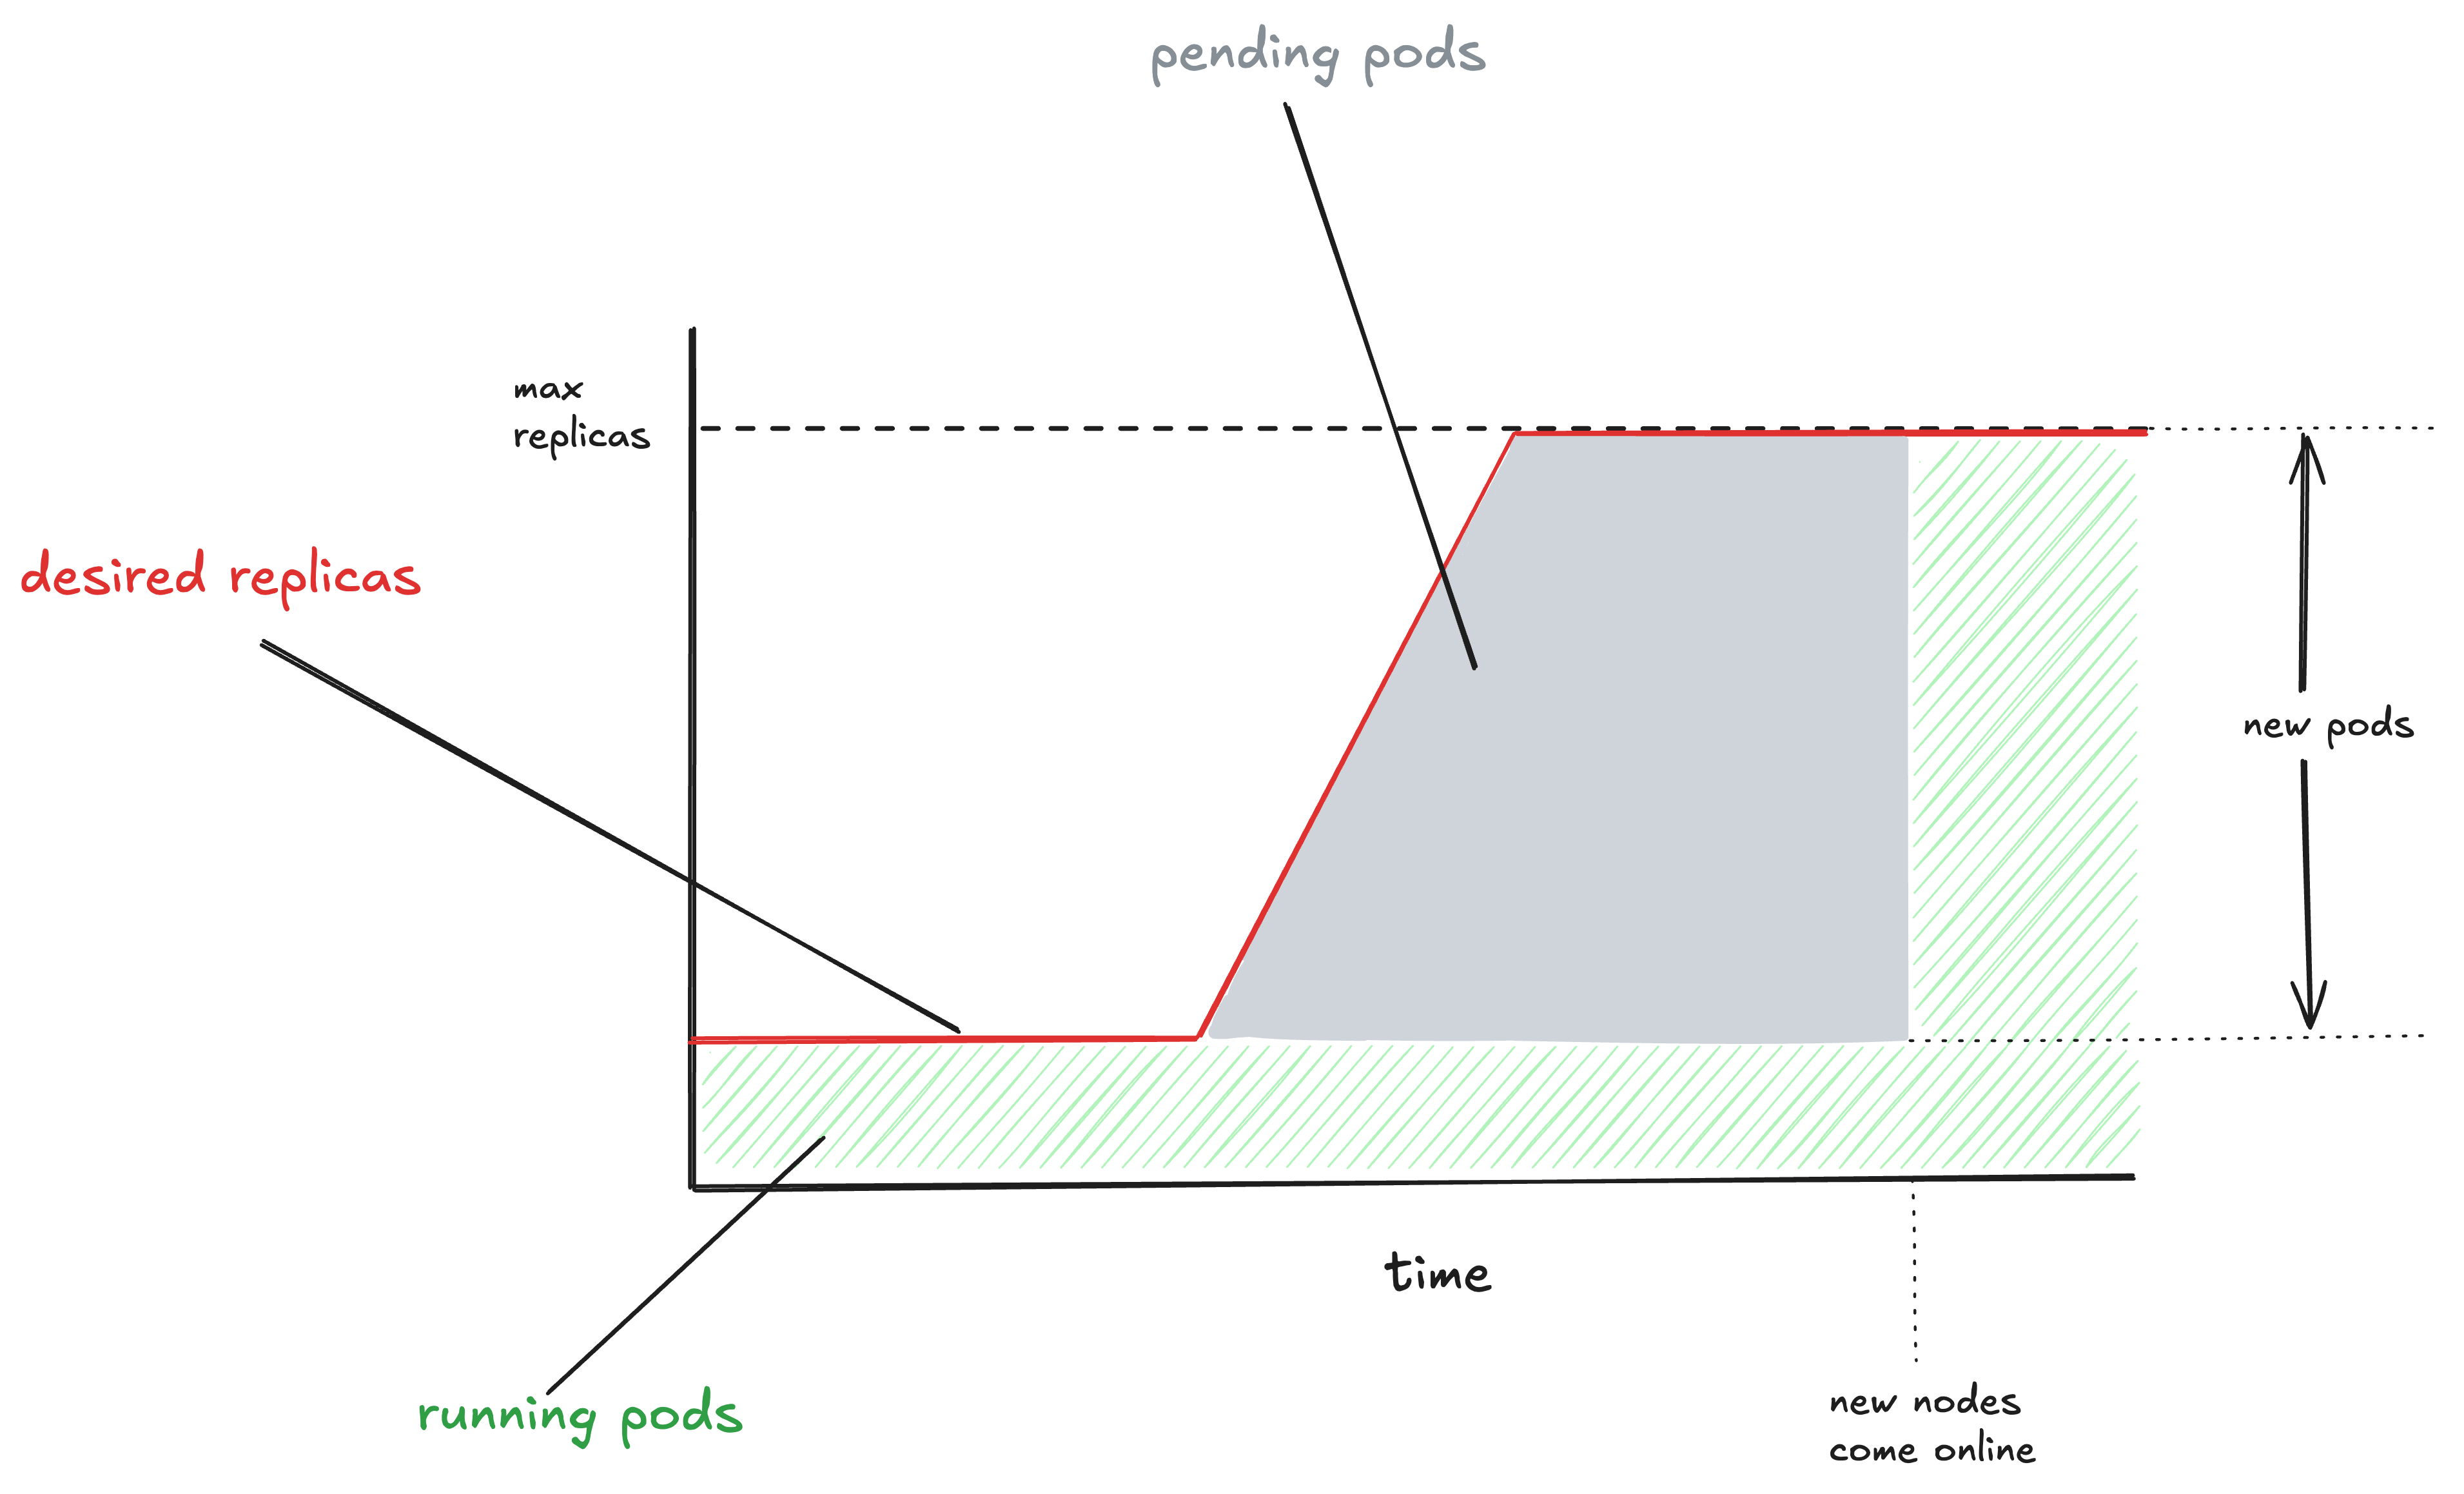
The above diagram is a sort of schematic representation of my understanding of what happened. Some services running on the cluster scaled up, meaning the desired number of replicas increased for those services (that’s the red line going upwards). However, because the cluster was out of capacity, and the new nodes had not come online yet, the new pods were still in pending state waiting for the new capacity.
From the write-up, it sounds like the desired replica count continued to increase during this period. When configuring an autoscaling policy, you always configure a maximum number of replicas constant. This max replicas constant for the worker pool in question had previously been set to a high value when the pool was first created.
To ensure sufficient capacity for both pools, we initially configured each with the same high maxReplica count as the original shared pool, with the intention of reviewing and adjusting the limits for both pools downwards at a later date…
Normally the impact of such runaway autoscaling would be limited by the services’ configured maximums. However, as mentioned previously the maximums for these services had been set higher than usual.
Eventually, the new cluster nodes came online, and the new pods came online. This led to a large number of new pods coming online in the cluster.
(I can’t tell from the text whether the worker pool actually scaled all of the way up to max replicas or not, though).
Après autoscaling, le déluge
Buildkite services running in one of our production Kubernetes clusters depend on an internal DNS service CoreDNS to locate databases, queues, and other application components.
Once the new EKS nodes come online, the worker pool rapidly scales up. That’s not a problem for the worker pool itself. But it turns out that this rapid introduction of new compute resources into the cluster is a problem for a different service: CoreDNS.
The application deployment and runaway autoscaling combined to trigger an unusually high rate of change to applications, network endpoints, and cluster nodes.
From the write-up, it sounds like CoreDNS is the service discovery mechanism used by Buildkite. A service discovery system needs to keep track of the various resources in your system. The more churn you have in these dynamic resources, the greater the load is going to be on your service discovery system.
In this case, the step change in new cluster nodes and new application pods coming online put too much pressure on their CoreDNS service, and it fell over.

Once CoreDNS went unhealthy, the overall system was in real trouble:
CoreDNS unavailability caused failures across APIs, job dispatch, and notifications for all customers.
Like in the GitHub incident, the overloaded service wasn’t able to recover on its own. To remediate, the responders reduced the load by stopping new deploys, and then gave it more resources.
Retries and delayed work increased the load during recovery…
How we responded
We paused further application deployments, deployed more CoreDNS service replicas, raised the memory available to each CoreDNS replica, and expanded the node pool available to run them. The new set of CoreDNS Pods came into service by 23:12 UTC. After that, DNS errors fell rapidly. Customer-facing services processed the accumulated backlog and recovered fully by 23:16 UTC.
Actions taken for safety end up increasing risk
We often make operational decisions where we believe we are reducing risk. As mentioned earlier, it’s notable that the max replicas threshold was intentionally set high to reduce the risk of running out of capacity.
To ensure sufficient capacity for both pools, we initially configured each with the same high maxReplica count as the original shared pool, with the intention of reviewing and adjusting the limits for both pools downwards at a later date.
Pick a max replicas that’s too low, and your service can become overloaded: I’ve seen it many times. But picking a max replicas that’s too high created a risk that (I can only assume) nobody even conceived of in the moment. That’s the nature of the complex systems that we work with.
Control loops will drive you loopy
In one sense, this is a story of too much autoscaling, as it was a sudden, dramatic increase in scaling that led to CoreDNS being overwhlemed. But it’s also a story of not enough autoscaling: CoreDNS was not configured to autoscale at all.
The cluster’s CoreDNS service was running at a fixed size and did not automatically scale with the size or rate of change of the cluster.
An autoscaler is an example of a control loop in your system. In this particular incident, two control loops (the horizontal pod autoscaler and the cluster autoscaler) interacted in an unexpected way that led to an increase in CoreDNS, which was missing a control loop to ensure it had sufficient resources. In general, it’s difficult to reason about the behavior of interacting control loops. It’s these sorts of complex interactions that can make incidents hard to deal with.
If you’ve ever taken a course in control systems, you’ll know that stability is one of the primary concerns with building a control system, and that delays in your system can impact its stability. This was an interesting case of that where there were delays introduced because of the time required for the cluster to scale up. And, indeed, that led to that worker pool getting overscaled.
Rapid scale up as an increased load scenario
Because your application behaves differently on startup than when it’s fully warmed, if you’re in a situation when many pods are starting up, that’s a different mode of operation than your system normally deals with. Here we saw CoreDNS be the system that got overwhelmed. But any system that gets more interaction during startup than steady-state is at potential risk of being knocked over in a scenario like this.
Most load tests I’ve seen involved sending a significant amount of additional traffic to a system that’s in steady state. I’ve never seen anybody run a load test where they just dramatically scaled up a single service and watched what happened. But I bet you’d find some interesting failure modes that way that you wouldn’t find with traditional load testing.
Saturation, migration, networking, misbehaving reliability subsystems
The Buildkite incident checks off multiple boxes in my list of omnipresent availability risks in cloud software. Here, working involved in a migration (from ECS to EKS), and systems intended to improve reliability (autoscalers) resulted in saturation (CoreDNS), which impacted a networking system (once again, CoreDNS).
So many contributors
There’s a lot more detail in the write-up than I’ve covered in this post. I tried to collect the various contributors that they explicitly mention in the write-up. Here are the ones I spotted:
- migrating from ECS to EKS
- The EKS cluster was increasing in size during the course of the migration
- An application deploy, which spiked the number of application pods
- all remaining headroom in the EKS cluster being consumed by the application deploy
- EKS cluster had to autoscale in order to make the new capacity available, this took time
- background workers were attempting to scale out at the same time
- metrics used for scaling background workers remaining unchanged while cluster is waiting for new capacity to come online
- time-sensitive notification jobs had been moved from general-purpose pool to low-latency worker pool
- high maxReplica count set on the low-latency worker pool
- CoreDNS used for service discovery
- large number of pods coming online led to high rate of change to apps, network endpoints, cluster nodes
- CoreDNS runs at fixed size (does not autoscale)
- defect in monitoring query which masked increases in CoreDNS query response times
- Recent performance gains in application hid client-side latency increases
- CoreDNS pods exceeded allowed memory limits, were restarted by kubernetes
- continued demand for DNS kept load high on CoreDNS
- DNS retries kept load high on CoreDNS
Finally, I commend Buildkite for providing so many technical details about the incident. It increases my esteem for their engineering organization.

