This past week at SREcon 2026 Americas, I gave a plenary talk titled The Power of Stories. I referenced several books and papers in that talk, which are linked below.
GitHub’s been taking it on the chin on the availability front lately. Yesterday, their CTO, Vlad Fedorov, wrote a post on their blog about their recent incidents: Addressing GitHub’s recent availability issues. This post shares some additional details about three recent incidents. I’ll list them in order that they are mentioned in the post:
Feb. 9, 2026 – involved an overloaded database cluster
Feb. 2, 2026 – involved security policies unintentionally blocking access to VM metadata
Mar. 5, 2026 – involved writes failing on a Redis cluster
First observation: I really appreciate it when a company addresses availability concerns by providing more public details about recent incidents. I always think more of companies that are willing to provide these sorts of details, and I hope GitHub provides even more details about their outages in the future.
Saturation, again and again and again
The first incident is a classic example of saturation. In this case, it was an important database cluster that got overloaded. Because databases are much harder to scale up than stateless services, your best bet when dealing with overload is to figure out how to reduce the load so the database can go healthy again. On the other hand, reducing load means denying requests: a “healthy” database that is taking zero traffic has 0% availability! So it’s a balancing act, and the responders are constrained by the infrastructure that currently exists for selectively limiting traffic. Once the overload happens, you can only twist the knobs that you already have available.
Fedorov notes they’re now prioritizing implementing mechanisms to protect against these sorts of scenarios where load increases unexpectedly.
Protecting downstream components during spikes to prevent cascading failures while prioritizing critical traffic loads.
Taking it to the limit, and then over it
Fedorov also provided details on how they ended up seeing so much more traffic than usual. They released a new model (I think it’s an AI model) on a Saturday, when traffic is lower. And then, on Monday, multiple different factors contributed to an increase in traffic that pushed them over the limit. The blog post mentions these four contributors:
new model release
they had reduced a user settings cache TTL from 12 hours to 2 hours, increasing write load
they hit their regular peak load on Monday
many of their users updated to the new version of their client apps, and this update activity increased read load
They had reduced the TTL so that people would get the new model more quickly, but reducing the TTL means that more cache evictions, which meant more database load.
This compounding effect of multiple factors is pernicious, because it can be hard to reason about why your system hit a tipping point. From the write-up:
While the TTL change was quickly identified as a culprit, it took much longer to understand why the read load kept increasing, which prolonged the incident.
Understanding the role of multiple, independent contributing factors is hard enough in a post-incident analysis, identifying this in the heat of an incident can be damn near impossible.
The thing about tipping points is that you don’t notice until you tip
This failure mode was a case where the danger was growing over time, but there were no visible symptoms until they hit the limit.
The architecture was originally selected for simplicity at a time when there were very few models and very few governance controls and policies related to those models. But over time, something that was a few bytes per user grew into kilobytes. We didn’t catch how dangerous that was because the load was visible only during new model or policy rollouts and was masked by the TTL.
The resilience engineering folks would call this an example of a brittle collapse, where a system falls over when it hits the limit. We do our best to monitor for trouble and anticipate trouble ahead, but we’re always going to hit scenarios like this where signals of a problem are being masked, until the perfect storm hits. At that point, we just have to be good at responding. And, hopefully, good at learning as well.
Failovers are a different mode of operation
Their February 2nd incident involved a failover where they had some sort of infrastructure issue in one(?) region. GitHub has mechanisms for automatically shifting traffic to healthy regions, and that mechanism worked here, but there was another issue that they hit:
However, in this case, there was a cascading set of events triggered by a telemetry gap that caused existing security policies to be applied to key internal storage accounts affecting all regions. This blocked access to VM metadata on VM creates and halted hosted runner lifecycle operations.
It was the combination of the traffic failover and a telemetry gap that ultimately led to the outage. (Did the automatic traffic shift end up making things worse? I can’t tell from the write-up). The traffic redirection didn’t create the incident, but it enabled it to happen. Whenever our system runs in an alternate mode, there’s an increased risk that we’ll hit some weird edge case that we haven’t seen before because it doesn’t regularly run in that mode. Automated reliability mechanisms often put our systems in these alternate modes. This means that they can enable novel failure modes.
In fact, the March 5th incident followed a similar pattern, this time it was a Redis cluster primary failover enabled the incident.
The failover performed as expected, but a latent configuration issue meant the failover left the cluster in a state with no writable primary.
Reliability vs security, the eternal struggle
The Feb 2nd incident also illustrates the fundamental tradeoff between reliability and security. Reliability’s job is to ensure service access to the users who are supposed to have it. Security’s job is to deny service access to the users that aren’t supposed to have it. These two forces are are in tension, as we see in this incident where a security mechanism denied access.
It’s not just about automation, it’s about more options for responders
In the Feb 9th incident, Fedorov notes how the responders lacked certain functionality that would have helped them mitigate (emphasis mine)
Further, due to the interaction between different services after the database cluster became overwhelmed, we needed to block the extra load further up the stack, and we didn’t have sufficiently granular switches to identify which traffic we needed to block at that level.
He also notes how they had to manually recover from the March 5th incident:
With writes failing and failover not available as a mitigation, we had to correct the state manually to mitigate.
I hope they don’t pull all of their eggs in the “automation” basket in their remediations. For the first incident in particular, automated load shedding is tricky to get right, it’s hard to reason about, and you won’t have experience with the behavior of this new automation until either you have the incident, or until the automation actually creates an incident (e.g., opens a circuit breaker when it shouldn’t). Making it easier for the responders to manually control load shedding during an incident is important as well.
More generally, reliability work isn’t just about putting in automated mechanisms to handle known failure modes. It’s also about setting up the incident responders for success by providing them with as many resources as possible before the next incident happens. In this context, resources means the ability to manually control different aspects of the infrastructure, whether that’s selective traffic blocking, manually updating database state, or many of the other potential remediations that a responder might have to do. The more flexibility they have, the more room to maneuver (to use David Woods’s phrase), the easier it will be for them to improvise a solution, and the faster the next surprising incident will be mitigated.
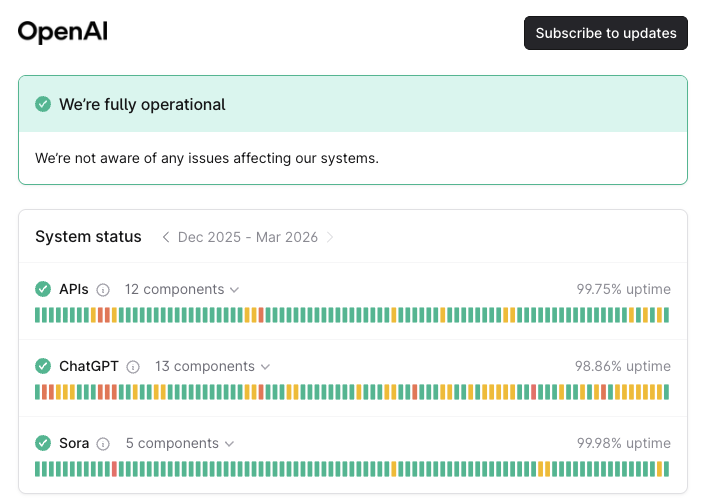
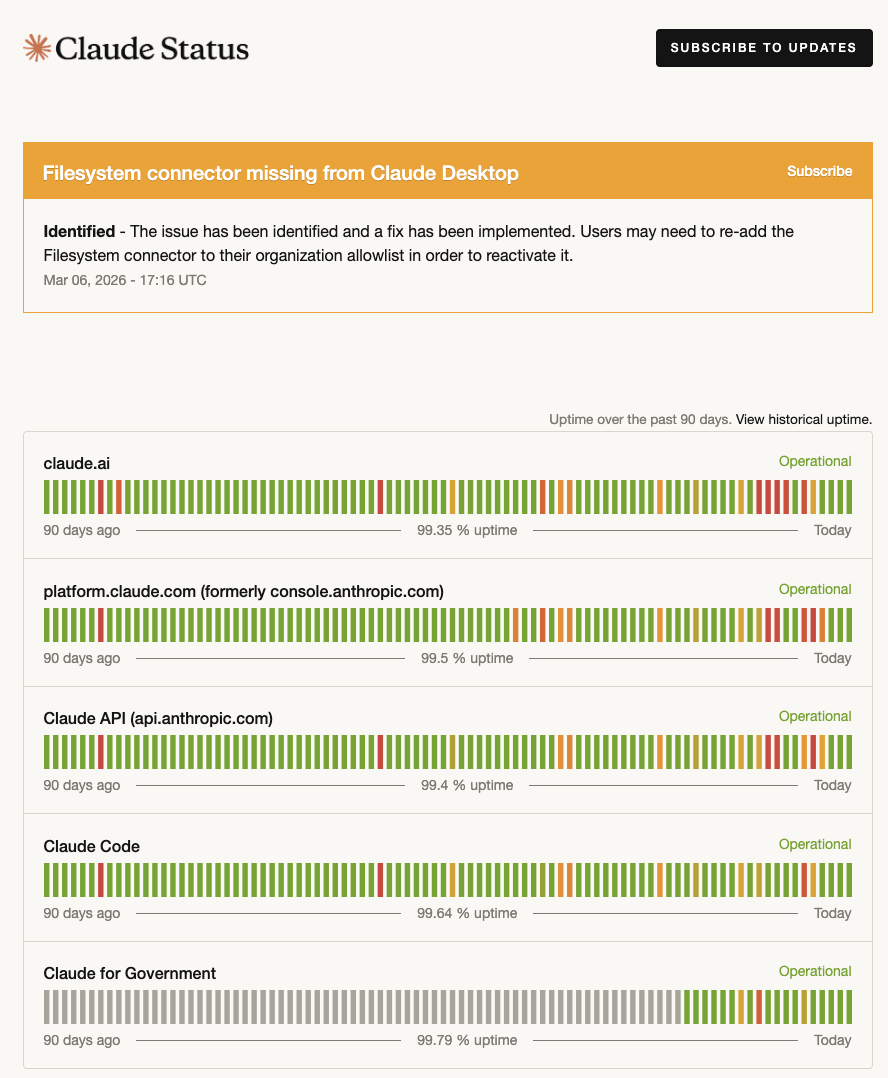
The general vibes I see online is that the AI companies have not been doing particularly well in the reliability department. Both OpenAI and Anthropic publish reliability statistics on their status pages. Now, I’m not a fan of using the nines as a meaningful indicator of reliability, but since I don’t have access to any other signals about reliability for these two companies, they’ll have to do for the purposes of this blog post.
And these numbers… well, they’re not great. With the exception of Sora, none of the services at either company makes it to 99.9% of reliability (three nines). Surprisingly, ChatGPT at 98.86% of uptime does not even make it to two nines.
I’ve seen speculation that the reason that reliability isn’t great is that this is a high development velocity phenomenon. Here’s Boris Cherny (the guy at Anthropic who wrote Claude Code) pushing back on that hypothesis.
Hey Gergely 👋 to be clear this is less about shipping velocity, and more about rapid user growth straining our services. We’re working through these issues the same way we’ve always done. This is what hypergrowth looks like (I’m sure you saw it at Uber too)! 10x y/y growth ain’t…
This isn’t move fast and break things, but rather grow fast and overload things. These companies are in the business of providing LLMs, which are a new capability. Users are leveraging LLMs in new and innovative ways. The resilience engineering researcher David Woods refers to this phenomenon as a florescence to describe this kind of rapid and widespread uptake.
As a consequence of this florescence, the load on the providers increases unexpectedly and dramatically: they weren’t able to predict the load and have struggled to keep up with it when it happens. These LLM providers are running directly into the problem of saturation (plug: check out my recent post on saturation for the Resilience in Software Foundation).
Now, I expect that these companies will get better at recovering from these unexpected increases in load as they gain experience with the problem. Because of capacity constraints with those pricey GPUs, they can’t always scale their way out of these problem, but they can redistribute resources, and they can get better at load shedding and other sorts of graceful degradation to limit the damage of overload. And I bet that’s where they’re both investing in reliability today. At least, I hope so. Because this problem isn’t going to go away. If anything, I suspect their loads will become even more unpredictable as people continue to innovate with LLMs. Because AIs don’t seem to do any better at predicting the future than humans.
Cloudflare just posted a public write-up of an incident that they experienced on Feb. 20, 2026. While it was large enough for them to write it up like this, it looks like the impact is smaller than the previous Cloudflare incidents I’ve written about here. Given that Cloudflare continues to produce the most detailed public incident write-ups in the industry, I still find them insightful. After all, the insight you get from an incident write-up is not related to the size of the impact! Here are some quick observations from this one.
System intended to improve reliability contributed to incident
The specific piece of configuration that broke was a modification attempting to automate the customer action of removing prefixes from Cloudflare’s BYOIP service, a regular customer request that is done manually today. Removing this manual process was part of our Code Orange: Fail Small work to push all changes toward safe, automated, health-mediated deployment.
Cloudflare has been doing work to improve reliability. In this case, they were working to automate a potentially dangerous manual operation to reduce the risk of making changes. Unfortunately, they got bitten by a previously undiscovered bug in the automation.
How do you pass the flag?
When I first read this write-up, I thought the issue was that they had done a query which was supposed to have a scope, but it was missing a scope, and so returned everything. But that’s not actually what happened.
Accidentally missing a scope for a query, resulting system behavior is "match everything", with disastrous consequences. another entry in a never-ending series. (See also: missing WHERE clause in a SQL query) blog.cloudflare.com/cloudflare-o…
(I’ve seen the accidentally unscoped query failure mode multiple times in my career, but that’s not actually what happened here)
Instead, what happened here was that the client meant to set the pending_delete flag when making a query against an API.
Based on my reading, the server expected something like this:
GET /v1/prefixes?pending_delete=true
Instead, the client did this:
GET /v1/prefixes?pending_delete
The server code looked like:
if v := req.URL.Query().Get("pending_delete"); v != "" {
// server saw v=="", so this block wasn't executed
...
return;
}
// this was executed isntead!
It sounds like there was a misunderstanding about how to pass the flag, based on this language in the write-up:
One of the issues in this incident is that the pending_delete flag was interpreted as a string, making it difficult for both client and server to rationalize the value of the flag.
This is a vicious logic bug, because what happened was that instead of returning the entries to be deleted, the server returned all of them.
Cleanup, but still in use
Since the list of related objects of BYOIP prefixes can be large, this was implemented as part of a regularly running sub-task that checks for BYOIP prefixes that should be removed, and then removes them. Unfortunately, this regular cleanup sub-task queried the API with a bug.
This particular failure involved an automated cleanup task, to replace the manual work that a Cloudflare operator previously had to perform to do the dangerous step of removing published IP prefixes. In this case, due to a logic error, active prefixes were deleted.
Here, there was a business requirement to do the cleanup, it was to fulfill a request of a customer to remove prefix. More generally, cleanup itself is always an inherently dangerous process. It’s one of the reasons that code bases can end up such crufty places over time: we might be pretty sure that a particular bit of code, config, or data, is no longer in use. But are we 100% sure? Sure enough to take the risk of deleting it? The incentives generally push people towards a Chesterton’s Fence-y approach of “eh, safer to just leave it there”. The problem is that not cleaning up is also risky.
Reliability work in-flight
As a part of Code Orange: Fail Small, we are building a system where operational state snapshots can be safely rolled out through health-mediated deployments. In the event something does roll out that causes unexpected behavior, it can be very quickly rolled back to a known-good state. However, that system is not in Production today.
Recovery took longer than they would have liked here: full resolution of all of the IP prefixes took about six hours. Cloudflare already had work in progress to remediate problems like this more quickly! But it wasn’t ready yet. Argh!
Alas, this is unavoidable. Even when we are explicitly aware of risks, and we are working actively to address those risks, the work always takes time, and there’s nothing we can do but accept the fact that the risk will be present until our solution is ready.
People adapt to bring the system back to healthy
Affected BYOIP prefixes were not all impacted in the same way, necessitating more intensive data recovery steps… a global configuration update had to be initiated to reapply the service bindings for [a subset of customers that also had service bindings removed] to every single machine on Cloudflare’s edge.
The failure modes were different for different customers. In some cases, customers were able to take action themselves to remediate the issue through the Cloudflare dashboard. There were also more complex cases where Cloudflare engineers had to take action to restore service.
The write-up focuses primarily on the details of the failure mode. It sounds like the engineers had to do some significant work in the moment (intensive data recovery steps) to recover the tougher cases. This is where resilience really comes into play. The write-up hints at the nature of this work (reapply service bindings… to every single machine on Cloudflare’s edge). Was there pre-existing tooling to do this? Or did they have to improvise a solution? This is the most interesting part to me, and I’d love to know more about this work.
The two management giants of the mid-twentieth century were Peter Drucker and W. Edwards Deming. Ironically, while Drucker hails from Austria-Hungary (like me, Drucker emigrated to the U.S. as an adult) and Deming was born in the U.S., it was Drucker that proved to be more influential in America. Deming’s influence was much greater in Japan than it ever was the U.S. If you’ve ever been at an organization that uses OKRs, then you have worked in the shadow of Drucker’s legacy. While you can tell a story about how Deming influenced Toyota, and Toyota inspired the leanmovement, I would still describe management in the U.S. as Deming in exile. Deming explicitly stated that management by objectives isn’t leadership, and I think you’d be hard-pressed to find managers in American companies who would agree with that sentiment.
I thing Deming’s “Out of the Crisis” is a better book, but I don’t have a physical copy of it
Here I want to talk about why I think it is that Drucker’s ideas were stickier than Deming’s in the U.S. It all comes down to the nature of organizations and people.
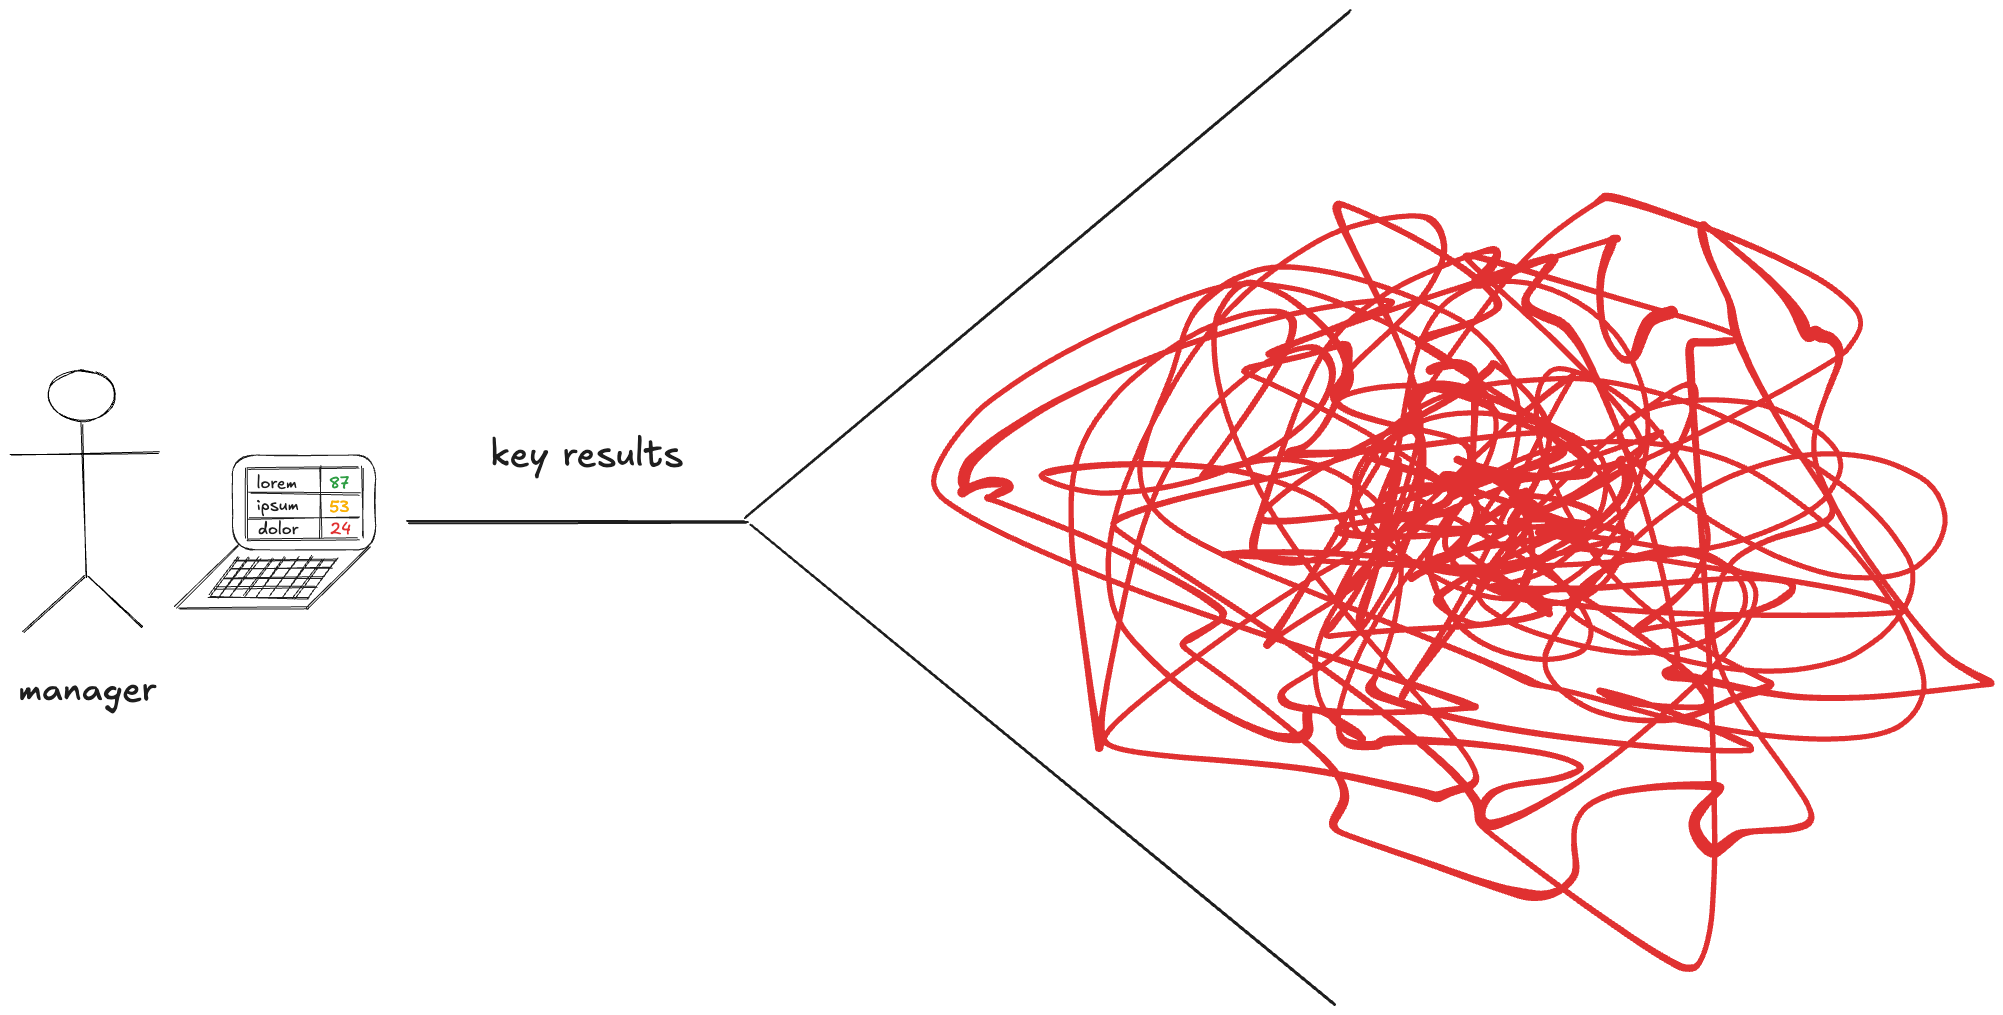
My rendering of an organization. Not to scale.
An organization is a big, hairy, complex mess, and the bigger the organization is, the hairier and more complex it gets. Managers, on the other hand, have a very finite amount of bandwidth. There are only so many hours in a day, and this number does not increase with the complexity of an organization. And, let’s face it, they’re spending something close to 100% of that bandwidth attending meetings.
How is a manger to make sense of this mess?
OKRs as a mess-reduction mechanism
In the Druckerian approach of OKRs, you set a small number of objectives, and then you identify quantifiable key results for each objective that provide a signal about whether progress towards the objective is being made, and then you monitor the key results. Key results reduce the bandwidth required to make sense of what’s happening in the system. Instead of the blooming, buzzing confusion of the entire system, monitoring key results means you can filter out all of that unnecessary detail to focus specifically on the aspects that are relevant to the bandwidth-limited manager. It’s no coincidence that when John Doerr wrote a book on his experience with OKRs at Intel and how he brought them to Google, he titled his book Measure What Matters.
The beauty of a set of key results is that they take the messiness of the system as input and create a neat summary in spreadsheet or slide format as output.
Deming’s critique
Deming’s approach to the problem of management was radically different from Drucker’s. In his book Out of the Crisis, Deming puts his criticism of the Drucker-ish approach in stark terms. He uses the term deadly disease to describe managing through numerical targets.
Eliminate management by objective. Eliminate management by numbers, numerical goals. Substitute leadership.
Deming’s perspective can be summed up with the old saying: if you don’t change the system, the system doesn’t change. He argued that if you wanted improvements, you had to make systemic changes. Furthermore, you had to understand the system if you wanted to come up with a system improvement that would actually work.
Deming advocated studying the system over numerical targets
Classical control versus statistical control
Deming was not opposed to the idea of goals: indeed, he was a passionate believer that management should strive to improve quality and productivity, and both of those are goals. He was also not opposed to metrics: he was an advocate of applying Walter Shewhart’s statistical techniques for management. It’s the use of metrics that’s radically different in the two approaches.
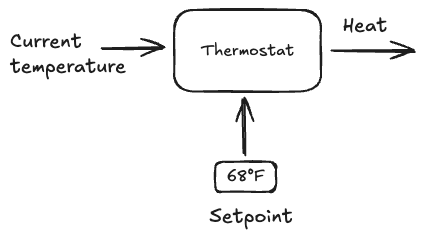
The Drucker-ian approach is akin to a classical control system, like a thermostat. Specifying the key results are like setting the desired temperature (say, 68°F), and then the thermostat generates output in order to bring the current temperature of the room in line with the setpoint.
The idea here is that you give the organization a setpoint, and it will implement the control system that will work to achieve the setpoint.
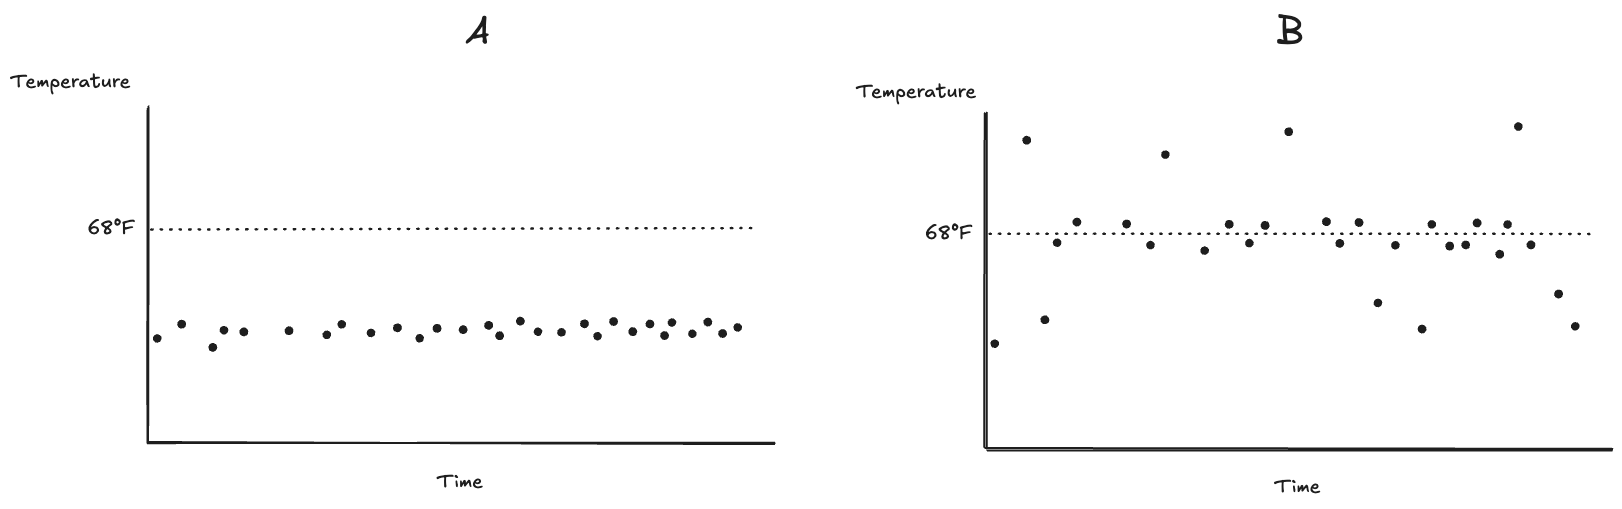
Deming wrote in explicit terms about control, but he meant it in a different sense: we wrote about statistical process control, and statistical process control is about the variability of the output. I’ve written about statistical process control before, but here I’ll touch on the concepts again, with an example. Let’s imagine we are observing the behavior of two brands of thermostats, A and B, each controlling the temperature of a different room. Both thermostats have the same setpoint of 68°F. We observed their behavior by graphing the temperature of the two rooms over time.
Note how the points for thermostat A all fall within a narrow band, whereas for thermostat B there are many more outliers. We’d say that thermostat A is under statistical process control whether thermostat B is not, even though the average temperature for thermostat B is closer to the setpoint then the average temperature for thermostat A. (In practice, you’d draw a control chart to identify whether the system is under statistical control).
Deming argued that you had to understand whether your system was under statistical control in order to determine what intervention to do in order to make an improvement. For example, if your system was out of control, the next intervention would be to do a qualitative investigation into the outliers. On the other hand, if the system was under statistical control, then you’d have to figure out what systemic change to make to improve things.
Note how you build a classical control system, whereas you observe whether your system is under statistical process control. Statistical process control is about understanding the system.
Drucker makes a manager’s life easier, Deming makes it harder
Deming faced a similar challenge to Calvin
One of the virtues of OKRs is that they are straightforward for managers to apply. You set direction by specifying objectives, and you enforce accountability by monitoring key results. Applying Deming’s approach, on the other hand, requires a much greater commitment of management bandwidth. Drucker offers a control mechanism with a bounded amount of information, where Deming requires a never-ending research program, with no upper bound on the kind of information that might be relevant. In fact, the information might even be unobservable. Deming approvingly quotes the statistician Lloyd Nelson, who said:
The most important figures needed for management of any organization are unknown and unknowable.
Myself, I’m in the Deming camp, but I can see why Drucker’s ideas won out. In reliability, we talk about “making the right thing easy and the wrong thing hard”, other people call this The Pit of Success. The rationale is that people will tend to do the easy thing over the hard thing. And managers are people too. But sometimes the right thing to do is the harder one, and nothing can be done about that.
With the value of AI coding tools now firmly established in the software industry, the next frontier is AI SRE tools. There are a number of AI SRE vendors. In some cases, vendors are adding AI SRE functionality to extend their existing product lineup, a quick online search reveals one such as PagerDuty’s SRE Agents, Datadog’s Bits AI SRE, incident.io’s AI SRE, Microsoft’s Azure SRE Agent, and Rootly’s AI SRE. There are also a number of pure play AI SRE startups: the ones I’ve heard of are Cleric, Resolve.ai, Anyshift.io, and RunWhen. My sense of the industry is that AI SRE is currently in the evaluation phase, compared to the coding tools which are in the adoption phase.
What I want to write about today is not so much what these AI tools do contribute to resolving incidents, but rather what they don’t contribute. These tools are focused on diagnostic and mitigation work. The idea is to try to automate as much as possible the work of figuring out what the current problem is, and then resolving it. I think most of the focus is, rightly, on the diagnostic side at this stage, although I’m sure automated resolution is also something being pursued. But what none of these tools try to do, as far as I can tell, is incident management.
The work of incident response always involves a group of engineers: some of them are officially on-call, and others are just jumping in to help. Incident management is the coordination work that helps this ad-hoc team of responders work together effectively to get the diagnostic and remediation work done. Because of this, we often say that incident response is a team sport. Incidents involve some sort of problem with the system as a whole, and because everybody in the organization only has partial knowledge of the whole system, we typically need to pool that knowledge together to make sense of what’s actually happening right now in the system. For example, if a database is currently being overloaded, the folks who own the database could tell you that there’s been a change in query pattern, but they wouldn’t be able to tell you why that change happened. For that, you’d need to talk to the team that owns the system that makes those queries.
Another reason why we need multiple people responding to incidents is that humans are prone to a problem known as fixation. You might know it by the more colloquial term tunnel vision. A person will look at a problem from a particular perspective, and that can be problematic if the person addressing the problem has a perspective that is not well-matched to solving that problem. You can even see fixation behavior in the current crop of LLM coding tools: they will sometimes keep going down an unproductive path in order to implement a feature or try to resolve an error. While I expect that future coding agents will suffer less from fixation, given that genuinely intelligent humans frequently suffer from this problem, I don’t think that we’ll ever see an individual coding agent get to the point where it completely avoids fixation traps.
One solution to the problem of fixation is to intentionally inject a diversity of perspectives by having multiple individuals attack the problem. In the case of AI coding tools, we deal with the problem of fixation by having a human supervise the work of the coding agent. The human spots when the agent falls down a fixation rabbit hole, and prompts the agent to pursue a different strategy in order to get it back on track. Another way to leverage multiple individuals to is to strategically have them pursue different strategies. For example, in the early oughts, there was a lot of empirical software engineering research into an approach called perspective-based reading for reviewing software artifacts like requirements or design documents. The idea is that you would have multiple reviewers, and you would explicitly assign a reviewer a particular perspective. For example, let’s say you wanted to get a requirements document reviewed. You could have one reviewer read it from the perspective of a user, another from the perspective of a designer, and a third from the perspective of a tester. The idea here is that reading from a different perspective would help identify different kinds of defects in the artifact.
Getting back to incidents, the problem of fixation arises when a responder latches on to one particular hypothesis about what’s wrong with the system, and continues following on that particular line of investigation, even though it doesn’t bear fruit. As discussed above, having responders with a diverse set of perspectives provides a defense against fixation. This may take the form of multiple lines of doing multiple lines of investigation, or even just somebody in the response asking a question like, “How do we know the problem isn’t Y rather than X?”
I’m convinced that an individual AI SRE agent will never be able to escape the problem of fixation, and so that incident response will necessarily involve multiple agents. Yes, there will be some incidents where a single AI agent is sufficient. But incident response is a 100% game: you need to recover from all of them. That means that eventually you’ll need to deploy a team of agents, whether they’re humans, AI, or a mix. And that means incident response will require coordination: in particular, maintaining common ground.
Maintaining common ground is active work
During an incident, many different things are happening at once. There are multiple signals that you need to keep track of, like “what’s the current customer impact?”, “is the problem getting better, worse, or staying the same?”, “what are the current hypotheses?”, “which graphs support or contradict those hypotheses?” The responders will be doing diagnostic work, and they’ll be performing interventions to the system, sometimes to try to mitigate (e.g., “roll back that feature flag that aligns in time”), and other times to support the diagnostic work (e.g., “we need to make a change to figure out if hypothesis X is actually correct.”)
The incident manager helps to maintain common ground: they make sure that everybody is on the same page, by doing things like helping bring people up to speed on what’s currently going on, and ensuring people know which lines of investigation are currently being pursued and who (if anyone) is currently pursuing them.
If a responder is just joining an incident, an AI SRE agent is extremely useful as a summary machine. You can ask it the question, “what’s going on?”, and it can give you a concise summary of the state of play. But this is a passive use case: you prompt it, and it gives a response. But because the state of the world is changing rapidly during the incident, the accuracy of that answer will decay rapidly with time. Keeping the current state of things up to date in the minds of the responders is an active struggle against entropy.
An effective AI incident manager would have to be able to identify what type of coordination help people need, and then provide that assistance. For example, the agent would have to be able to identify when the responders (be they human or agent) were struggling and then proactively take action to assist. It would need a model of the mental models of the responders to know when to act and what to action to take in order to re-establish common ground.
Perhaps there is work in the AI SRE space to automate this sort of coordination work. But if there is, I haven’t heard of it yet. The focus today is on creating individual responder agents. I think these agents will be an effective addition to an incident response team. I’d love it if somebody built an effective incident management AI bot. But it’s a big leap from AI SRE agent to AI incident management agent. And it’s not clear to me how well the coordination problem is understood by vendors today.
One of the surprising (at least to me) consequences of the fall of Twitter is the rise of LinkedIn as a social media site. I saw some interesting posts I wanted to call attention to:
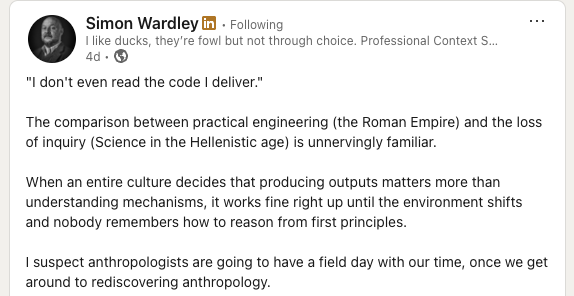
First, Simon Wardley on building things without understanding how they work:
A few years ago, I attended a national conference on technological literacy… One of the main speakers, a sociologist, presented data he had gathered in the form of responses to a questionnaire. After a detailed statistical analysis, he had concluded that we are a nation of technological illiterates. As an example, he noted how few of us (less than 20 percent) know how our telephone works.
This statement brought me up short. I found my mind drifting and filling with anxiety. Did I know how my telephone works?
I squirmed in my seat, doodled some, then asked myself, What does it mean to know how a telephone works? Does it mean knowing how to dial a local or long-distance number? Certainly I knew that much, but this does not seem to be the issue here.
No, I suspected the question to be understood at another level, as probing the respondent’s knowledge of what we might call the “physics of the device.”I called to mind an image of a diaphragm, excited by the pressure variations of speaking, vibrating and driving a coil back and forth within a a magnetic field… If this was what the speaker meant, then he was right: Most of us don’t know how our telephone works.
Indeed, I wondered, does [the speaker] know how his telephone works? Does he know about the heuristics used to achieve optimum routing for long distance calls? Does he know about the intricacies of the algorithms used for echo and noise suppression? Does he know how a signal is transmitted to and retrieved from a satellite in orbit? Does he know how AT&T, MCI, and the local phone companies are able to use the same network simultaneously? Does he know how many operators are needed to keep this system working, or what those repair people actually do when they climb a telephone pole? Does he know about corporate financing, capital investment strategies, or the role of regulation in the functioning of this expansive and sophisticated communication system?
Does anyone know how their telephone works?
There’s a technical interview question that goes along the lines of: “What happens when you type a URL into your browser’s address bar and hit enter?” You can talk about what happens at all sorts of different levels (e.g., HTTP, DNS, TCP, IP, …). But does anybody really understand all of the levels? Do you know about the interrupts that fire inside of your operating system when you actually strike the enter key? Do you know which modulation scheme being used by the 802.11ax Wi-Fi protocol in your laptop right now? Could you explain the difference between quadrature amplitude modulation (QAM) and quadrature phase shift keying (QPSK), and could you determine which one your laptop is currently using? Are you familiar with the relaxed memory model of the ARM processor? How garbage collection works inside of the JVM? Do you understand how the field effect transistors inside the chip implement digital logic?
I remember talking to Brendan Gregg about how he conducted technical interviews, back when we both worked at Netflix. He told me that he was interested in identifying the limits of a candidate’s knowledge, and how they reacted when they reached that limit. So, he’d keep asking deeper questions about their area of knowledge until they reached a point where they didn’t know anymore. And then he’d see whether they would actually admit “I don’t know the answer to that”, or whether they would bluff. He knew that nobody understood the system all of the way down.
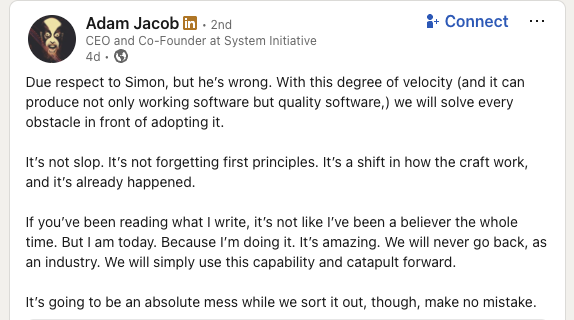
In their own ways, Wardley, Jacob, Perens, and Bucciarelli are all correct.
Wardley’s right that it’s dangerous to build things where we don’t understand the underlying mechanism of how they actually work. This is precisely why magic is used as an epithet in our industry. Magic refers to frameworks that deliberately obscure the underlying mechanisms in service of making it easier to build within that framework. Ruby on Rails is the canonical example of a framework that uses magic.
Jacob is right that AI is changing the way that normal software development work gets done. It’s a new capability that has proven itself to be so useful that it clearly isn’t going away. Yes, it represents a significant shift in how we build software, it moves us further away from how the underlying stuff actually works, but the benefits exceed the risks.
Perens is right that the scenario that Wardley fears has, in some sense, already come to pass. Modern CPU architectures and operating systems contain significant complexity, and many software developers are blissfully unaware of how these things really work. Yes, they have mental models of how the system below them works, but those mental models are incorrect in fundamental ways.
Finally, Bucciarelli is right that systems like telephony are so inherently complex, have been built on top of so many different layers in so many different places, that no one person can ever actually understand how the whole thing works. This is the fundamental nature of complex technologies: our knowledge of these systems will always be partial, at best. Yes, AI will make this situation worse. But it’s a situation that we’ve been in for a long time.
I was listening to Todd Conklin’s Pre-Accident Investigation Podcast the other day, to the episode titled When Normal Variability Breaks: The ReDonda Story. The name ReDonda in the title refers to ReDonda Vaught, an American registered nurse. In 2017, she was working at the Vanderbilt University Medical Center in Nashville when she unintentionally administered the wrong drug to a patient under her care, a patient who later died. Vaught was fired, then convicted by the state of Tennessee for criminally negligent homicide and abuse of an impaired adult. It’s a terrifying story, really a modern tale of witch-burning, but it’s not what this post is about. Instead, I want to home in a term from the podcast title: normal variability.
In the context of the field of safety, the term variability refers to how human performance is, well, variable. We don’t always do the work the exact same way. This variation happens between humans, where different people will do work in different ways. And the variation also happens within humans, the same person will perform a task differently over time. The sources of variation in human performance are themselves varied: level of experience, external pressures being faced by the person, number of hours of sleep the night before, and so on.
In the old view of safety, there is an explicitly safe way to perform the work, as specified in documented procedures. Follow the procedures, and incidents won’t happen. In the software world, these procedures might be: write unit tests for new code, have the change reviewed by a peer, run end-to-end tests in staging, and so on. Under this view of the world, variability is necessarily a bad thing. Since variability means people do work differently, and since safety requires doing work the proscribed way, human variability is a source of incidents. Traditional automation doesn’t have this variability problem: it always does the work the same way. Hence you get the old joke:
The factory of the future will have only two employees: a man and a dog. The man will be there to feed the dog.The dog will be there to keep the man from touching the equipment.
In the new view of safety, normal variability is viewed as an asset rather than a liability. In this view, the documented procedures for doing the work are always inadequate, they can never capture all of the messy details of real work. It is the human ability to adapt, to change the way that they do the work based on circumstances, that creates safety. That’s why you’ll hear resilience engineering folks use the (positive) term adaptive capacity rather than the (more neutral) human variability, to emphasize that human variability is, quite literally, adaptive. This is why tech companies still staff on-call rotations even though they have complex automation that is supposed to keep things up and running. It’s because the automation can never handle all of the cases that the universe will throw at it. Even sophisticated automation always eventually proves too rigid to be able to handle some particular circumstance that was never foreseen by the designers. This is the perfect-storm, weird-edge-case stuff that post-incident write-ups are made of.
This, again, brings us back to AI.
My own field of software development is being roiled by the adoption of AI-based coding tools like Anthropic’s Claude Code, OpenAI’s Codex, and Google’s Gemini Code Assist. These AI tools are rapidly changing the way that software is being developed, and you can read many blog posts of early adopters who are describing their experiences using these new tools. Just this week, there was a big drop in the market value of multiple software companies; I’ve already seen references to the beginning of the SaaS-Pocalypse, the idea being that companies will write bespoke tools using AI rather than purchasing software from vendors. The field of software development has seen a lot of change in terms of tooling in my own career, but one thing that is genuinely different about these AI-based tools is that they are inherently non-deterministic. You interact with these tools by prompting them, but the same prompt yields different results.
Non-determinism in software development tools is seen as a bad thing. The classic example of non-determinism-as-bad is flaky tests. A flaky test is non-deterministic: the same input may lead to a pass or a fail. Nobody wants non-determinism like this in our test suite. On the build side of things, we hope that our compiler emits the same instructions given the same source file and arguments. There’s even a whole movement around reproducible builds, the goal of which is to stamp out all of the non-determinism in the process of producing binaries from the original source code, where the ideal is achieving bit-for-bit identical binaries. Unsurprisingly, then, the non-determinism of the current breed of AI coding tools is seen as a problem. Here’s a quote from a recent article in the Wall Street Journal by Chip Cutter and Sebastian Herrera: Here’s Where AI Is Tearing Through Corporate America:
Satheesh Ravala is chief technology officer of Candescent, which makes digital technology used by banks and credit unions. He has fielded questions from employees about what innovations like Anthropic’s new features mean for the company, and responded by telling them banks rely on the company for software that does exactly what it’s supposed to every time—something AI struggles with.
“If I want to transfer $10,” he said, “it better be $10 not $9.99.”
I believe the AI coding tools are only going to improve with time, though I don’t feel confident in predicting whether future improvements will be orders-of-magnitude or merely incremental. What I do feel confident in predicting is that the non-determinism in these tools isn’t going away.
At their heart, these tools are sophisticated statistical models: they are prediction machines. When you’re chatting with one, it is predicting the next word to say, and then it feeds back the entire conversation so far, predicts the next word to say again, and so on. Because they are statistical models, there is some probability distribution of next word to predict. You could build the system to always choose the most likely word to say next. Statistical models aren’t just an AI thing, and many statistical models do use such a maximum likelihood approach. But that’s not what LLMs do in general. Instead, there’s some randomness that is intentionally injected into the system so that it doesn’t always just pick the most likely next word, but instead does a biased random selection of the next word, based on the statistical model of what’s most likely to come next, and based on a parameter called temperature, drawing an analogy to physics. If the temperature is zero, then the system always outputs the most likely next word. The higher the temperature, the more random the selection is.
What’s fascinating to me about this is the deliberate injection of randomness improved the output of the models, as judged qualitatively by humans. In other words, increasing the variability of the system improved outcomes.
Now, these LLMs haven’t achieved the level of adaptability that humans possess, though they can certainly perform some impressive cognitive tasks. I wouldn’t say they have adaptive capacity, and I firmly believe that humans will still need to be on-call for software system for the remainder of my career, despite the proliferation of AI SRE solutions. But what I am saying instead is that the ability of LLMs to perform cognitive tasks well depends upon them being able to leverage variability. And my prediction is that this dependence on variability isn’t going to go away. LLMs will get better, and they might even get much better, but I don’t think they’ll ever be deterministic. I think variability is an essential ingredient for a system to be able to perform these sorts of complex cognitive tasks.
There’s an old saying in software engineering, originally attributed to David Wheeler: We can solve any problem by introducing an extra level of indirection. The problem is that indirection adds complexity to a system. Just ask anybody who is learning C and is wrestling with the concept of pointers. Or ask someone who is operating an unfamiliar codebase and is trying to use grep to find the code that relates to certain log messages. Indirection is a powerful tool, but it also renders systems more difficult to reason about.
The old saying points at a more general phenomenon: our engineering solutions to problems invariably add complexity.
Spinning is hard
There was a fun example of this phenomenon that made it to Hacker News the other day. It was a post written by Clément Grégoire of siliceum titled Spinning around: Please don’t!. The post was about the challenges of implementing spin locks.
A spin lock is a type of lock where the thread spins in a loop waiting for the lock to be released so it can grab it. The appeal of a spin-lock is that it should be faster than a traditional mutex lock provided by the operating system: using a spin-lock saves you the performance cost of doing a context switch into the kernel. Grégoire’s initial C++ spin-lock implementation looks basically like this (I made some very minor style changes):
classSpinLock{
intis_locked = 0;
public:
voidlock(){
while(is_locked!=0){/* spin */}
is_locked = 1;
}
voidunlock(){is_locked = 0; }
}
As far as locking implementations go, this is a simple one. Unfortunately, it has all sorts of problems. Grégoire’s post goes on to describe these problems, as well as potential solutions, and additional problems created by those proposed solutions. Along the way, he mentions issues such as:
torn reads
race condition
high CPU utilization when not using the dedicated PAUSE (x86) or YIELD (arm) (spin loop hint) instruction
waiting for too long when using the dedicated instruction
contention across multiple cores attempting atomic writes
high cache coherency traffic across multiple core caches
excessive use of memory barriers
priority inversion
false sharing
Below is an implementation that Grégoire proposes to address these issues, with very slight modifications. Note that it requires a system call, so it’s operating-system-specific. He used Windows systems calls, so that’s why I used as well: on Linux, Grégoire notes that you can use the futex API.
(Note: I did not even try to run this code, it’s just to illustrate what the solution looks like)
#include<atomic>// for std::atomic
#include<Windows.h>// for WaitOnAddress, WakeByAddressSingle
WakeByAddressSingle(&is_locked); // Notify a potential thread waiting, if any
}
Yeesh, this is a lot more complex than our original solution! And yet, that complexity exists to address real problems. It uses dedicated hardware instructions for spin-looping more efficiently, it uses exponential backoff with jittering to reduce contention across cores, it takes into account memory ordering to eliminate unwanted barriers, and it uses special system calls to help the system calls schedule the threads more effectively. The simplicity of this initial solution was no match for the complexity of modern multi-core NUMA machines. No matter how simple that initial solution looked as a C++ program, the solution must interact with the complexity of the fundamental building blocks of compilers, operating systems, and hardware architecture.
Flying is even harder
Now let’s take an example from outside of software: aviation. Consider the following two airplanes: a WWI era Sopwith Camel, and a Boeing 787 Dreamliner.
While we debate endlessly over what we mean by complexity, I feel confident in claiming that the Dreamliner is a more complex airplane than the Camel. Heck, just look at the difference in the engines used by the two planes: the Clerget 9B for the Camel, and the GE GEnx for the Dreamliner.
But we’re also right to fear complexity. Complexity makes it harder for us humans to reason about the behavior of systems. Evolution has certainly accomplished remarkable things in designing biological systems: these systems are amazingly resilient. One thing they aren’t, though, is easy to understand, as any biology major will tell you.
Complexity also creates novel failure modes. The Dreamliner itself experienced safety issues related to electrical fires: a problem that Camel pilots never had to worry about. And there were outright crashes where software complexity was a contributing factor, such as Lion Air Flight 610, Ethiopian Airlines Flight 302 (both Boeing 737 MAX aircraft), and Air France Flight 447 (an Airbus A330).
Unfortunately for us, making systems more robust means adding complexity. An alternate formulation of the saying at the top of this post is: All problems in computer science can be solved by another level of indirection, except for the problem of too many layers of indirection. Complexity solves all problems except the problem of complexity.
The psychiatrist and cybernetician W. Ross Ashby expressed this phenomenon as a law, which he called the Law of Requisite Variety. Today it’s also known as Ashby’s Law. Ashby noted that when you’re building a control system, the more complex the problem space is, the more complex your controller needs to be. For example, a self-driving car is necessarily going to have a much more complex control system than a thermostat.
When faced with a complex problem, we have to throw complexity at it in order to solve it.
Homer had the right idea
This blog is called surfing complexity because I want to capture the notion that we will always have to deal with complexity: we can’t defeat it, but we can get better at navigating through it effectively.
And that brings us, of course, to AI.
Throwing complexity back at the computer
Modern LLM systems are enormously complex. OpenAI, Anthropic, and Google don’t publish parameter counts for their models anymore, but Meta’s Llama 4 has 17 billion active parameters, and either 109 or 400 billion total parameters, depending on the model. These systems are so complex that trying to understand their behavior looks more like biology research than engineering.
One type of task that LLMs are very good at solving are the kind of problem that exist solely because of computers in. For example, have you ever struggled to align content the right way in a Word document? It’s an absolute exercise in frustration. My wife threw this problem at an LLM and it fixed up the formatting for her. I’ve used LLMs for various tasks myself, including asking it do development tasks, and using it like a search engine to answer questions. And sometimes it works well, and sometimes it doesn’t. But where’ve find that these tools really shine is when I’ve got some batch of data, maybe a log file or a CSV or some JSON, and I want it do some processing task, like change the shape of it, or extract some data, so I can feed it into some other thing. I don’t ask it for the output directly, instead I ask it to generate a shell script or a Perl one-liner that’ll do the ad-hoc task, and then I run it. And, like the Word problem, I have a problem that was created by a computer that I need to solve.
I’m using this enormously complex system, an LLM, to help me solve a problem that was created by software complexity in the first place.
Back in March 2016, Tom Limoncelli wrote a piece for ACM Queue titled Automation Should Be Like Iron Man, Not Ultron. Drawing inspiration from John Allspaw in particular, and Cognitive Systems Engineering in general, Limoncelli argued that automation should be written to be directable by humans rather than acting fully independently. He drew an analogy to Iron Man’s suit being an example of good automation, and the robot villain Ultron being an example of bad automation. Iron Man’s suit enables him to do things he couldn’t do otherwise, but he remains in control of it, and he can direct it to do the things he needs it to do. Ultron is an autonomous agent that was built for defensive purposes but ends up behaving unexpectedly, causing more problems than it solves. But my recent experiences with LLMs have led me to a different analogy: Tron.
In the original movie, Tron is a good computer program that fights the bad computer programs. In particular, he’s opposed to the Master Control Program, an evil AI who is referred to as the MCP. (Incidentally, this is what a Gen Xer like me automatically thinks of when hearing the term “MCP”). Tron struggles against the MCP on behalf of the humans, who create and use the programs. He fights for the users.
I frequently describe my day-to-day work as “fighting with the computer”. On some days I win the fight, and on some days I lose. AI tools have not removed the need to fight with the computer to get my work done. But now I can send an AI agent to fight some of these battles for me. There’s a software agent who will fight with other software on my behalf. They haven’t reduced the overall complexity of the system. In fact, if you take into account the LLM’s complexity, the overall system complexity is much larger. But I’m deploying this complexity in an Ashby-ian sense, to help defeat other software complexity so I can get my work done. Like Tron, it fights for the user.


.jpg)
_(cropped).jpg)