The Journal of System and Software publishes a regular column called Dear Researchers: The perspective of software practitioners. Each column is an open letter to the software engineering research community from someone who works in tech. It’s edited by Austin Henley and Olaf Zimmermann, both of whom have experience in the two worlds of academia and industry.
…for the past month I’ve kept a journal where I put an “X” next to every date where a GitHub outage has negatively impacted my ability to work. Almost every day has an X. On the day I am writing this post, I’ve been unable to do any PR review for ~2 hours because there is a GitHub Actions outage. This is no longer a place for serious work if it just blocks you out for hours per day, every day.
The irony here is that GitHub, a centralized service, is built on top of git, a version control system that was designed by Linus Torvalds to be fully decentralized. I can’t read Torvalds mind, but I’m pretty sure that GitHub was not what he had in mind when he was developing git to support Linux kernel development. Which, of course, brings us to the pope.
We are called to reflect on the great “construction sites” of our era and ask: What are we building? – Pope Leo XIV
Pope Leo XIV just released an encyclical, Magnifica Humanitas. Now, I don’t usually write on the topic of papal encyclicals, since this isn’t a blog about religion, and I’m not even Catholic. However, this particular encyclical discusses technology in general, and artificial intelligence in particular.
For this reason, technological progress — valuable in itself — requires careful discernment of the anthropological vision that guides it and the ends it pursues.
In this encyclical, the pope encourages us to be deliberate about the kinds of technological projects that we work on: rebuilding the walls of Jerusalem is good, but building the Tower of Babel is not. He writes about the dangers of a technocratic perspective that is focused solely on matters such as efficiency, control, and profit, and neglects humanistic ends. AI isn’t neutral, argues the pope, because technologies are never neutral. The technologies reflect values that were made by the designers, either explicitly or implicitly.
In reality, every technical tool embodies choices and priorities through what it measures, ignores and optimizes, and how it classifies people and situations.
I bring up the encyclical not to argue in support or in opposition to the content, but to bring up a point that is frequently neglected when these sorts of discussions of technologies come up. Designers of technologies are not particularly good at predicting how those technologies will actually be used. Could Linus Torvalds have predicted the role that git would have had played in enabling GitHub to become a centralized point of failure? Heck, could AI researchers have predicted the fantastic success of LLM-powered code generation tools like Claude Code? In a sense, the technologist is worst-positioned to predict the impact of technology, because the intended use is so fixed in their minds, they are unable to imagine how others might use their technology in different ways or for different purposes. If you’ve ever seen a UI designer observe a usability study of their own designs, and you’ve seen the shock on their face as the user behaves in unexpected ways, you’ve seen this in action.
We engineers are trained on how to build things, but we’re not trained on how to predict the effects of the things that we build. Now, there is some lip service paid to this: when I was an undergraduate engineering student at McGill University, I had to select a single humanities course to cover my impact of technology on society requirement (I chose religious ethics and the environment, which is still being taught). But, really, that’s just a single course.
I frequently write in this blog about how the technologies we work with are fundamentally unpredictable, which is why incidents are unavoidable. But it’s not my intent to be a fatalist here about coming to grips with the impact that a particular technology may have. Instead, what I want to argue is that studying the impact of technology requires an additional set of skills beyond the ability to design technology.
We cut middle managers across the organization because AI allows us to have more direct reports per manager while still measuring and mentoring our teams effectively. – Matthew Prince, How I Choose Which Cloudflare Employees to Replace With AI
My PhD research involved studying programmer productivity for a very specific domain: high-performance computing, more commonly known as supercomputers. It turns out that supercomputers are difficult to program, and so the U.S. government was interested in assessing the productivity impact of different software engineering technologies (in my case, parallel programming languages), which is how the research got funded.
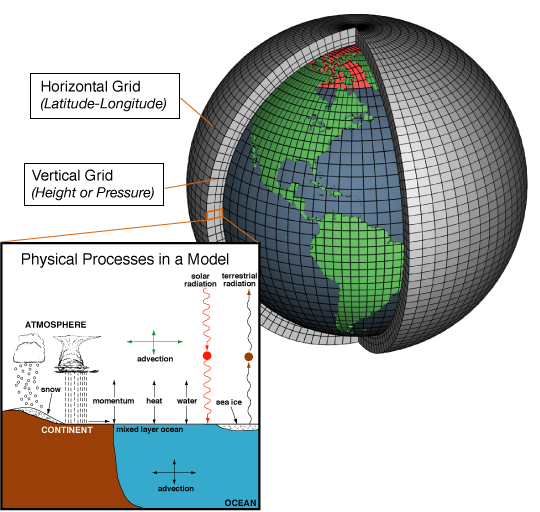
Since supercomputers are built by connecting together many processors in parallel, you might think that cloud computing providers like AWS obviate the need for supercomputers. Why should a lab buy a very expensive supercomputer when it can just rent compute time from Amazon and get access to the same kind of resources? But what makes a supercomputer isn’t just the processors, it’s also the network interconnect. And that’s because supercomputers are used for problems that require a lot of coordination among processors. For example, consider the problem of simulating the Earth’s climate. The earth is modeled by carving it up into a grid. The grid is divided up among the processors, which each simulate some local part of the grid. But these processors need to exchange data at the grid boundaries, and that involves coordination.
This type of coordination is expensive, because communicating over a network is much slower than communicating with local memory.
In general, as you scale up the number of workers, the coordination overhead increases. This is one of the reasons why we use thread pools rather than allowing an unbounded number of threads. If you keep spawning new threads, eventually the overhead that the operating system has to pay to maintain these threads exceeds the performance gains you get, and the extra threads actually hurt performance.
It’s well known that coordination costs increase with the number of agents involved in the system. This is why we spend more time in meetings in larger organizations, and why these organizations feel like they move so much slower than startups. Larger organizations have to pay the coordination cost of being larger.
With the rise of coding agents, our jobs as engineers is shifting from coding to managing these coding agents. We’re also not restricted to running a single agent, we can run multiple agents in parallel. By doing so, we can get more work done, since we’re not blocked waiting for one coding agent to complete its task. But now we’re not just managing a single agent, we’re coordinating the work of multiple agents. And, of course, we want to keep those agents busy doing useful work!
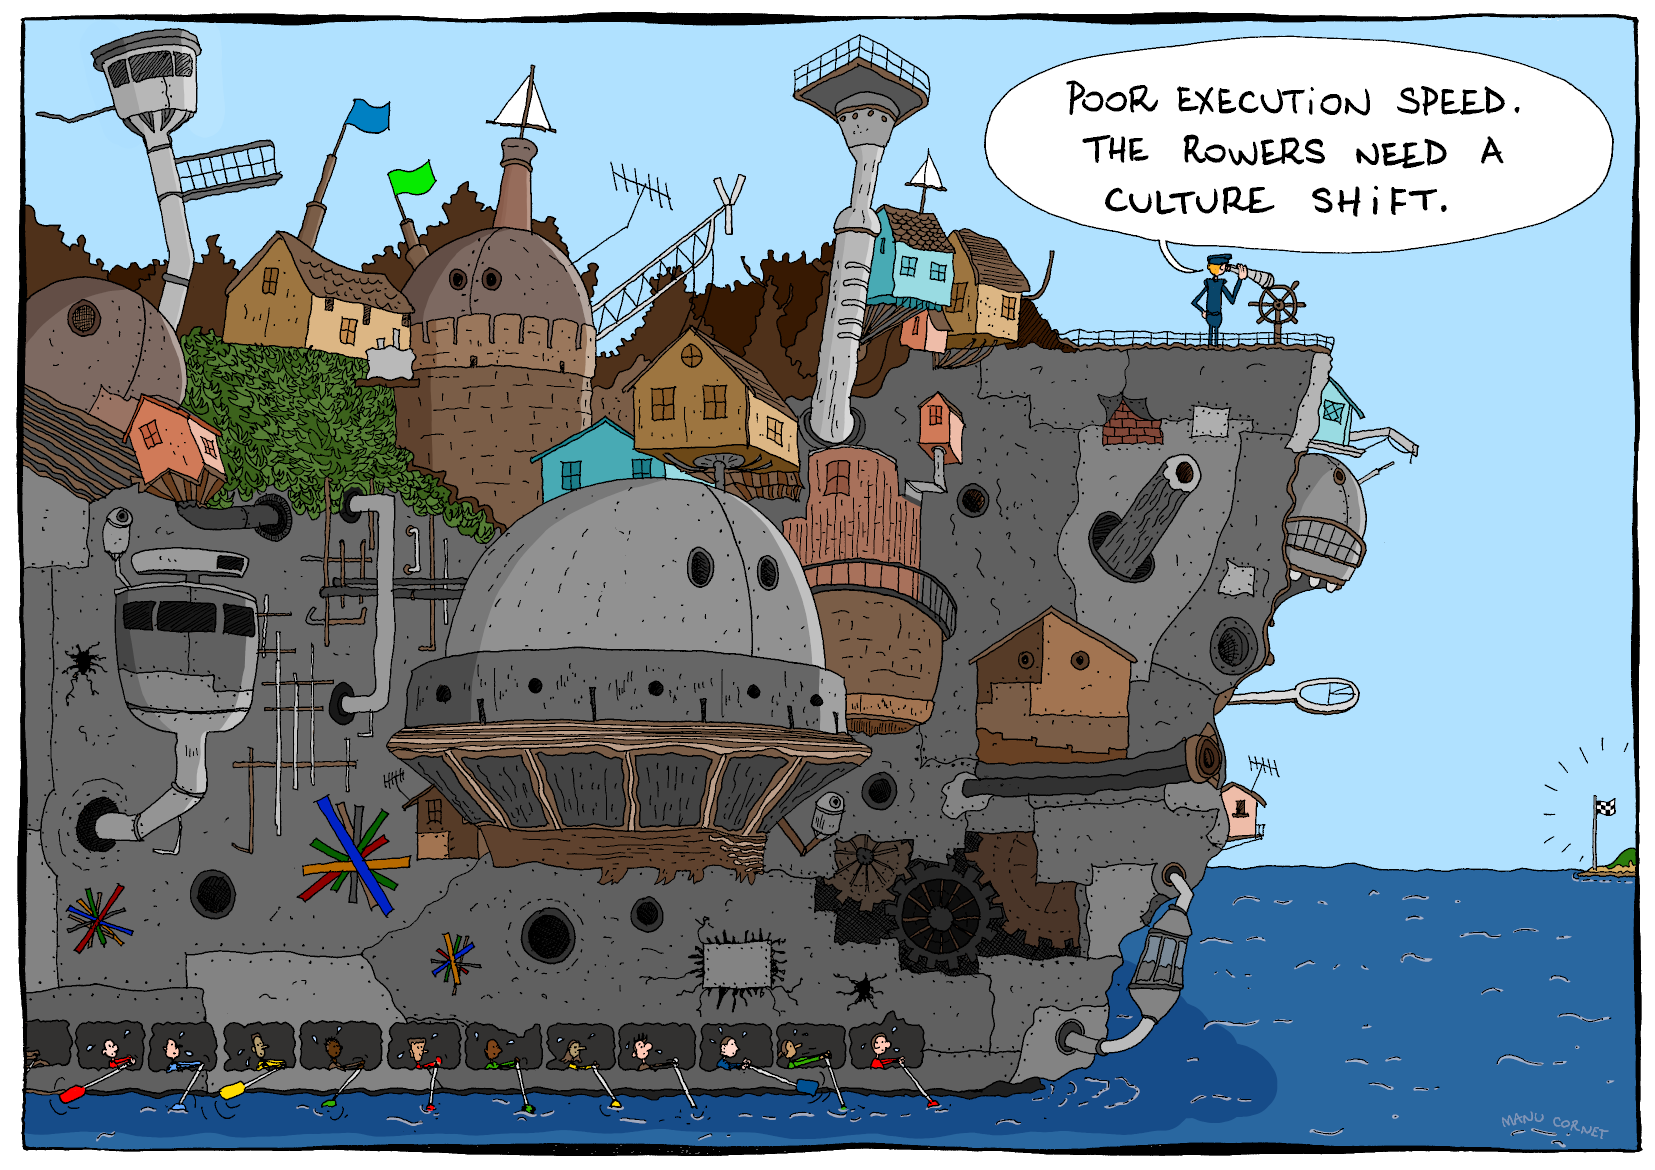
A metaphor for managing a set of agents
What this means is that we can expect that engineers will spend more of their time in the future doing coordination work among the agents that they manage. This is on top of the normal coordination work they do with other humans.
I opened this post with a quote from the CEO of Cloudflare, Matthew Prince, about reducing the number of managers in the company, and increasing the span of control of existing managers. They aren’t alone; Meta has also eliminating managers in their recent layoffs. Managers have always had to do coordination work, and as their span increases, they’ll have to do even more of that work. If they are expected to manage coding agents as well as humans, well, that’s yet more coordination work that will be poured on top of their existing load.
All of this new coordination effort represent a significant change in the day-to-day work of software engineering. And, take it from someone who does incident management: coordination is hard! I think this adjustment will be bumpier than people realize.
There’s an old saying in software engineering, originally attributed to David Wheeler: We can solve any problem by introducing an extra level of indirection. The problem is that indirection adds complexity to a system. Just ask anybody who is learning C and is wrestling with the concept of pointers. Or ask someone who is operating an unfamiliar codebase and is trying to use grep to find the code that relates to certain log messages. Indirection is a powerful tool, but it also renders systems more difficult to reason about.
The old saying points at a more general phenomenon: our engineering solutions to problems invariably add complexity.
Spinning is hard
There was a fun example of this phenomenon that made it to Hacker News the other day. It was a post written by Clément Grégoire of siliceum titled Spinning around: Please don’t!. The post was about the challenges of implementing spin locks.
A spin lock is a type of lock where the thread spins in a loop waiting for the lock to be released so it can grab it. The appeal of a spin-lock is that it should be faster than a traditional mutex lock provided by the operating system: using a spin-lock saves you the performance cost of doing a context switch into the kernel. Grégoire’s initial C++ spin-lock implementation looks basically like this (I made some very minor style changes):
classSpinLock{
intis_locked = 0;
public:
voidlock(){
while(is_locked!=0){/* spin */}
is_locked = 1;
}
voidunlock(){is_locked = 0; }
}
As far as locking implementations go, this is a simple one. Unfortunately, it has all sorts of problems. Grégoire’s post goes on to describe these problems, as well as potential solutions, and additional problems created by those proposed solutions. Along the way, he mentions issues such as:
torn reads
race condition
high CPU utilization when not using the dedicated PAUSE (x86) or YIELD (arm) (spin loop hint) instruction
waiting for too long when using the dedicated instruction
contention across multiple cores attempting atomic writes
high cache coherency traffic across multiple core caches
excessive use of memory barriers
priority inversion
false sharing
Below is an implementation that Grégoire proposes to address these issues, with very slight modifications. Note that it requires a system call, so it’s operating-system-specific. He used Windows systems calls, so that’s why I used as well: on Linux, Grégoire notes that you can use the futex API.
(Note: I did not even try to run this code, it’s just to illustrate what the solution looks like)
#include<atomic>// for std::atomic
#include<Windows.h>// for WaitOnAddress, WakeByAddressSingle
WakeByAddressSingle(&is_locked); // Notify a potential thread waiting, if any
}
Yeesh, this is a lot more complex than our original solution! And yet, that complexity exists to address real problems. It uses dedicated hardware instructions for spin-looping more efficiently, it uses exponential backoff with jittering to reduce contention across cores, it takes into account memory ordering to eliminate unwanted barriers, and it uses special system calls to help the system calls schedule the threads more effectively. The simplicity of this initial solution was no match for the complexity of modern multi-core NUMA machines. No matter how simple that initial solution looked as a C++ program, the solution must interact with the complexity of the fundamental building blocks of compilers, operating systems, and hardware architecture.
Flying is even harder
Now let’s take an example from outside of software: aviation. Consider the following two airplanes: a WWI era Sopwith Camel, and a Boeing 787 Dreamliner.
While we debate endlessly over what we mean by complexity, I feel confident in claiming that the Dreamliner is a more complex airplane than the Camel. Heck, just look at the difference in the engines used by the two planes: the Clerget 9B for the Camel, and the GE GEnx for the Dreamliner.
But we’re also right to fear complexity. Complexity makes it harder for us humans to reason about the behavior of systems. Evolution has certainly accomplished remarkable things in designing biological systems: these systems are amazingly resilient. One thing they aren’t, though, is easy to understand, as any biology major will tell you.
Complexity also creates novel failure modes. The Dreamliner itself experienced safety issues related to electrical fires: a problem that Camel pilots never had to worry about. And there were outright crashes where software complexity was a contributing factor, such as Lion Air Flight 610, Ethiopian Airlines Flight 302 (both Boeing 737 MAX aircraft), and Air France Flight 447 (an Airbus A330).
Unfortunately for us, making systems more robust means adding complexity. An alternate formulation of the saying at the top of this post is: All problems in computer science can be solved by another level of indirection, except for the problem of too many layers of indirection. Complexity solves all problems except the problem of complexity.
The psychiatrist and cybernetician W. Ross Ashby expressed this phenomenon as a law, which he called the Law of Requisite Variety. Today it’s also known as Ashby’s Law. Ashby noted that when you’re building a control system, the more complex the problem space is, the more complex your controller needs to be. For example, a self-driving car is necessarily going to have a much more complex control system than a thermostat.
When faced with a complex problem, we have to throw complexity at it in order to solve it.
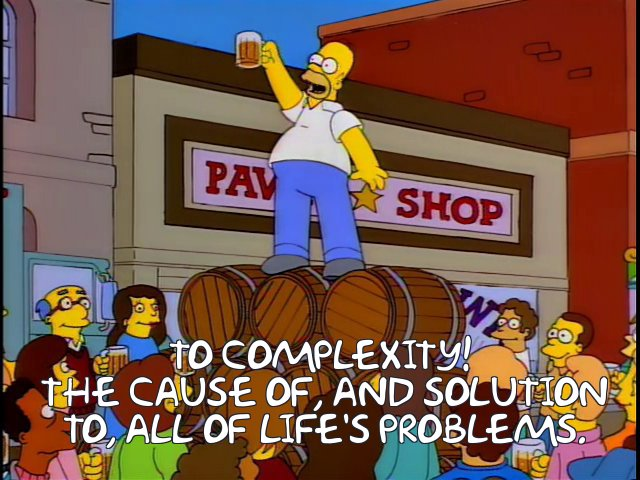
Homer had the right idea
This blog is called surfing complexity because I want to capture the notion that we will always have to deal with complexity: we can’t defeat it, but we can get better at navigating through it effectively.
And that brings us, of course, to AI.
Throwing complexity back at the computer
Modern LLM systems are enormously complex. OpenAI, Anthropic, and Google don’t publish parameter counts for their models anymore, but Meta’s Llama 4 has 17 billion active parameters, and either 109 or 400 billion total parameters, depending on the model. These systems are so complex that trying to understand their behavior looks more like biology research than engineering.
One type of task that LLMs are very good at solving are the kind of problem that exist solely because of computers in. For example, have you ever struggled to align content the right way in a Word document? It’s an absolute exercise in frustration. My wife threw this problem at an LLM and it fixed up the formatting for her. I’ve used LLMs for various tasks myself, including asking it do development tasks, and using it like a search engine to answer questions. And sometimes it works well, and sometimes it doesn’t. But where’ve find that these tools really shine is when I’ve got some batch of data, maybe a log file or a CSV or some JSON, and I want it do some processing task, like change the shape of it, or extract some data, so I can feed it into some other thing. I don’t ask it for the output directly, instead I ask it to generate a shell script or a Perl one-liner that’ll do the ad-hoc task, and then I run it. And, like the Word problem, I have a problem that was created by a computer that I need to solve.
I’m using this enormously complex system, an LLM, to help me solve a problem that was created by software complexity in the first place.
Back in March 2016, Tom Limoncelli wrote a piece for ACM Queue titled Automation Should Be Like Iron Man, Not Ultron. Drawing inspiration from John Allspaw in particular, and Cognitive Systems Engineering in general, Limoncelli argued that automation should be written to be directable by humans rather than acting fully independently. He drew an analogy to Iron Man’s suit being an example of good automation, and the robot villain Ultron being an example of bad automation. Iron Man’s suit enables him to do things he couldn’t do otherwise, but he remains in control of it, and he can direct it to do the things he needs it to do. Ultron is an autonomous agent that was built for defensive purposes but ends up behaving unexpectedly, causing more problems than it solves. But my recent experiences with LLMs have led me to a different analogy: Tron.
In the original movie, Tron is a good computer program that fights the bad computer programs. In particular, he’s opposed to the Master Control Program, an evil AI who is referred to as the MCP. (Incidentally, this is what a Gen Xer like me automatically thinks of when hearing the term “MCP”). Tron struggles against the MCP on behalf of the humans, who create and use the programs. He fights for the users.
I frequently describe my day-to-day work as “fighting with the computer”. On some days I win the fight, and on some days I lose. AI tools have not removed the need to fight with the computer to get my work done. But now I can send an AI agent to fight some of these battles for me. There’s a software agent who will fight with other software on my behalf. They haven’t reduced the overall complexity of the system. In fact, if you take into account the LLM’s complexity, the overall system complexity is much larger. But I’m deploying this complexity in an Ashby-ian sense, to help defeat other software complexity so I can get my work done. Like Tron, it fights for the user.
If you’ve ever worked at a larger organization, stop me if you’ve heard (or asked!) any of these questions:
“Why do we move so slowly as an organization? We need to figure out how to move more quickly.”
“Why do we work in silos? We need to figure out how to break out of these.”
“Why do we spend so much of our time in meetings? We need to explicitly set no-meeting days so we can actually get real work done.”
“Why do we maintain multiple solutions for solving what’s basically the same problem? We should just standardize on one solution instead of duplicating work like this.”
“Why do we have so many layers of management? We should remove layers and increase span of control.”
“Why are we constantly re-org’ing? Re-orgs so disruptive.”
(As an aside, my favorite “multiple solutions” example is workflow management systems. I suspect that every senior-level engineer has contributed code to at least one home-grown workflow management system in their career).
The answer to all of these questions is the same: because coordination is expensive. It requires significant effort for a group of people to work together to achieve a task that is too large for them to accomplish individually. And the more people that are involved, the higher that coordination effort grows. This is both “effort” in terms of difficulty (effortful as hard), and in terms of time (engineering effort, as measured in person-hours). This is why you see siloed work and multiple systems that seem to do the same thing. It’s because it requires less effort to work within your organization then to coordinate across organization, the incentive is to do localized work whenever possible, in order to reduce those costs.
Time spent in meetings is one aspect of this cost, which is something people acutely feel, because it deprives them of their individual work time. But the meeting time is still work, it’s just unsatisfying-feeling coordination work. When was the last time you talked about your participation in meetings in your annual performance review? Nobody gets promoted for attending meetings, but we humans need them to coordinate our work, and that’s why they keep happening. As organizations grow, they require more coordination, which means more resources being put into coordination mechanisms, like meetings and middle management. It’s like an organizational law of thermodynamics. It’s why you’ll hear ICs at larger organizations talk about Tanya Reilly’s notion of glue work so much. You’ll hear companies run “One <COMPANY NAME>” campaigns at larger companies as an attempt to improve coordination; I remember the One SendGrid campaign back when I worked there.
Because of the challenges of coordination, there’s a brisk market in coordination tools. Some examples off the top of my head include: Gantt charts, written specifications, Jira, Slack, daily stand-ups, OKRs, kanban boards, Asana, Linear, pull requests, email, Google docs, Zoom, I’m sure you could name dozens more, including some that are no longer with us. (Remember Google Wave?). Heck, both spoken and written language are the ultimately communication ur-tools.
And yet, despite the existence of all of those tools, it’s still hard to coordinate. Remember back in 2002 when Google experimented with eliminating engineering managers? (“That experiment lasted only a few months“). And then in 2015 when Zappos experimented with holacracy? (“Flat on paper, hierarchy in practice.“) I don’t blame them for trying different approaches, but I’m also not surprised that these experiments failed. Human coordination is just fundamentally difficult. There’s no one weird trick that is going to make the problem go away.
I think it’s notable that large companies try different strategies to try to manage ongoing coordination costs. Amazon is famous for using a decentralization strategy, they have historically operated almost like a federation of independent startups, and enforce coordination through software service interfaces, as described in Steve Yegge’s famous internal Google memo. Google, on the other hand, is famous for using an invest-heavily-in-centralized-tooling approach to coordination. But there are other types of coordination that are outside of the scope of these sorts of solutions, such as working on an initiative that involves work from multiple different teams and orgs. I haven’t worked inside of either Amazon or Google, so I don’t know how well things work in practice there, but I bet employees have some great stories!
During incidents, coordination becomes an acute problem, and we humans are pretty good at dealing with acute problems. The organization will explicitly invest in an incident manager on-call rotation to help manage those communication costs. But coordination is also a chronic problem in organizations, and we’re just not as good at dealing with chronic problems. The first step, though, is recognizing the problem. Meetings are real work. That work is frequently done poorly, but that’s an argument for getting better at it. Because that’s important work that needs to get done. Oh, also, those people doing glue work have real value.
I hadn’t heard of James Moylan until I read a story about him in the Wall Street Journal after he passed away in December, but it turns out my gaze had fallen on one his designs almost every day of my adult life. Moylan was the designer at Ford who came up with the idea of putting an arrow next to the gas tank symbol to indicate which side of the car the tank was on. It’s called the Moylan Arrow in his honor.
The Moylan Arrow put me in mind of another person we lost in 2025, the safety researcher James Reason. If you’ve heard of James Reason, it’s probably because of the Swiss cheese model of accidents that Reason proposed. But Reason made other conceptual contributions to the field of safety, such as organizational accidentsand resident pathogens. The contribution that inspired this post was his model of human error described in his book Human Error. The model is technically called the Generic Error-Modeling System (GEMS), but I don’t know if anybody actually refers to it by that name. And the reason GEMS came to mind was because Reason’s model was itself built on top of another researcher’s model of human performance, Jens Rasmussen’s Skills, Rules and Knowledge (SRK) model.
Rasmussen was trying to model how skilled operators perform tasks, how they process information in order to do so, and how user interfaces like control panels could better support their work. He worked at a Danish research lab focused on atomic energy, and his previous work included designing a control room for a Danish nuclear reactor, as well as studying how technicians debugged problems in electronics circuits.
The part of the SRK model that I want to talk about here is the information processing aspect. Rasmussen draws a distinction between three different types of information, which he labels signals, signs, and symbols.
The signal is the most obvious type of visual information to absorb, where there is minimal interpretation required to make sense of the signal. Consider the example of the height of mercury in a thermometer to observe the temperature. There’s a direct mapping between the visual representation of the sensor and the underlying phenomenon in the environment – a higher level of mercury means a hotter temperature.
A sign requires some background knowledge in order to interpret the visual information, but once you have internalized that information, you will be able to very quickly to interpret its meaning sign. Traffic lights are one such example: there’s no direct physical relationship between a red-colored light and the notion of “stop”, it’s an indirect association, mediated by cultural knowledge.
A symbol requires more active cognitive work in order to make sense of. To take an example from my own domain, reading the error logs emitted by a service would be an example of a task that involves visual information processing of symbols. Interpreting log error messages are much more laborious than, say, interpreting a spike in an error rate graph.
(Note: I can’t remember exactly where I got the thermometer and traffic light examples from, but I suspect it was from A Meaning Processing Approach to Cognition by John Flach and Fred Voorhost).
From his paper, Rasmussen describes signals as representing continuous variables. That being said, I propose the Moylan arrow as a great example of a signal, even though the arrow does not represent a continuous variable. Moylan’s arrow doesn’t require background knowledge to learn how to interpret it, because there’s a direct mapping between the direction the triangle is pointing and the location of the gas tank.
Rasmussen maps these three types of information processing to three types of behavior (signals relate to skill-based behavior, signs relate to rule-based behavior, and symbols relate to knowledge-based behavior). James Reason created an error taxonomy based on these different behaviors. In Reason’s terminology, slips and lapses happen at the skill-based level, rule-based mistakes happen at the rule-based level, and knowledge-based mistakes happen at the knowledge-based level.
Rasmussen’s original SRK paper is a classic of the field. Even though it’s forty years old, because the focus is on human performance and information processing, I think it’s even more relevant today than when it was originally published: thanks to open source tools like Grafana and the various observability vendors out there, there are orders of magnitude more operator dashboards being designed today than there were back in the 1980s. While we’ve gotten much better at being able to create dashboards, I don’t think my field has advanced much at being able to create effective dashboards.
Here’s a stylized model of work processes and outcomes. I’m going to call it “Model I”.
Model I: Work process and outcomes
If you do work the right way, that is, follow the proper processes, then good things will happen. And, when we don’t, bad things happen. I work in the software world, so by “badoutcome” a mean an incident, and by “doing the right thing”, the work processes typically refer to software validation activities, such as reviewing pull requests, writing unit tests, manually testing in a staging environment. But it also includes work like adding checks in the code for unexpected inputs, ensuring you have an alert defined to catch problems, having someone else watching over your shoulder when you’re making a risky operational change, not deploying your production changes on a Friday, and so on. Do this stuff, and bad things won’t happen. Don’t do this stuff, and bad things will.
If you push someone who believes in this model, you can get them to concede that sometimes nothing bad happens even though someone didn’t do everything can quite right, the amended model looks like this:
Inevitably, an incident happens. At that point, we focus the post-incident efforts on identifying what went wrong with the work. What was the thing that was done wrong? Sometimes, this is individuals who weren’t following the process (deployed on a Friday afternoon!). Other times, the outcome of the incident investigation is a change in our work processes, because the incident has revealed a gap between “doing the right thing” and “our standard work processes”, so we adjust our work processes to close the gap. For example, maybe we now add an additional level of review and approval for certain types of changes.
Here’s an alternative stylized model of work processes and outcomes. I’m going to call it “Model II”.
Model II: work processes and outcomes
Like our first model, this second model contains two categories of work processes. But the categories here are different. They are:
What people are officially supposed to
What people actually do
The first categorization is an idealized view of how the organization thinks that people should do their work. But people don’t actually do their work their way. The second category captures what the real work actually is.
This second model of work and outcomes has been embraced by a number of safety researchers. I deliberately called my models as Model I and Model II as a reference to Safety-I and Safety-II. Safety-II is a concept developed by the resilience engineering researcher Dr. Erik Hollnagel. The human factor experts Dr. Todd Conklin and Bob Edwards describe this alternate model using a black-line/blue-line diagram. Dr. Steven Shorrock refers to the first category as work-as-prescribed, and the second category as work-as-done. In our stylized model, all outcomes come from this second category of work, because it’s the only one that captures the actual work that leads to any of the outcomes. (In Shorrock’s more accurate model, the two categories of work overlap, but bear with me here).
This model makes some very different assumptions about the nature of how incidents happen! In particular, it leads to very different sorts of questions.
The first model is more popular because it’s more intuitive: when bad things happen, it’s because we did things the wrong way, and that’s when we look back in hindsight to identify what those wrong ways were. The second model requires us to think more about the more common case when incidents don’t happen. After all, we measure our availability in 9s, which means the overwhelming majority of the time, bad outcomes aren’t happening. Hence, Hollnagel encourages us to spend more time examining the common case of things going right.
Because our second model assumes that what people actually do usually leads to good outcomes, it will lead to different sorts of questions after an incident, such as:
What does normal work look like?
How is it that this normal work typically leads to successful outcomes?
What was different in this case (the incident) compared to typical cases?
Note that this second model doesn’t imply that we should always just keep doing things the same way we always do. But it does imply that we should be humble in enforcing changes to the way work is done, because the way that work is done today actually leads to good outcomes most of the time. If you don’t understand how things normally work well, you won’t see how your intervention might make things worse. Just because your last incident was triggered by a Friday deploy doesn’t mean that banning Friday deploys will lead to better outcomes. You might actually end up making things worse.
every dashboard is a sunk cost every dashboard is an answer to some long-forgotten question every dashboard is an invitation to pattern-match the past instead of interrogate the present every dashboard gives the illusion of correlation every dashboard dampens your thinking https://t.co/OIEowa1COa
It’s true: the dashboards we use today for doing operational diagnostic work are … let’s say suboptimal. Charity Majors is one of the founders of Honeycomb, one of the newer generation of observability tools. I’m not a Honeycomb user myself, so I can’t say much intelligently about the product. But my naive understanding is that the primary way an operator interacts with Honeycomb is by querying it. And it sounds like a very nifty tool for doing that, I’ve certainly felt the absence of being able do high-cardinality queries when trying to narrow down where a problem is, and I would love to have access to a tool like that.
But we humans didn’t evolve to query our environment, we evolved to navigate it, and we have a very sophisticated visual system to help us navigate a complex world. Honeycomb does leverage the visual system by generating visualizations, but you submit the query first, and then you get the visualization.
In principle, a well-designed dashboard would engage our visual system immediately: look first, get a clue about where to look next, and then take the next diagnostic step, whether that’s explicitly querying, or navigating to some other visualization. The problem, which Charity illustrates in her tweet, is that we consistently design our dashboards poorly. Given how much information is potentially available to us, we aren’t good at designing dashboards that work well with our human brains to help us navigate all of that information.
Dashboard research of yore
Now, back in the 80s and 90s, for many physical systems that were supervised by operators (think: industrial control systems, power plants, etc.), dashboards was all they had. And there was some interesting cognitive systems engineering research back then about how to design dashboards that took into account what we knew about the human perceptual and cognitive systems.
For example, there was a proposed approach for designing user interfaces for operators called ecological interface design, by Kim Vicente and Jens Rasmussen. Vicente and Rasmussen were both engineering researchers who worked in human factors (Vicente’s background was in industrial and mechanical engineering, Rasmussen’s in electronic engineering). They co-wrote an excellent paper titled Ecological Interface Design: Theoretical Foundations. Ecological Interface Design builds on Rasmussen’s previous work on the abstraction hierarchy, which he developed based on studying how technicians debugged electronic circuits. It also builds on his skills, rules, and knowledge (SRK) framework.
I’m not aware of anyone in our industry working on the “how do we design better dashboards?” question today. As far as I can tell, discussions around observability these days center more around platform-y questions, like:
What kinds of observability data should we collect?
You check your instrumentation, or you watch your SLOs. If something looks off, you see what all the mysterious events have in common, or you start forming hypotheses, asking a question, considering the result, and forming another one based on the answer. You interrogate your systems, following the trail of breadcrumbs to the answer, every time.
You don’t have to guess or rely on elaborate, inevitably out-of-date mental models. The data is right there in front of your eyes. The best debuggers are the people who are the most curious.
Your debugging questions are analysis-first: you start with your user’s experience.
I’d like to see our industry improve the check your instrumentation part of that to make it easier to identify if something looks off, providing cues about where to look next. To be explicit:
I always want the ability to query my system in the way that Honeycomb supports, with high-cardinality drill-down and correlations.
I always want to start off with a dashboard, not a query interface
In other words, I always want to start off with a dashboard, and use that as a jumping-off point to do queries.
And, maybe there are folks out there in observability-land working on how to improve dashboard design. But, if so, I’m not aware of that work. Just looking at the schedule from Monitorama 2024, the word “dashboard” does not even appear at once.
And that makes me sad. Because, while not everyone has access to tooling like Honeycomb, everyone has access to dashboards. And the state-of-the-dashboard doesn’t seem like it’s going to get any better anytime soon.
We’re thrilled that you want to contribute to improving the system in the wake of an incident! For each post-incidentaction that you are proposing, we would appreciate it if you would fill out the following template.
Please estimate the expected benefits associated with implementing the action item. For example, if this reduces risk, by how much? Please document your risk model. How will you validate this estimate?
Please estimate the costs associated with implementing the proposed action items. In particular:
What are the costs in engineering effort (person-days of work) to do the initial implementation?
What are the ongoing maintenance costs in terms of engineering effort?
What are the additional infrastructure costs?
In addition, please estimate the opportunity costs associated with this action item: if this action item is prioritized, what other important work will be deprioritized as a result? What were the expected benefits of the deprioritized work? How do these unrealized benefits translate into additional costs or risks?
Given that we know we can never implement things perfectly (otherwise the incident wouldn’t have happened, right?), what are the risks associated with a bug or other error when implementing the proposed action item?
Even if the action item is implemented flawlessly, the resulting change in behavior can lead to unforeseen interactions with other parts of the system. Please generate a list of potential harmful interactions that could arise when this action item is implemented. Please be sure to track these and refer back to them if a future incident occurs that involves this action item, to check how well we are able to reason about such interactions.
More generally: will the proposed action item increase or decrease the overall complexity of the system? If it will increase complexity, compare what the costs and/or risks are of the resulting increase in complexity, and compare these to the proposed benefits of the implemented action item.
Will the proposed action item increase or decrease the overall cognitive load on people? If it will increase cognitive load, please estimate the expected magnitude of this increase, and document a plan for evaluating the actual increase after the action item has been implemented.
Beyond cognitive load, is this action going to prevent or otherwise make more difficult any work that goes on today? How will you identify whether this is the case or not? Please document your plan for measuring the resultant increase in difficulty due to the action item.
More generally: will the implementation of this action item lead to people changing the way they do they work? What sort of workarounds or other adaptations may occur as a result, and what are the associated risks of these? What are all of the different types of work that go on in the organization that will be impacted by this change? How will you verify that your list is complete? Please document your plan for studying how the work has actually changed in response to this action item, and how you will contrast the findings with your expectations.
Once the action item has been completed, how are you going to track it unexpectedly contributes to an incident in the future? Please outline your plan for how we will maintain accountability for the impact of completed action items.
Imagine you wanted to understand how to get better at playing the lottery. You strike upon a research approach: study previous lottery winners! You collect a list of winners, look them up, interview them about how they go about choosing their numbers, collate this data, identify patterns, and use these to define strategies for picking numbers.
The problem with this approach is that it doesn’t tell you anything about how effective these strategies actually are. To really know how well these strategies work, you’d have to look at the entire population of people who employed them. For example, say that you find that most lottery winners use their birthdays to generate winning numbers. It may turn out, that for every winning ticket that has the ticket holder’s birthday, there are 20 million losing tickets that also have the ticket holder’s birthday. To understand a strategy’s effectiveness, you can’t just look at the winning outcomes: you have to look at the losing outcomes as well.The technical term for this type of analytic error is selecting on the dependent variable.
Here’s another example of this error in reasoning: according to the NHTSA, 32% of all traffic crash fatalities in the United States involve drunk drivers. That means that 68% of all traffic crash fatalities involve sober drivers. If you only look at scenarios that involve crash fatalities, it looks like being sober is twice as dangerous as being drunk! It’s a case of only looking at the dependent variable: crash fatalities. If we were to look at all driving scenarios, we’d see that there are a lot more sober drivers than drunk drivers, and that any given sober driver is less likely to get into a crash fatality than a given drunk driver. Being sober is safer, even though sober drivers appear more often in fatal accidents than drunk drivers.
Now, imagine an organization that holds a weekly lottery. But it’s a bizarro-world type of lottery: if someone wins, then they receive a bad outcome instead of a good one. And the bad outcome doesn’t just impact the “winner” (although they are impacted the most), it has negative consequences for the entire organization. Nobody would willingly participate in such a lottery, but everyone in the organization is required to: you can’t opt out. Every week, you have to buy a ticket, and hope the numbers you picked don’t come up.
The organization wants to avoid these negative outcomes, and so they try to identify patterns in how previous lottery “winners” picked their numbers, so that they can reduce the likelihood of future lottery wins by warning people against using these dangerous number-picking strategies.
At this point, the comparison to how we treat incidents should be obvious. If we only examine people’s actions in the wake of an incident, and not when things go well, then we fall into the trap of selecting on the dependent variable.
The real-world case is even worse than the lottery case: lotteries really are random, but that way that people do their work isn’t; rather, it’s adaptive. People do work in specific ways because they have found that it’s an effective way to get stuff done given that the constraints that they are under. The only way to really understand why people work the way they do is to understand how those adaptations usually succeed. Unless you’re really looking for it, you aren’t going to be able to learn how people develop successful adaptations if you only ever examine the adaptations when they fail. Otherwise, you’re just doing the moral equivalent of asking what lottery winners have in common.


.jpg)
_(cropped).jpg)