This past week at SREcon 2026 Americas, I gave a plenary talk titled The Power of Stories. I referenced several books and papers in that talk, which are linked below.
I was listening to Todd Conklin’s Pre-Accident Investigation Podcast the other day, to the episode titled When Normal Variability Breaks: The ReDonda Story. The name ReDonda in the title refers to ReDonda Vaught, an American registered nurse. In 2017, she was working at the Vanderbilt University Medical Center in Nashville when she unintentionally administered the wrong drug to a patient under her care, a patient who later died. Vaught was fired, then convicted by the state of Tennessee for criminally negligent homicide and abuse of an impaired adult. It’s a terrifying story, really a modern tale of witch-burning, but it’s not what this post is about. Instead, I want to home in a term from the podcast title: normal variability.
In the context of the field of safety, the term variability refers to how human performance is, well, variable. We don’t always do the work the exact same way. This variation happens between humans, where different people will do work in different ways. And the variation also happens within humans, the same person will perform a task differently over time. The sources of variation in human performance are themselves varied: level of experience, external pressures being faced by the person, number of hours of sleep the night before, and so on.
In the old view of safety, there is an explicitly safe way to perform the work, as specified in documented procedures. Follow the procedures, and incidents won’t happen. In the software world, these procedures might be: write unit tests for new code, have the change reviewed by a peer, run end-to-end tests in staging, and so on. Under this view of the world, variability is necessarily a bad thing. Since variability means people do work differently, and since safety requires doing work the proscribed way, human variability is a source of incidents. Traditional automation doesn’t have this variability problem: it always does the work the same way. Hence you get the old joke:
The factory of the future will have only two employees: a man and a dog. The man will be there to feed the dog.The dog will be there to keep the man from touching the equipment.
In the new view of safety, normal variability is viewed as an asset rather than a liability. In this view, the documented procedures for doing the work are always inadequate, they can never capture all of the messy details of real work. It is the human ability to adapt, to change the way that they do the work based on circumstances, that creates safety. That’s why you’ll hear resilience engineering folks use the (positive) term adaptive capacity rather than the (more neutral) human variability, to emphasize that human variability is, quite literally, adaptive. This is why tech companies still staff on-call rotations even though they have complex automation that is supposed to keep things up and running. It’s because the automation can never handle all of the cases that the universe will throw at it. Even sophisticated automation always eventually proves too rigid to be able to handle some particular circumstance that was never foreseen by the designers. This is the perfect-storm, weird-edge-case stuff that post-incident write-ups are made of.
This, again, brings us back to AI.
My own field of software development is being roiled by the adoption of AI-based coding tools like Anthropic’s Claude Code, OpenAI’s Codex, and Google’s Gemini Code Assist. These AI tools are rapidly changing the way that software is being developed, and you can read many blog posts of early adopters who are describing their experiences using these new tools. Just this week, there was a big drop in the market value of multiple software companies; I’ve already seen references to the beginning of the SaaS-Pocalypse, the idea being that companies will write bespoke tools using AI rather than purchasing software from vendors. The field of software development has seen a lot of change in terms of tooling in my own career, but one thing that is genuinely different about these AI-based tools is that they are inherently non-deterministic. You interact with these tools by prompting them, but the same prompt yields different results.
Non-determinism in software development tools is seen as a bad thing. The classic example of non-determinism-as-bad is flaky tests. A flaky test is non-deterministic: the same input may lead to a pass or a fail. Nobody wants non-determinism like this in our test suite. On the build side of things, we hope that our compiler emits the same instructions given the same source file and arguments. There’s even a whole movement around reproducible builds, the goal of which is to stamp out all of the non-determinism in the process of producing binaries from the original source code, where the ideal is achieving bit-for-bit identical binaries. Unsurprisingly, then, the non-determinism of the current breed of AI coding tools is seen as a problem. Here’s a quote from a recent article in the Wall Street Journal by Chip Cutter and Sebastian Herrera: Here’s Where AI Is Tearing Through Corporate America:
Satheesh Ravala is chief technology officer of Candescent, which makes digital technology used by banks and credit unions. He has fielded questions from employees about what innovations like Anthropic’s new features mean for the company, and responded by telling them banks rely on the company for software that does exactly what it’s supposed to every time—something AI struggles with.
“If I want to transfer $10,” he said, “it better be $10 not $9.99.”
I believe the AI coding tools are only going to improve with time, though I don’t feel confident in predicting whether future improvements will be orders-of-magnitude or merely incremental. What I do feel confident in predicting is that the non-determinism in these tools isn’t going away.
At their heart, these tools are sophisticated statistical models: they are prediction machines. When you’re chatting with one, it is predicting the next word to say, and then it feeds back the entire conversation so far, predicts the next word to say again, and so on. Because they are statistical models, there is some probability distribution of next word to predict. You could build the system to always choose the most likely word to say next. Statistical models aren’t just an AI thing, and many statistical models do use such a maximum likelihood approach. But that’s not what LLMs do in general. Instead, there’s some randomness that is intentionally injected into the system so that it doesn’t always just pick the most likely next word, but instead does a biased random selection of the next word, based on the statistical model of what’s most likely to come next, and based on a parameter called temperature, drawing an analogy to physics. If the temperature is zero, then the system always outputs the most likely next word. The higher the temperature, the more random the selection is.
What’s fascinating to me about this is the deliberate injection of randomness improved the output of the models, as judged qualitatively by humans. In other words, increasing the variability of the system improved outcomes.
Now, these LLMs haven’t achieved the level of adaptability that humans possess, though they can certainly perform some impressive cognitive tasks. I wouldn’t say they have adaptive capacity, and I firmly believe that humans will still need to be on-call for software system for the remainder of my career, despite the proliferation of AI SRE solutions. But what I am saying instead is that the ability of LLMs to perform cognitive tasks well depends upon them being able to leverage variability. And my prediction is that this dependence on variability isn’t going to go away. LLMs will get better, and they might even get much better, but I don’t think they’ll ever be deterministic. I think variability is an essential ingredient for a system to be able to perform these sorts of complex cognitive tasks.
Here’s another blog post on gathering some common threads from reading recent posts. Today’s topic is about the unassuming nature of talented software engineers.
The first thread was a tweet by Mitchell Hashimoto about how his best former colleagues are ones where you would have no signal about their skills based on their online activities or their working hours.
One of the most impressive people I've ever worked with was a guy who spent a decade prior working on the same team at the same company iterating on a kernel driver for a single specific network card. He clocked in at 9 and out at 5. Predictable promotions. Nothing crazy.
The second thread was a blog post written a week later by Nikunj Kothari titled The Quiet Ones: Working within the seams. In this post, Kothari wasn’t writing about a specific engineer per se, but rather a type of engineer, one whose contributions aren’t captured by the organization’s performance rubric (emphasis mine):
They don’t hit your L5 requirements because they’re doing L3 and L7 work simultaneously. Fixing the deploy pipeline while mentoring juniors. Answering customer emails while rebuilding core systems. They can’t be ranked because they do what nobody thought to measure.
One of the best staff-level engineers I worked with is on the market. … What you need to know about this person: every team he’s ever worked on, he did standout work, in every situation. He got stuff done with high quality, helped others, is not argumentative but is firm in holding up common sense and practicality, and is very curious and humble to top all of this off. … And still, from the outside, this engineer is near completely invisible.
He has no social media footprint. His LinkedIn lists his companies he worked at, and nothing else: no technologies, no projects, nothing. His GitHub is empty for the last 5 years, and has perhaps a dozen commits throughout the last 10.
That reason that Mitchell Hashimoto, NIkunj Kothari, and Gergly Orosz were able to identify these talented colleagues as because they worked directly with them. People making hiring decisions don’t have that luxury. For promotions, there are organizational constraints that push organizations to define a formal process with explicit criteria.
For both hiring and promotion, decision-makers have a legibility problem. This problem will inevitability lead to a focus on details that are easier to observe directly precisely because they are easier to observe directly. This is how fields like graphologyand phrenology come about. But just because we can directly observe someone’s handwriting or the shapes of the bumps on their head doesn’t mean that those are effective techniques for learning something about that person’s personality.
I think it’s unlikely the industry will get much better at identifying and evaluating candidates anytime soon. And so I’m sure we’ll continue to see posts about the importance of your LinkedIn profile, or your GitHub, or your passion project. But you neglect at your peril the engineers who are working nine-to-five days at boring companies.
There are software technologies that work really well in-the-small, but they don’t scale up well. The challenge here is that the problem size grows incrementally, and migrating off of them requires significant effort, and so locally it makes sense it to keep using them, but then you reach a point where you’re well into the size where they are a liability rather than an asset. Here are some examples.
Shell scripts
Shell scripts are fantastic in the small: throughout my career, I’ve written hundreds and hundreds of bash scripts that are twenty lines are less, typically closer than to ten, frequently less than even five lines. But, as soon as I need to write an if statement, that’s a sign to me that I should probably write it in something like Python instead. Fortunately, I’ve rarely encountered large shell scripts in the wild these days, with DevStack being a notable exception.
Makefiles
I love using makefiles as simple task runners. In fact, I regularly use just, which is like an even simpler version of make, and has similar syntax. And I’ve seen makefiles used to good effect for building simple Go programs.
But there’s a reason technologies like Maven, Gradle, and Bazel emerged, and it’s because large-scale makefiles are an absolute nightmare. Someone even wrote a paper called Recursive Make Considered Harmful.
YAML
I’m not a YAML hater, I actually like it for configuration files that are reasonably sized, where “reasonably sized” means something like “30 lines or fewer”. I appreciate support for things like comments and not having to quote strings.
However, given how much of software operations runs on YAML these days, I’ve been burned too many times by having to edit very large YAML files. What’s human-readable in the small isn’t human-readable is the large.
Spreadsheets
The business world runs on spreadsheets: they are the biggest end-user programming success story in human history. Unfortunately, spreadsheets sometimes evolve into being de facto databases, which is terrifying. The leap required to move from using a spreadsheet as your system of record to a database is huge, which explains why this happens so often.
The late science fiction author Arthur C. Clarke had a great line: Any sufficiently advanced technology is indistinguishable from magic. (This line inspired the related observation: any sufficiently advanced technology is indistinguishable from a rigged demo). Clarke was referring to scenarios where members of a civilization encounters technology developed by a different civilization. The Star Trek: The Next Generation episode titled Who Watches The Watchers is an example of this phenomenon in action. The Federation is surreptitiously observing the Mintakans, a pre-industrial alien society, when Federation scientists accidentally reveal themselves to the Mintakans. When the Mintakans witness Federation technology in action, they come to the conclusion that Captain Picard is a god.
LLMs are the first time I’ve encountered a technology that was developed by my own society where I felt like it was magic. Not magical in the “can do amazing things” sense, but magical in the “I have no idea how it even works” sense. Now, there’s plenty of technology that I interact with on a day-to-day basis that I don’t really understand in any meaningful sense. And I don’t just mean sophisticated technologies like, say, cellular phones. Heck, I’d be hard pressed to explain to you precisely how a zipper works. But existing technology feels in principle understandable to me, that if I was willing to put in the effort, I could learn how it works.
But LLMs are different, in the sense that nobody understands how they work, not even the engineers who designed them. Consider the human brain as an analogy for a moment: at some level, we understand how the human brain works, how it’s a collection of interconnected neuron cells arranged in various structures. We have pretty good models of how individual neurons behave. But if I asked you “how is the concept of thenumber two encoded in a human brain?”, nobody today could give a satisfactory answer to that. It has to be represented in there somehow, but we don’t quite know how.
Similarly, at the implementation level, we do understand how LLMs work: how words are encoded as vectors, how they are trained using data to do token prediction, and so on. But these LLMs perform cognitive tasks, and we don’t really understand how they do that via token predction. Consider this blog post from Anthropic from last month: Tracing the thoughts of a large language model. It talks about two research papers published by Anthropic where they are trying to understand how Claude (which they built!) performs certain cognitive tasks. They are trying to essentially reverse-engineer a system that they themselves built! Or, to use the analogy they use explicitly in the post, they are doing AI biology, they are approaching the problem of how Claude performs certain tasks the way that a biologist would approach the problem of how a particular organism performs a certain function.
Now, engineering researchers routinely study the properties of new technologies that humans have developed. For example, engineering researchers had to study the properties of solid-state devices like transistors, they didn’t know what those properties were just because they created them. But that’s different from the sort of reverse engineering kind of research that the Anthropic engineers are doing. We’ve built something to perform a very broad set of tasks, and it works (for various value of “works”), but we don’t quite know how. I can tell you exactly how a computer encodes the number two in either integer form (using two’s complement encoding) or in floating point form (using IEEE 754 encoding). But, just as I could not tell you how the human brain encodes the number two as concept, I could not tell you how Claude encodes the number two as a concept. I don’t even know if “concept” is a meaningful, well, concept, for LLMs.
There are two researchers who have won both the Turing Award and the Nobel Prize. The most recent winner is Geoffrey Hinton, who did foundational work in artificial neural networks, which eventually led to today’s LLMs. The other dual winner was also an AI researcher: Herbert Simon. Simon wrote a book called The Sciences of the Artificial, about how we should study artificial phenomena.
And LLMs are certainly artificial. We can argue philosophically about whether concepts in mathematics (e.g., the differential calculus) or theoretical computer science (e.g., the lambda calculus) are invented or discovered. But LLMs are clearly a human artifact, I don’t think anybody would argue that we “discovered” them. LLMs are a kind of black-box model of human natural language. We examine just the output of humans in the form of written language, and try to build a statistical model of it. Model here is a funny word. We generally think of models as a simplified view of reality that we can reason about: that’s certainly how scientists use models. But an LLM isn’t that kind of model. In fact, their behavior is so complex, that we have to build models of the model in order to do the work of trying to understand it. Or as the authors of one of the Anthropic papers puts it in On the Biology of a Large Language Model: Our methods study the model indirectly using a more interpretable “replacement model,” which incompletely and imperfectly captures the original.
As far as I’m aware, we’ve never had to do this sort of thing before. We’ve never engineered systems in such a way that we don’t fundamentally understand how they work. Yes, our engineered world contains many complex systems where nobody really understands how the entire system works, I write about that frequently in this blog. But I claim that this sort of non-understanding of LLMs on our part is different in kind from our non-understanding of complex systems.
Unfortunately, the economics of AI obscures the weirdness of the technology. There’s a huge amount of AI hype going on as VCs pour money into AI-based companies, and there’s discussion of using AI to replace humans for certain types of cognitive work. These trends, along with the large power consumption required by these AI models have, unsurprisingly, triggered a backlash. I’m looking forward to the end of the AI hype cycle, where we all stop talking about AI so damned much, when it finally settles in to whatever the equilibrium ends up being.
But I think it’s a mistake to write off this technology as just a statistical model of text. I think the word “just” is doing too much heavy lifting in that sentence. Our intuitions break down when we encounter systems beyond the scales of everyday human life, and LLMs are an example of that. It’s like saying “humans are just a soup of organic chemistry” (c.f. Terry Bisson’s short story They’re Made out of Meat). Intuitively, it doesn’t seem possible that evolution by natural selection would lead to conscious beings. But, somehow we humans are an emergent property of long chains of amino acids recombining, randomly changing, reproducing, and being filtered out by nature. The scale of evolution is so unimaginably long that our intuition of what evolution can do breaks down: we probably wouldn’t believe that such a thing was even possible if the evidence in support of it wasn’t so damn overwhelming. It’s worth noting here that one of the alternative approaches to AI was inspired by evolution by natural selection: genetic algorithms. However, this approach has proven much less effective than artificial neural networks. We’ve been playing with artificial neural networks on computers since the 1950s, and once we scaled up those artificial neural networks with large enough training sets and a large enough set of parameters, and we hit upon effective architectures, we achieved qualitatively different results.
Here’s another example of how our intuitions break down at scales outside of our immediate experience, this one borrowed from the philosophers Paul and Patricia Churchland in their criticism of John Searle’s Chinese Room argument. The Churchlands ask us to imagine a critic of James Clerk Maxwell’s electromagnetic theory by taking a magnet, shaking it backwards and forth, seeing no light emerge from the shaken magnet, and concluding that Maxwell’s theory is incorrect. Understanding the nature of light is particularly challenging for us humans, because it behaves at scales outside of the typical human ones, our intuitions are a hindrance rather than a help.
Just look at this post by Simon Willison about Claude’s system prompt. Ten years ago, if you had told me that a software company was configuring their behavior of their system with a natural language prompt, I would have laughed at you and told you, “that’s not how computers work.” We don’t configure conventional software by guiding it with English sentences and hoping that pushes it in a direction that results in more desirable outcomes. This is much closer to Isaac Asimov’s Three Laws of Robotics than we are to setting fields in a YAML file. According to my own intuitions, telling a computer in English how to behave shouldn’t work at all. And yet, here we are. It’s like the old joke about the dancing bear: it’s not that it dances well, but that it dances at all. I am astonished by this technology.
So, while I’m skeptical of the AI hype, I’m also skeptical of the critics that dismiss the AI technology too quickly. I think we just don’t understand this new technology well enough to know what it is actually capable of. We don’t know whether changes in LLM architecture will lead to only incremental improvements or could give us another order of magnitude. And we certainly don’t know what’s going to happen when people attempt to leverage the capabilities of this new technology.
The only thing I’m comfortable predicting is that we’re going to be surprised.
Postscript: I don’t use LLMs for generating the texts in my blog posts, because I use these posts specifically to clarify my own thinking. I’d be willing to use it as a copy-editor, but so far I’ve been unimpressed with WordPress’s “AI assistant: show issues & suggestions” feature. Hopefully that gets better over time.
I do find LLMs to often give me better results than search engines like Google or DuckDuckGo, but it’s still hit or miss.
For doing some of the research for this post, Claude was great at identifying the episode of Star Trek I was thinking of:
But it failed to initially identify either Herb Simon or Geoffrey Hinton as dual Nobel/Turing winners:
If I explicitly prompted Claude about the winners, it returned details about them.
Claude was also not useful at helping me identify the “shaking the magnet” critique of Searle’s Chinese Room. I originally thought that it came from the late philosopher Daniel Dennett (who was horrified at how LLMs can fool people into believing they are human). It turns out the critique came from the Churchlands, but Claude couldn’t figure that out, I ultimately found that out through using a DuckDuckGo search.
I don’t know anything about your organization, dear reader, but I’m willing to bet that the amount of time and attention your organization spends on post-incident work is a function of the severity of the incidents. That is, your org will spend more post-incident effort on a SEV0 incident compared to a SEV1, which in turn will get more effort than a SEV2 incident, and so on.
This is a rational strategy if post-incident effort could retroactively prevent an incident. SEV0s are worse than SEV1s by definition, so if we could prevent that SEV0 from happening by spending effort after it happens, then we should do so. But no amount of post-incident effort will change the past and stop the incident from happening. So that can’t be what’s actually happening.
Instead, this behavior means that people are making an assumption about the relationship between past and future incidents, one that nobody ever says out loud but everyone implicitly subscribes to. The assumption is that post-incident effort for higher severity incidents is likely to have a greater impact on future availability than post-incident effort for lower severity incidents. In other words, an engineering-hour of SEV1 post-incident work is more likely to improve future availability than an engineering-hour of SEV2 post-incident work. Improvement in future availability refers to either prevention of future incidents, or reduction of the impact of future incidents (e.g., reduction in blast radius, quicker detection, quicker mitigation).
Now, the idea that post-incident work from higher-severity incidents has greater impact than post-incident work from lower-severity incidents is a reasonable theory, as far as theories go. But I don’t believe the empirical data actually supports this theory. I’ve written before about examples of high severity incidents that were not preceded by related high-severity incidents. My claim is that if you look at your highest severity incidents, you’ll find that they generally don’t resemble your previous high-severity incidents. Now, I’m in the no root cause camp, so I believe that each incident is due to a collection of factors that happened to interact.
But don’t take my word for it, take a look at your own incident data. When you have your next high-severity incident, take a look at N high-severity incidents that preceded it (say, N=3), and think about how useful the post-incident incident work of those previous incidents actually was in helping you to deal with the one that just happened. That earlier post-incident work clearly didn’t prevent this incident. Which of the action items, if any, helped with mitigating this incident? Why or why not? Did those other incidents teach you anything about this incident, or was this one just completely different from those? On the other hand, were there sources of information other than high-severity incidents that could have provided insights?
I think we’re all aligned that the goal of post-incident work should be in reducing the risks associated with future incidents. But the idea that the highest ROI for risk reduction work is in the highest severity incidents is not a fact, it’s a hypothesis that simply isn’t supported by data. There are many potential channels for gathering signals of risk, and some of them come from lower severity incidents, and some of them come from data sources other than incidents. Our attention budget is finite, so we need to be judicious about where we spend our time investigating signals. We need to figure out which threads to pull on that will reveal the most insights. But the proposition that the severity of an incident is a proxy for the signal quality of future risk is like the proposition that heavier objects fall faster than lighter one. It’s intuitively obvious; it just so happens to also be false.
Today’s public incident writeup comes courtesy of Brendan Humphries, the CTO of Canva. Like somanyotherincidents that came before, this is another tale of saturation, where the failure mode involves overload. There’s a lot of great detail in Humpries’s write-up, and I recommend you read it directly in addition to this post.
What happened at Canva
Trigger: deploying a new version of a page
The trigger for this incident was Canva deploying a new version of their editor page. It’s notable that there was nothing wrong with this new version. The incident wasn’t triggered by a bug in the code in the new version, or even by some unexpected emergent behavior in the code of this version. No, while the incident was triggered by a deploy, the changes from the previous version are immaterial to this outage. Rather, it was the system behavior that emerged from clients downloading the new version that led to the outage. Specifically, it was clients downloading the new javascript files from the CDN that set the ball in motion.
A stale traffic rule
Canva uses Cloudflare as their CDN. Being a CDN, Cloudflare has datacenters all over the world., which are interconnected by a private backbone. Now, I’m not a networking person, but my basic understanding of private backbones is that CDNs lease fibre-optic lines from telecom companies and use these leased lines to ensure that they have dedicated network connectivity and bandwidth between their sites.
Unfortunately for Canva, there was a previously unknown issue on Cloudflare’s side: Cloudflare Wasn’t using their dedicated fibre-optic lines to route traffic between their Northern Virginia and Singapore datacenters. That traffic was instead, unintentionally, going over the public internet.
[A] stale rule in Cloudflare’s traffic management system [that] was sending user IPv6 traffic over public transit between Ashburn and Singapore instead of its default route over the private backbone.
Traffic between Northern Virginia (IAD) and Singapore (SIN) was incorrectly routed over the public network
The routes that this traffic took suffered from considerable packet loss. For Canva users in Asia, this meant that they experienced massive increases in latency when their web browsers attempted to fetch the javascript static assets from the CDN.
A stale rule like this is the kind of issue that the safety researcher James Reason calls a latent pathogen. It’s a problem that remains unnoticed until it emerges as a contributor to an incident.
High latency synchronizes the callers
Normally, an increase in errors would cause our canary system to abort a deployment. However, in this case, no errors were recorded because requests didn’t complete. As a result, over 270,000+ user requests for the JavaScript file waited on the same cache stream. This created a backlog of requests from users in Southeast Asia.
The first client attempts to fetch the new Javascript files from the CDN, but the files aren’t there yet, the CDN must fetch the files from the origin. Because of the added latency, this takes a long time.
During this time, other clients connect, and attempt to fetch the javascript from the CDN. But the CDN has not yet been populated with the files from the origin, that transfer is still in progress.
As Cloudflare notes in this blog post, when all subsequent clients request access to a file that is in the process of being populated in the cache, they must wait until the file has been cached before they can download the file. Except that Cloudflare has implemented functionality called Concurrent Streaming Acceleration which permits multiple clients to simultaneously download a file that is still in the process of being downloaded from the origin server.
The resulting behavior is that the CDN now behaves effectively as a barrier, with all of the clients slowly but simultaneously downloading the assets. With a traditional barrier, the processes who are waiting can proceed once all processes have entered in the barrier. This isn’t quite the same, as the clients who are waiting can all proceed once the CDN completes downloading the asset from the origin.
The transfer completes, the herd thunders
At 9:07 AM UTC, the asset fetch completed, and all 270,000+ pending requests were completed simultaneously.
20 minutes after Canva deployed the new Javascript assets to the origin server, the clients completed fetching them. The next action the clients take is to call Canva’s API service.
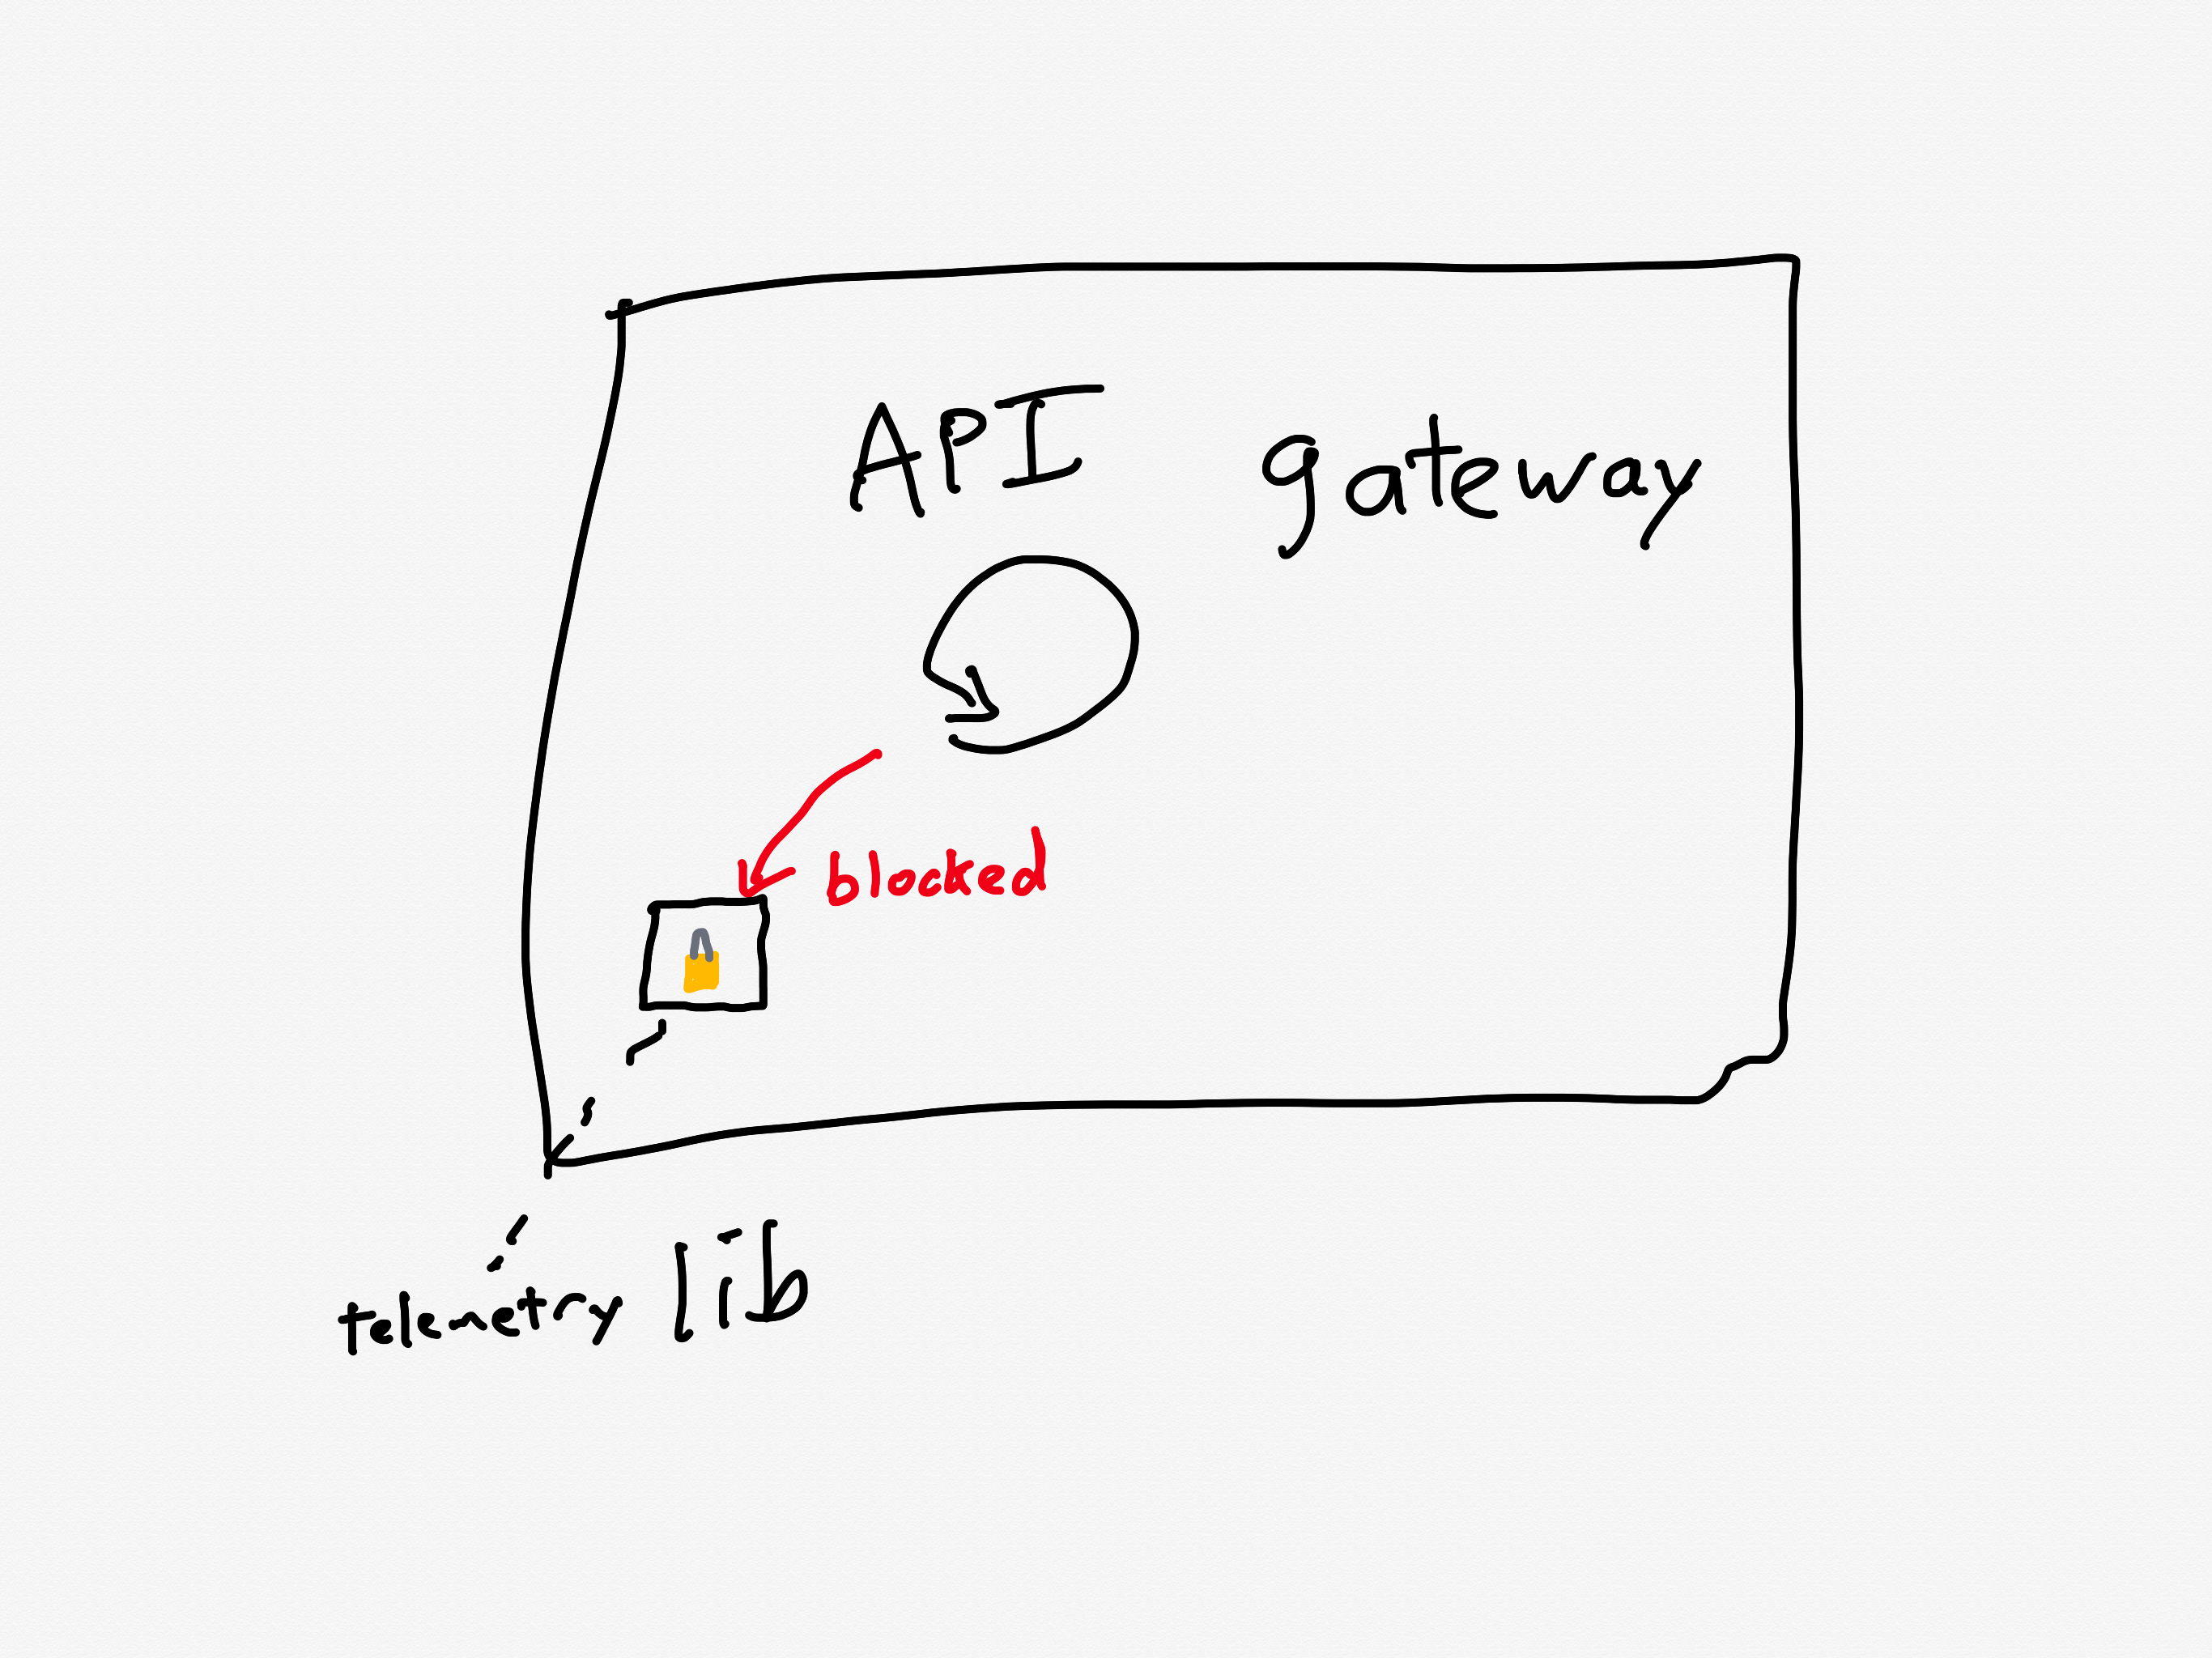
With the JavaScript file now accessible, client devices resumed loading the editor, including the previously blocked object panel. The object panel loaded simultaneously across all waiting devices, resulting in a thundering herd of 1.5 million requests per second to the API Gateway — 3x the typical peak load.
There’s one more issue that made this situation even worse: a known performance issue in the API gateway that was slated to be fixed.
A problematic call pattern to a library reduces service throughput
The API Gateways use an event loop model, where code running on event loop threads must not perform any blocking operations.
Two common threading models for request-response services are thread-per-request and async. For services that are I/O-bound (i.e., most of the time servicing each request is spent waiting for I/O operations to complete, typically networking operations), the async model has the potential to achieve better throughput. That’s because the concurrency of the thread-per-request model is limited by the number of operating-system threads. The async model services multiple requests per thread, and so it doesn’t suffer from the thread bottleneck. Canva’s API gateway implements the async model using the popular Netty library.
One of the drawbacks of the async model is the risk associated with the active thread getting blocked, because this can result in a significant performance penalty. The async model multiplexes multiple requests across an individual thread, and none of those requests can make progress when that thread is blocked. Programmers writing code in a service that uses the async model need to take care to minimize the number of blocking calls.
Prior to this incident, we’d made changes to our telemetry library code, inadvertently introducing a performance regression. The change caused certain metrics to be re-registered each time a new value was recorded. This re-registration occurred under a lock within a third-party library.
In Canva’s case, the API gateway logic was making calls to a third-party telemetry library. They were calling the library in such a way that it took a lock, which is a blocking call. This reduced the effective throughput that the API gateway could handle.
Calls to the library led to excessive thread locking
Although the issue had already been identified and a fix had entered our release process the day of the incident, we’d underestimated the impact of the bug and didn’t expedite deploying the fix. This meant it wasn’t deployed before the incident occurred.
Ironically, they were aware of this problematic call pattern, and they were planning on deploying a fix the day of the incident(!).
Canva is now in a situation where the API gateway is receiving much more traffic than it was provisioned to handle, is also suffering from a performance regression that reduces its ability to handle traffic even more.
Now let’s look at how the system behaved under these conditions.
The load balancer turns into an overload balancer
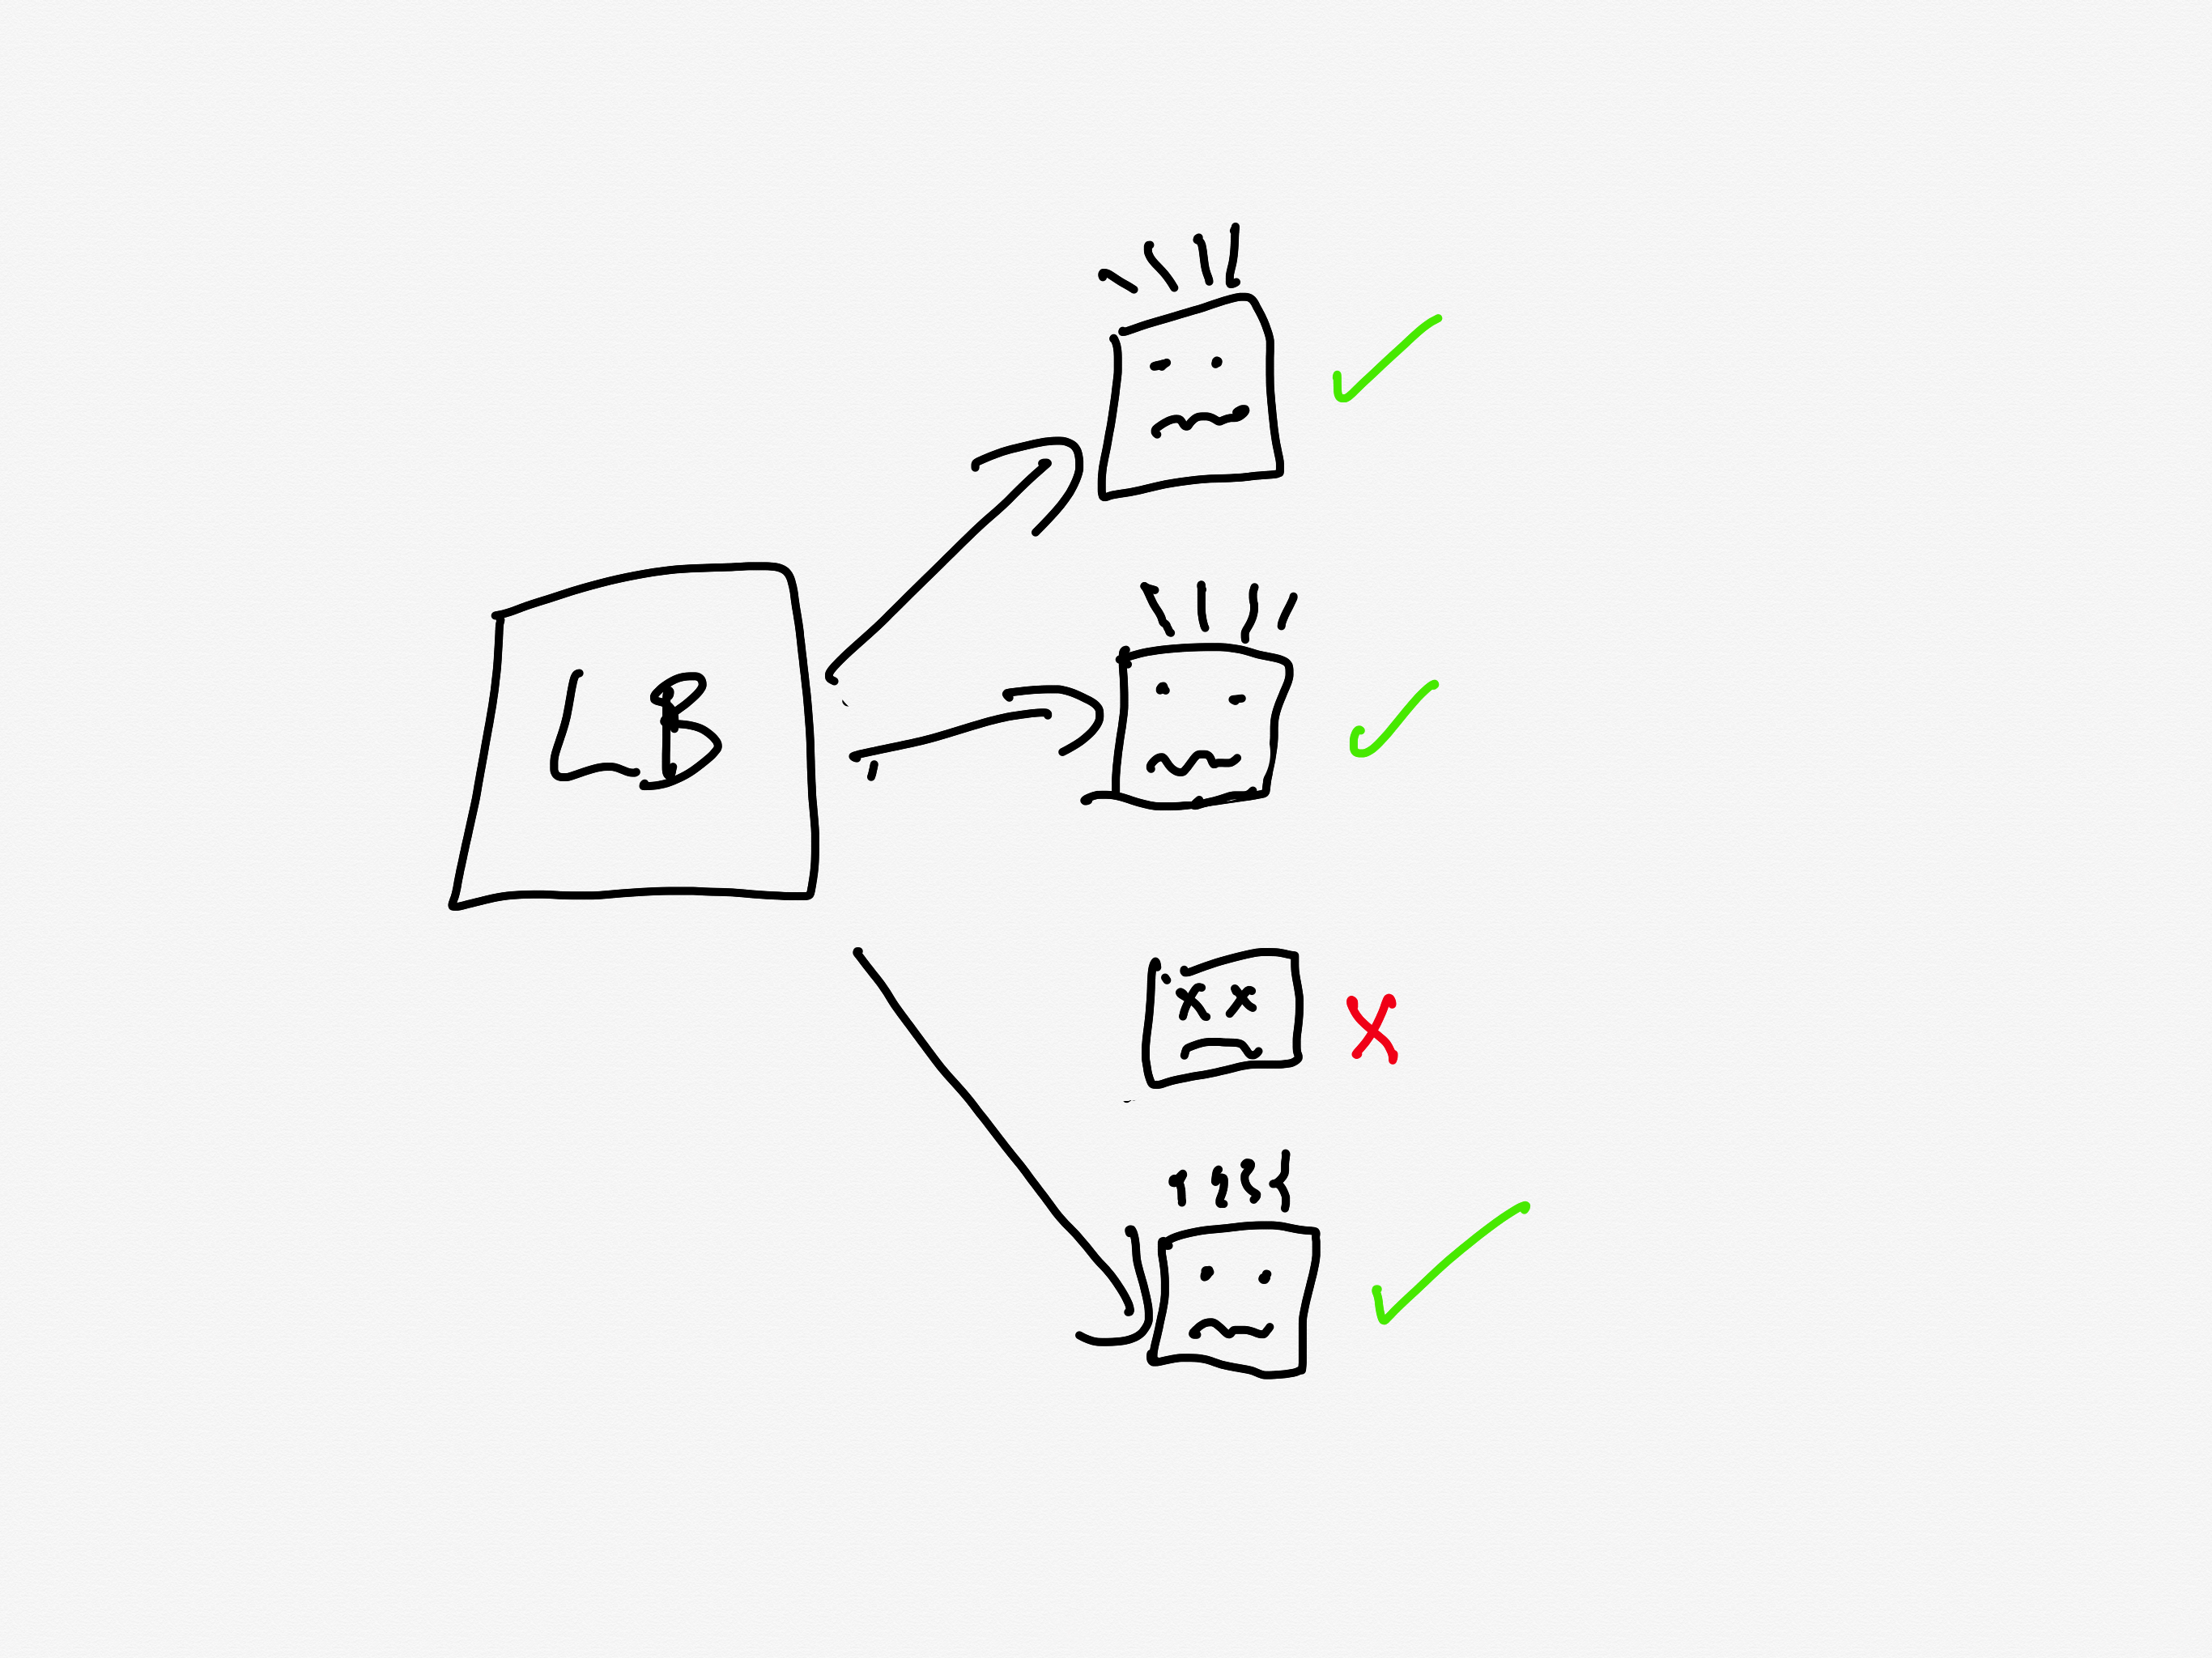
Because the API Gateway tasks were failing to handle the requests in a timely manner, the load balancers started opening new connections to the already overloaded tasks, further increasing memory pressure.
A load balancer sits in front of a service and distributes the incoming requests across the units of compute. Canva runs atop ECS, so the individual units are called tasks, and the group is called a cluster (you can think of these as being equivalent to pods and replicasets in Kubernetes-land).
The load balancer will only send requests to a task that is healthy. If a task is unhealthy, then it stops being considered as a candidate target destination for the load balancer. This yields good results if the overall cluster is provisioned to handle the load: the traffic gets redirected away from the unhealthy tasks and onto the healthy ones.
Load balancer only sells traffic to the healthy tasks
But now consider the scenario where all of the tasks are operating close to capacity. As tasks go unhealthy, the load balancer will redistribute the load to the remaining “healthy” tasks, which increases the likelihood those tasks gets pushed into an unhealthy state.
Redirecting traffic to the almost-overloaded healthy nodes will push them over
This is a classic example of a positive feedback loop: the more tasks go unhealthy, the more traffic the healthy nodes received, the more likely those tasks will go unhealthy as well.
Autoscaling can’t keep pace
So, now the system is saturated, and the load balancer is effectively making things worse. Instead of shedding load, it’s concentrating load on the tasks that aren’t overloaded yet.
Now, this is the cloud, and the cloud is elastic, and we have a wonderful automation system called the autoscaler that can help us in situations of overload by automating provisioning new capacity.
Only, there’s a problem here, and that’s that the autoscaler simply can’t scale up fast enough. And the reason it can’t scale up fast enough is because of another automation system that’s intended to help in times of overload: Linux’s OOM killer.
The growth of off-heap memory caused the Linux Out Of Memory Killer to terminate all of the running containers in the first 2 minutes, causing a cascading failure across all API Gateway tasks. This outpaced our autoscaling capability, ultimately leading to all requests to canva.com failing.
Operating systems need access to free memory in order to function properly. When all of the memory is consumed by running processes, the operating system runs into trouble. To guard against this, Linux has a feature called the OOM killer which will automatically terminate a process when the operating system is running too low on memory. This frees up memory, enabling the OS to keep functioning.
So, you have the autoscaler which is adding new tasks, and the OOM killer which is quickly destroying existing tasks that have become overloaded.
It’s notable that Humphries uses the term outpaced. This sort of scenario is a common failure mode in complex system failures, where the system gets into a state where it can’t keep up. This phenomenon is called decompensation. Here’s resilience engineering pioneer David Woods describing decompensation on John Willis’s Profound Podcast:
And lag is really saturation in time. That’s what we call decompensation, right? I can’t keep pace, right? Events are moving forward faster. Trouble is building and compounding faster than I, than the team, than the response system can decide on and deploy actions to affect. So I can’t keep pace. – David Woods
Adapting the system to bring it back up
At this point, the API gateway cluster is completely overwhelmed. From the timeline:
9:07 AM UTC – Network issue resolved, but the backlog of queued requests result in a spike of 1.5 million requests per second to the API gateway.
9:08 AM UTC – API Gateway tasks begin failing due to memory exhaustion, leading to a full collapse.
When your system is suffering from overload, there are basically two strategies:
increase the capacity
reduce the load
Wisely, the Canva engineers pursued both strategies in parallel.
Max capacity, but it still isn’t enough
Montgomery Scott, my nominee for patron saint of resilience engineering
We attempted to work around this issue by significantly increasing the desired task count manually. Unfortunately, it didn’t mitigate the issue of tasks being quickly terminated.
The engineers tried to increase capacity manually, but even with the manual scaling, the load was too much: the OOM killer was taking the tasks down too quickly for the system to get back to a healthy state.
Load shedding, human operator edition
The engineers had to improvise a load shedding solution in the moment. The approach they took was to block traffic the CDN layer, using Cloudflare.
At 9:29 AM UTC, we added a temporary Cloudflare firewall rule to block all traffic at the CDN. This prevented any traffic reaching the API Gateway, allowing new tasks to start up without being overwhelmed with incoming requests. We later redirected canva.com to our status page to make it clear to users that we were experiencing an incident.
It’s worth noting here that while Cloudflare contributed to this incident with the stale rule, the fact that they could dynamically configure Cloudflare firewall rules meant that Cloudflare also contributed to the mitigation of this incident.
Ramping the traffic back up
Here they turned off all of their traffic to give their system a chance to go back to healthy. But a healthy system under zero load behaves differently from a healthy system under typical load. If you just go back from zero to typical, there’s a risk that you push the system back into an unhealthy state. (One common problem is that autoscaling will have scaled down multiple services due when there’s no load).
Once the number of healthy API Gateway tasks stabilized to a level we were comfortable with, we incrementally restored traffic to canva.com. Starting with Australian users under strict rate limits, we gradually increased the traffic flow to ensure stability before scaling further.
The Canva engineers had the good judgment to ramp up the traffic incrementally rather than turn it back on all at once. They started restoring at 9:45 AM UTC, and were back to taking full traffic at 10:04 AM.
Some general observations
All functional requirements met
I always like to call out situations where, from a functional point of view, everything was actually working fine. In this case, even though there was a stale rule in the Cloudflare traffic management system, and there was a performance regression in the API gateway, everything was working correctly from a functional perspective: packets were still being routed between Singapore and Northern Virginia, and the API gateway was still returning the proper responses for individual requests before it got overloaded.
Rather, these two issues were both performance problems. Performance problems are much harder to spot, and the worst are the ones that you don’t notice until you’re under heavy load.
The irony is that, as an organization gets better at catching functional bugs before they hit production, more and more of the production incidents they face will be related to these more difficult-to-detect-early performance issues.
Automated systems made the problem worse
There were a number of automated systems in play whose behavior made this incident more difficult to deal with.
The Concurrent Streaming Acceleration functionality synchronized the requests from the clients. The OOM killer reduced the time it took for a task to be seen as unhealthy by the load balancer, and the load balancer in turn increased the rate at which tasks went unhealthy.
None of these systems were designed to handle this sort of situation, so they could not automatically change their behavior.
The human operators changed the way the system behaved
It was up to the incident responders to adapt the behavior of the system, to change the way it functioned in order to get it back to a healthy state. They were able to leverage an existing resource, Cloudflare’s firewall functionality, to accomplish this. Based on the description of the action items, I suspect they had never used Cloudflare’s firewall to do this type of load shedding before. But it worked! They successfully adapted the system behavior.
We’re building a detailed internal runbook to make sure we can granularly reroute, block, and then progressively scale up traffic. We’ll use this runbook to quickly mitigate any similar incidents in the future.
This is a classic example of resilience, of acting to reconfigure the behavior of your system when it enters a state that it wasn’t originally designed to handle.
As I’ve written about previously, Woods talks about the idea of a competence envelope. The competence envelope is sort of a conceptual space of the types of inputs that your system can handle. Incidents occur when your system is pushed to operate outside of its competence envelope, such as when it gets more load than it is provisioned to handle:
The competence envelope is a good way to think about the difference between robustness and resilience. You can think of robustness as describing the competence envelope itself: a more robust system may have a larger competence envelope, it is designed to handle a broader range of problems.
However, every system has a finite competence envelope. The difference between a resilient and a brittle system is how that system behaves when it is pushed just outside of its competence envelope.
Incidents happen when the system is pushed outside of its competence envelope
A resilient system can change the way it behaves when pushed outside of the competence envelope due to an incident in order to extend the competence envelope so that it can handle the incident. That’s why we say it has adaptive capacity. On the other hand, a brittle system is one that cannot adapt effectively when it exceeds its competence envelope. A system can be very robust, but also brittle: it may be able to handle a very wide range of problems, but when it faces a scenario it wasn’t designed to handle, it can fall over hard.
The sort of adaptation that resilience demands requires human operators: our automation simply doesn’t have a sophisticated enough model of the world to be able to handle situations like the one that Canva found itself in.
In general, action items after an incident focus on expanding the competence envelope: making changes to the system to handle the scenario that just happened. Improving adaptive capacity involves different kind of work than improving system robustness.
We need to build in the ability to reconfigure our systems in advance, without knowing exactly what sorts of changes we’ll need to make. The Canva engineers had some powerful operational knobs at their disposal through the Cloudflare firewall configuration. This allowed them to make changes. The more powerful and generic these sorts of dynamic configuration features are, the more room for maneuver we have. Of course, dynamic configuration is also dangerous, and is itself a contributor to incidents. Too often we focus solely on the dangers of such functionality in creating incidents, without seeing its ability to help us reconfigure the system to mitigate incidents.
Finally, these sorts of operator interfaces are of no use if the responders aren’t familiar with them. Ultimately, the more your responders know about the system, the better position they’ll be in to implement these adaptations. Changing an unhealthy system is dangerous: no matter how bad things are, you can always accidentally make things worse. The more knowledge about the system you can bring to bear during an incident, the better position you’ll be in to adaptive your system to extend that competence envelope.
Well, who you gonna believe, me or your own eyes? – Chico Marx (dressed as Groucho), from Duck Soup:
In the ACM Queue article Above the Line, Below the Line, the late safety researcher Richard Cook (of How Complex Systems Fail fame) notes how that we software operators don’t interact directly with the system. Instead, we interact through representations. In particular, we view representations of internal state of the system, and we manipulate these representations in order to effect changes, to control the system. Cook used the term line of representation to describe the split between the world of the technical (software) system and the world of the people who work with the technical system. The people are above the line of representation, and the technical system is below the line.
Above the line of representation are the people, organizations, and processes that shape, direct, and restore the technical artifacts that lie below that line.People who work above the line routinely describe what is below the line using concrete, realistic language.
Yet, remarkably, nothing below the line can be seen or acted upon directly. The displays, keyboards, and mice that constitute the line of representation are the only tangible evidence that anything at all lies below the line. All understandings of what lies below the line are constructed in the sense proposed by Bruno Latour and Steve Woolgar. What we “know”—what we can know—about what lies below the line depends on inferences made from representations that appear on the screens and displays.
In short, we can never actually see or change the system directly, all of our interactions mediated through software interfaces.
René Magritte would have appreciated Cook’s article
In this post, I want to talk about how this fact can manifest as incidents, and that our solutions rarely consider this problem. Let’s start off, as we so often do in the safety world, with the Three Mile Island accident.
Three Mile Island and the indicator light
I assume the reader has some familiarity with the partial meltdown that occurred at the Three Mile Island nuclear plant back in 1979. As it happens, there’s a great series of lectures by Cook on accidents. The topic of his first lecture is about how Three Mile Island changed the way safety specialists thought about the nature of accidents.
Here I want to focus on just one aspect of this incident: a particular indicator light in the Three Mile Island control room. During this incident, there was a type of pressure relief valve called a pilot-operated relief valve (PORV) that was stuck open. However, the indicator light for the state of this valve was off, which the operators interpreted (incorrectly, alas) as the valve being closed. Here I’ll quote the wikipedia article:
A light on a control panel, installed after the PORV had stuck open during startup testing, came on when the PORV opened. When that light—labeled Light on – RC-RV2 open —went out, the operators believed that the valve was closed. In fact, the light when on only indicated that the PORV pilot valve’s solenoid was powered, not the actual status of the PORV. While the main relief valve was stuck open, the operators believed the unlighted lamp meant the valve was shut. As a result, they did not correctly diagnose the problem for several hours.
What I found notable was the article’s comment about lack of operator training to handle this specific scenario, a common trope in incident analysis.
The operators had not been trained to understand the ambiguous nature of the PORV indicator and to look for alternative confirmation that the main relief valve was closed. A downstream temperature indicator, the sensor for which was located in the tail pipe between the pilot-operated relief valve and the pressurizer relief tank, could have hinted at a stuck valve had operators noticed its higher-than-normal reading. It was not, however, part of the “safety grade” suite of indicators designed to be used after an incident, and personnel had not been trained to use it. Its location behind the seven-foot-high instrument panel also meant that it was effectively out of sight.
Now, consider what happens if the agent acting on these sensors is an automated control system instead of a human operator.
Sensors, automation, and accidents: cases from aviation
In the aviation world, we have a combination of automation and human operators (pilots) who work together in real-time. The assumption is that if something goes wrong with the automation, the human can quickly take over and deal with the problem. But automation can make things too difficult for a human to be able to compensate for, and automation can be particularly vulnerable to sensor problems, as we can see in the following accidents:
Bombardier Learjet 60 accident, 2008
On September 19, 2008, in Columbia, South Carolina, a Bombardier Learjet 60 overran the runway during a rejected takeoff. As a consequence, four people aboard the plane, including the captain and first officer, were killed. In this case, the sensor issues were due to damage to electronics in the wheel well area after underinflated tires on the landing gear exploded.
The pilots reversed thrust to slow down the plane. However, the tires on the plane were under-inflated, and they exploded. As a result of the tire explosion, sensors in the wheel well area of the plane were damaged.
The thrust reverse system relies on sensor data to determine whether reversing thrust is a safe operation. Because of the sensor damage, the system determined that it was not safe to reverse thrust, and instead increased forward thrust. From the NTSB report:
In this situation, the EECs would transition from the reverse thrust power schedule to the forward thrust power schedule during about a 2-second transition through idle power. During the entire sequence, the thrust reverser levers in the cockpit would remain in the reverse thrust idle position (as selected by the pilot) while the engines produced forward thrust. Because both the thrust reverser levers and the forward thrust levers share common RVDTs (one for the left engine and one for the right engine), the EECs, which receive TLA information from the RVDTs, would signal the engines to produce a level of forward thrust that generally corresponds with the level of reverse thrust commanded; that is, a pilot commanding full reverse thrust (for maximum deceleration of the airplane) would instead receive high levels of forward thrust (accelerating the airplane) according to the forward thrust power schedule
On June 1, 2009, Air France 447 crashed, killing all passengers and crew. The plane was an Airbus A330-200. In this accident, the sensor problem is believed to be caused by ice crystals that accumulated inside of pitot tube sensors, creating a blockage which lead to erroneous readings. Here’s a quote from an excellent Vanity Fair article on the crash:
Just after 11:10 P.M., as a result of the blockage, all three of the cockpit’s airspeed indications failed, dropping to impossibly low values. Also as a result of the blockage, the indications of altitude blipped down by an unimportant 360 feet. Neither pilot had time to notice these readings before the autopilot, reacting to the loss of valid airspeed data, disengaged from the control system and sounded the first of many alarms—an electronic “cavalry charge.” For similar reasons, the automatic throttles shifted modes, locking onto the current thrust, and the fly-by-wire control system, which needs airspeed data to function at full capacity, reconfigured itself from Normal Law into a reduced regime called Alternate Law, which eliminated stall protection and changed the nature of roll control so that in this one sense the A330 now handled like a conventional airplane. All of this was necessary, minimal, and a logical response by the machine.
This is what the safety researcher David Woods refers to as bumpy transfer of control, where the humans must suddenly and unexpectedly take over control of an automated system, which can lead to disastrous consequences.
Boeing 737 MAX 8 (2018, 2019)
On October 29, 2018, Lion Air Flight 610 crashed thirteen minutes after takeoff, killing everyone on board. Five months later, on March 10, 2019, Ethiopian Airlines Flight 302 crashed six minutes after takeoff, also killing everyone on board. Both planes were Boeing 737 MAX 8. In both cases, the sensor problem was related to the angle-of-attack (AOA) sensor.
The replacement AOA sensor that was installed on the accident aircraft had been mis-calibrated during an earlier repair. This mis-calibration was not detected during the repair.
Shortly after liftoff, the left Angle of Attack sensor recorded value became erroneous and the left stick shaker activated and remained active until near the end of the recording.
An automation subsystem in the 737 MAX called Maneuvering Characteristics Augmentation System (MCAS) automatically pushed the nose down in response to the AOA sensor data.
What should we take away from these?
Here I’ve given examples from aviation, but sensor-automation problems are not specific to that domain. Here are a few of my own takeaways.
We designers can’t assume sensor data will be correct
The kinds of safety automation subsystems we build in tech are pretty much always closed-loop control systems. When designing such systems in the tech world, how often have you heard someone ask, “what happens if there’s a problem with the sensor data that the system is reacting to?”
This goes back to the lineof representation problem: that no agent ever gets access to the true state of the system, it only gets access to some sort of representation. The irony here is that it doesn’t just apply to humans (above the line) making sense of signals, it also applies to technical system components (below the line!) making sense of signals from other technical components.
Designing a system that is safe in the face of sensor problems is hard
Again, from the NTSB report of the Learjet 60 crash:
Learjet engineering personnel indicated that the uncommanded stowage of the thrust reversers in the event of any system loss or malfunction is part of a fail-safe design that ensures that a system anomaly cannot result in a thrust reverser deployment in flight, which could adversely affect the airplane’s controllability. The design is intended to reduce the pilot’s emergency procedures workload and prevent potential mistakes that could exacerbate an abnormal situation.
The thrust reverser system behavior was designed by aerospace engineers to increase safety, and ended up making things worse! Good luck imagining all of these sorts of scenarios when you design your systems to increase safety.
Even humans struggle in the face of sensor problems
People are better equipped to handle sensor problems than automation, because we don’t seem to be able to build automation that can handle all of the possible kinds of sensor problems that we might throw at a problem.
But even for humans, sensor problems are difficult. While we’ll eventually figure out what’s going on, we’ll still struggle in the face of conflicting signals, as anyone who has responded to an incident can tell you. And in high-tempo situations, where we need to respond quickly enough or something terrible will happen (like in the Air France 447 case), we simply might not be able to respond quickly enough.
Instead of focusing on building the perfect fail-safe system to prevent this next time, I wish we’d spend more time thinking about, “how can we help the human figure out what the heck is happening when the input signals don’t seem to make sense”.