(With apologies to The Smashing Pumpkins)
A few weeks ago, Cloudflare experienced a major outage of their popular 1.1.1.1 public DNS resolver.
Technically, the DNS resolver itself was working just fine: it was (as far as I’m aware) up and running the whole time. The problem was that nobody on the Internet could actually reach it. The Cloudflare public write-up is quite detailed, and I’m not going to summarize it here. I do want to bring up one aspect of their incident, because it’s something I worry about a lot from a reliability perspective: migrations.
Cloudflare’s migration
When this incident struck, Cloudflare supported two different ways of managing what they call service topologies. There was a newer system that supported progressive rollout, and an older system where the changes occurred globally. The Cloudflare incident involved the legacy system, which makes global changes, which is why the blast radius of this incident was so large.

Cloudflare engineers were clearly aware that these sorts of global changes are dangerous. After all, I’m sure that’s one of the reasons why they built their new system in the first place. But migrating all of the way to the new thing takes time.
Migrations and why I worry about them
If you’ve ever worked at any sort of company that isn’t a startup, you’ve had to deal with a migration. Sometimes a migration impacts only a single team that owns the system in question, but often migrations are changes that are large in scope (typically touching many teams) which, while providing new capabilities to the organization as a whole, don’t provide much short-term benefit to the teams who have to make a change to accommodate the migration.
A migration is a kind of change that, almost by definition, the system wasn’t originally designed to accommodate. We build our systems to support making certain types of future changes, and migrations are exactly not these kinds of changes. Each migration is typically a one-off type of change. While you’ll see many migrations if you work at a more mature tech company, each one will be different enough that you won’t be able to leverage common tooling from one migration to help make the next one easier.
All of this adds up to reliability risk. While a migration-related change wasn’t a factor in the Cloudflare incident, I believe that such changes are inherently risky, because you’re making a one-off change to the way that your system works. Developers generally have a sense that these sorts of changes are risky. As a consequence, for an individual on a team who has to do work to support somebody else’s migration, all of the incentives push them towards dragging their feet: making the migration-related change takes time away from their normal work, and increases the risk they break something. On the other hand, completing the migration generally doesn’t provide them short-term benefit. The costs typically outweigh the benefits. And so all of the forces push towards migrations taking a long time.
But a delay in implementing a migration is also a reliability risk, since migrations are often used to improve the reliability of the system. The Cloudflare incident is a perfect example of this: the newer system was safer than the old one, because it supported staged rollout. And while they ran the new system, they had to run the old one as well.
Why run one system when you can run two?
The scariest type of migration to me is the big bang migration, where you cut over all at once from the old system to the new one. Sometimes you have no choice, but it’s an approach that I personally would avoid whenever possible. The alternative is to do incremental migration, migrating parts of the system over time. To do incremental migration, you need to run the old system and the new system concurrently, until you’ve completely finished the migration and can shut the old system down. When I worked at Netflix, people used the term Roman riding to refer to running the old and new system in parallel, in reference to a style of horseback riding.

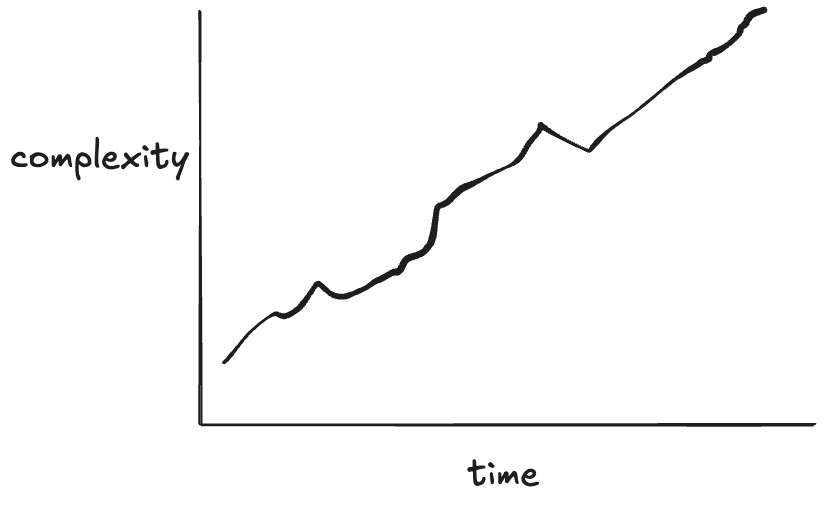
The problem with Roman riding is that it’s risky as well. While incremental is safer than big bang, running two systems concurrently increases the complexity of the system. There are many, many opportunities for incidents while you’re in the midst of a migration running the two systems in parallel.
What is to be done?
I wish I had a simple answer here. But my unsatisfying one is that engineering organizations at tech companies need to make migrations a part of their core competency, rather than seeing them as one-off chores. I frequently joke that platform engineering should really be called migration engineering, because any org large enough to do platform engineering is going to be spending a lot of its cycles doing migrations.
Migrations are also unglamorous work: nobody’s clamoring for the title of migration engineer. People want to work on greenfield projects, not deal with the toil of a one-off effort to move the legacy thing onto the new thing. There’s also not a ton written on doing migrations. A notable exception is (fellow TLA+ enthusiast) Marianne Bellotti’s book Kill It With Fire, which sits on my bookshelf, and which I really should re-read.
I’ll end this post with some text from the “Remediation and follow-up steps” of the Cloudflare writeup:
We are implementing the following plan as a result of this incident:
Staging Addressing Deployments: Legacy components do not leverage a gradual, staged deployment methodology. Cloudflare will deprecate these systems which enables modern progressive and health mediated deployment processes to provide earlier indication in a staged manner and rollback accordingly.
Deprecating Legacy Systems: We are currently in an intermediate state in which current and legacy components need to be updated concurrently, so we will be migrating addressing systems away from risky deployment methodologies like this one. We will accelerate our deprecation of the legacy systems in order to provide higher standards for documentation and test coverage.
I’m sure they’ll prioritize this particular migration because of the attention garnered on it from this incident. But I also bet there are a whole lot more in-flight migrations at Cloudflare, as well as at other companies, that increase complexity through maintaining two systems and delaying moving to the safer thing. What are they actually going to do in order to complete those other migrations more quickly? If it was easy, it would already be done.