There’s an old saying in software engineering, originally attributed to David Wheeler: We can solve any problem by introducing an extra level of indirection. The problem is that indirection adds complexity to a system. Just ask anybody who is learning C and is wrestling with the concept of pointers. Or ask someone who is operating an unfamiliar codebase and is trying to use grep to find the code that relates to certain log messages. Indirection is a powerful tool, but it also renders systems more difficult to reason about.
The old saying points at a more general phenomenon: our engineering solutions to problems invariably add complexity.
Spinning is hard
There was a fun example of this phenomenon that made it to Hacker News the other day. It was a post written by Clément Grégoire of siliceum titled Spinning around: Please don’t!. The post was about the challenges of implementing spin locks.
A spin lock is a type of lock where the thread spins in a loop waiting for the lock to be released so it can grab it. The appeal of a spin-lock is that it should be faster than a traditional mutex lock provided by the operating system: using a spin-lock saves you the performance cost of doing a context switch into the kernel. Grégoire’s initial C++ spin-lock implementation looks basically like this (I made some very minor style changes):
class SpinLock { int is_locked = 0; public: void lock() { while (is_locked != 0) { /* spin */ } is_locked = 1; } void unlock() { is_locked = 0; }}As far as locking implementations go, this is a simple one. Unfortunately, it has all sorts of problems. Grégoire’s post goes on to describe these problems, as well as potential solutions, and additional problems created by those proposed solutions. Along the way, he mentions issues such as:
- torn reads
- race condition
- high CPU utilization when not using the dedicated PAUSE (x86) or YIELD (arm) (spin loop hint) instruction
- waiting for too long when using the dedicated instruction
- contention across multiple cores attempting atomic writes
- high cache coherency traffic across multiple core caches
- excessive use of memory barriers
- priority inversion
- false sharing
Below is an implementation that Grégoire proposes to address these issues, with very slight modifications. Note that it requires a system call, so it’s operating-system-specific. He used Windows systems calls, so that’s why I used as well: on Linux, Grégoire notes that you can use the futex API.
(Note: I did not even try to run this code, it’s just to illustrate what the solution looks like)
<atomic> // for std::atomic <Windows.h> // for WaitOnAddress, WakeByAddressSingleclass SpinLock { std::atomic<int32_t> is_locked{0}; public: void lock(); void unlock(); };void cpu_pause() { defined(__i386__) || defined(__x86_64__) || defined(_M_IX86) || defined(_M_X64) _mm_pause(); defined(__arm__) || defined(__aarch64__) || defined(_M_ARM) || defined(_M_ARM64) || defined(_M_ARM64EC) __builtin_arm_yield(); "unknown instruction set"}static inline uint64_t get_tsc() { defined(__i386__) || defined(__x86_64__) || defined(_M_IX86) || defined(_M_X64) return __rdtsc(); defined(__arm__) || defined(__aarch64__) || defined(_M_ARM) || defined(_M_ARM64) || defined(_M_ARM64EC) return __builtin_arm_rsr64("cntvct_el0"); "unknown instruction set"}static inline bool before(uint64_t a, uint64_t b) { return ((int64_t)b - (int64_t)a) > 0;}struct Yielder { static const int maxPauses = 64; // MAX_BACKOFF int nbPauses = 1; const int maxCycles =/*Some value*/; void do_yield_expo_and_jitter() { uint64_t beginTSC = get_tsc(); uint64_t endTSC = beginTSC + maxCycles; // Max duration of the yield // jitter is in the range of [0;nbPauses-1]. // We can use bitwise AND since nbPauses is a power of 2. const int jitter = static_cast<int>(beginTSC & (nbPauses - 1)); // So subtracting we get a value between [1;nbPauses] const int nbPausesThisLoop = nbPauses - jitter; for (int i = 0; i < nbPausesThisLoop && before(get_tsc(), endTSC); i++) cpu_pause(); // Multiply the number of pauses by 2 until we reach the max backoff count. nbPauses = nbPauses < maxPauses ? nbPauses * 2 : nbPauses; } void do_yield(int32_t* address, int32_t comparisonValue, uint32_t timeoutMs) { do_yield_expo_and_jitter(); if (nbPauses >= maxPauses) { WaitOnAddress(address, &comparisonValue, sizeof(comparisonValue), timeoutMs); nbPauses = 1; } }};void SpinLock::lock() { Yielder yield; // Actually start by an exchange, we assume the lock is not already taken // This is because the main use case of a spinlock is when there's no contention! while (is_locked.exchange(1, std::memory_order_acquire) != 0) { // To avoid locking the cache line with a write access, always only read before attempting the writes do { yield.do_yield(&is_locked, 1 /*while locked*/ , 1 /*ms*/); } while (is_locked.load(std::memory_order_relaxed) != 0); }}void SpinLock::unlock() { is_locked = 0; WakeByAddressSingle(&is_locked); // Notify a potential thread waiting, if any }Yeesh, this is a lot more complex than our original solution! And yet, that complexity exists to address real problems. It uses dedicated hardware instructions for spin-looping more efficiently, it uses exponential backoff with jittering to reduce contention across cores, it takes into account memory ordering to eliminate unwanted barriers, and it uses special system calls to help the system calls schedule the threads more effectively. The simplicity of this initial solution was no match for the complexity of modern multi-core NUMA machines. No matter how simple that initial solution looked as a C++ program, the solution must interact with the complexity of the fundamental building blocks of compilers, operating systems, and hardware architecture.
Flying is even harder
Now let’s take an example from outside of software: aviation. Consider the following two airplanes: a WWI era Sopwith Camel, and a Boeing 787 Dreamliner.


While we debate endlessly over what we mean by complexity, I feel confident in claiming that the Dreamliner is a more complex airplane than the Camel. Heck, just look at the difference in the engines used by the two planes: the Clerget 9B for the Camel, and the GE GEnx for the Dreamliner.
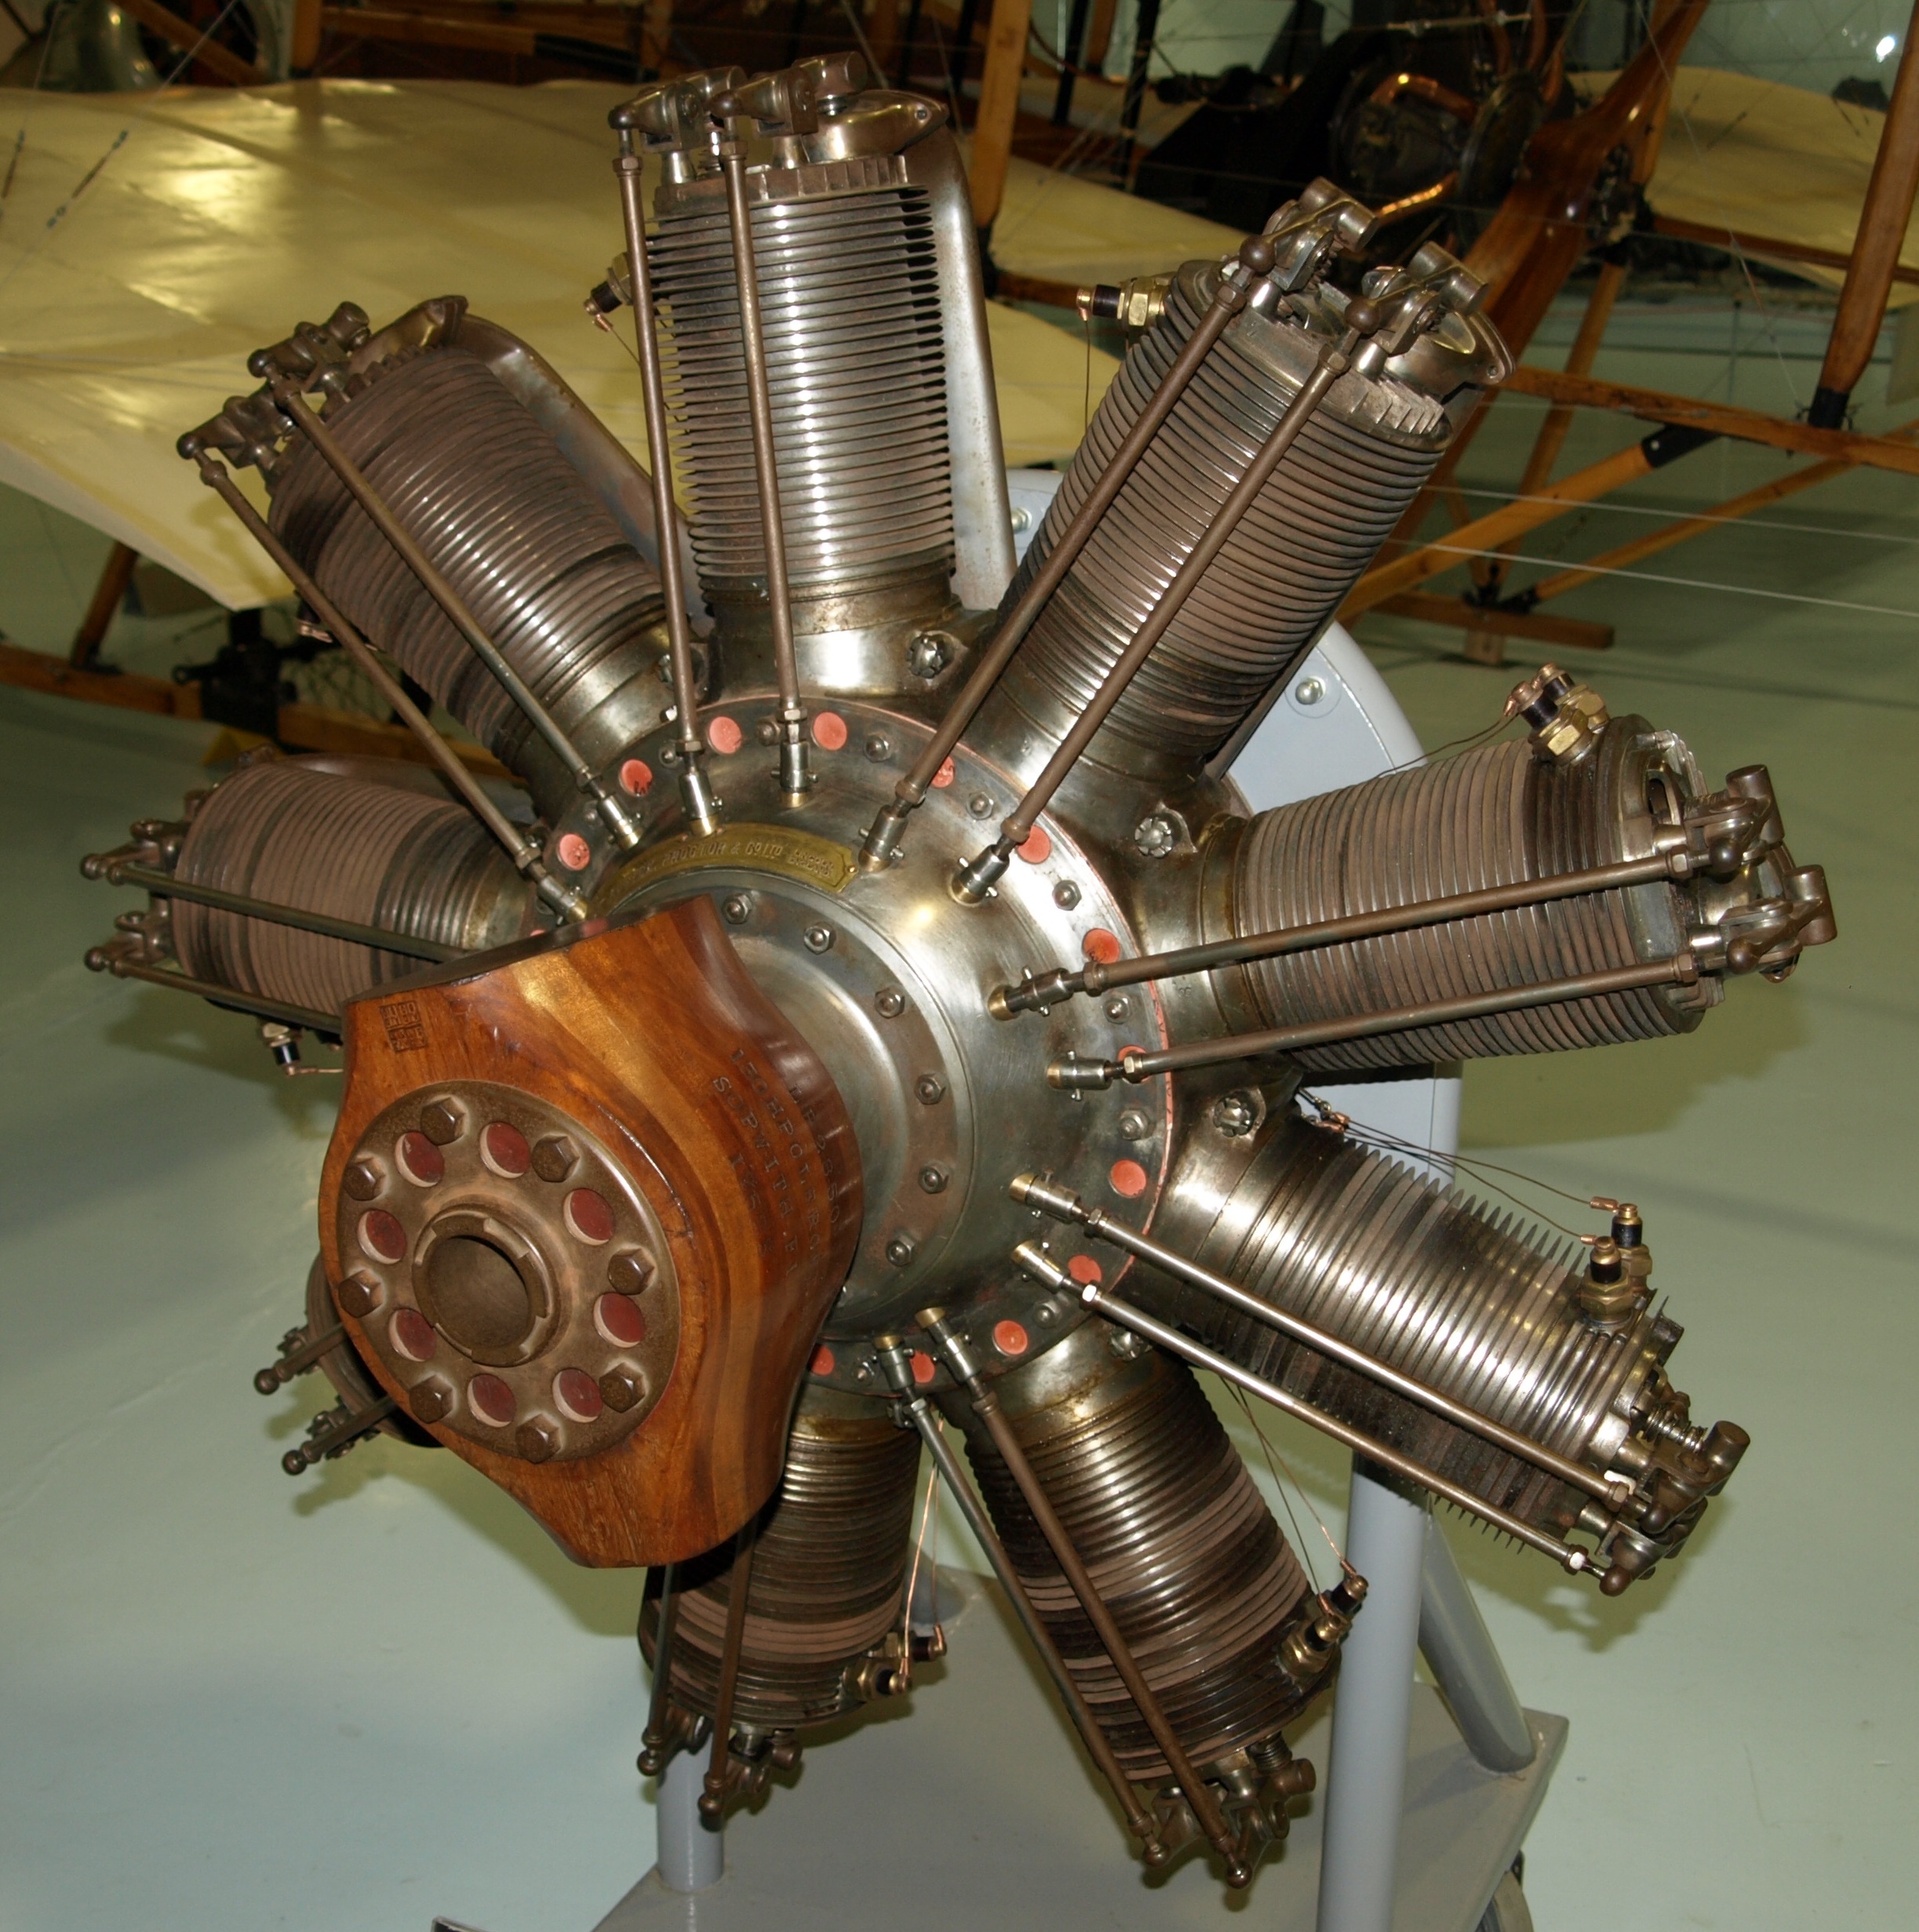

Image attributions
Sopwith Camel: Airwolfhound, CC BY-SA 2.0 via Wikimedia Commons
Boeing 787 Dreamliner: pjs2005 from Hampshire, UK, CC BY-SA 2.0 via Wikimedia Commons
Clerget 9B: Nimbus227, Public domain, via Wikimedia Commons
GE Genx: Olivier Cleynen, CC BY-SA 3.0 via Wikimedia Commons
And, yet, despite the Camel being simpler than the Dreamliner, the Camel was such a dangerous airplane to fly that almost as many Camel pilots died flying it in training as were killed flying in combat! The Dreamliner is both more complex and safer. The additional complexity is doing real work here, it contributes to making the Dreamliner safer.
Complexity: threat or menace?
But we’re also right to fear complexity. Complexity makes it harder for us humans to reason about the behavior of systems. Evolution has certainly accomplished remarkable things in designing biological systems: these systems are amazingly resilient. One thing they aren’t, though, is easy to understand, as any biology major will tell you.
Complexity also creates novel failure modes. The Dreamliner itself experienced safety issues related to electrical fires: a problem that Camel pilots never had to worry about. And there were outright crashes where software complexity was a contributing factor, such as Lion Air Flight 610, Ethiopian Airlines Flight 302 (both Boeing 737 MAX aircraft), and Air France Flight 447 (an Airbus A330).
Unfortunately for us, making systems more robust means adding complexity. An alternate formulation of the saying at the top of this post is: All problems in computer science can be solved by another level of indirection, except for the problem of too many layers of indirection. Complexity solves all problems except the problem of complexity.
The psychiatrist and cybernetician W. Ross Ashby expressed this phenomenon as a law, which he called the Law of Requisite Variety. Today it’s also known as Ashby’s Law. Ashby noted that when you’re building a control system, the more complex the problem space is, the more complex your controller needs to be. For example, a self-driving car is necessarily going to have a much more complex control system than a thermostat.
When faced with a complex problem, we have to throw complexity at it in order to solve it.

This blog is called surfing complexity because I want to capture the notion that we will always have to deal with complexity: we can’t defeat it, but we can get better at navigating through it effectively.
And that brings us, of course, to AI.
Throwing complexity back at the computer
Modern LLM systems are enormously complex. OpenAI, Anthropic, and Google don’t publish parameter counts for their models anymore, but Meta’s Llama 4 has 17 billion active parameters, and either 109 or 400 billion total parameters, depending on the model. These systems are so complex that trying to understand their behavior looks more like biology research than engineering.
One type of task that LLMs are very good at solving are the kind of problem that exist solely because of computers in. For example, have you ever struggled to align content the right way in a Word document? It’s an absolute exercise in frustration. My wife threw this problem at an LLM and it fixed up the formatting for her. I’ve used LLMs for various tasks myself, including asking it do development tasks, and using it like a search engine to answer questions. And sometimes it works well, and sometimes it doesn’t. But where’ve find that these tools really shine is when I’ve got some batch of data, maybe a log file or a CSV or some JSON, and I want it do some processing task, like change the shape of it, or extract some data, so I can feed it into some other thing. I don’t ask it for the output directly, instead I ask it to generate a shell script or a Perl one-liner that’ll do the ad-hoc task, and then I run it. And, like the Word problem, I have a problem that was created by a computer that I need to solve.
I’m using this enormously complex system, an LLM, to help me solve a problem that was created by software complexity in the first place.
Back in March 2016, Tom Limoncelli wrote a piece for ACM Queue titled Automation Should Be Like Iron Man, Not Ultron. Drawing inspiration from John Allspaw in particular, and Cognitive Systems Engineering in general, Limoncelli argued that automation should be written to be directable by humans rather than acting fully independently. He drew an analogy to Iron Man’s suit being an example of good automation, and the robot villain Ultron being an example of bad automation. Iron Man’s suit enables him to do things he couldn’t do otherwise, but he remains in control of it, and he can direct it to do the things he needs it to do. Ultron is an autonomous agent that was built for defensive purposes but ends up behaving unexpectedly, causing more problems than it solves. But my recent experiences with LLMs have led me to a different analogy: Tron.

In the original movie, Tron is a good computer program that fights the bad computer programs. In particular, he’s opposed to the Master Control Program, an evil AI who is referred to as the MCP. (Incidentally, this is what a Gen Xer like me automatically thinks of when hearing the term “MCP”). Tron struggles against the MCP on behalf of the humans, who create and use the programs. He fights for the users.
I frequently describe my day-to-day work as “fighting with the computer”. On some days I win the fight, and on some days I lose. AI tools have not removed the need to fight with the computer to get my work done. But now I can send an AI agent to fight some of these battles for me. There’s a software agent who will fight with other software on my behalf. They haven’t reduced the overall complexity of the system. In fact, if you take into account the LLM’s complexity, the overall system complexity is much larger. But I’m deploying this complexity in an Ashby-ian sense, to help defeat other software complexity so I can get my work done. Like Tron, it fights for the user.


.jpg)
_(cropped).jpg)