TTR: the out-of-control metric

I’m currently reading The Machine That Changed The World. This is a book written back in 1990 comparing Toyota’s approach to automobile manufacturing to the approach used by American car manufacturers. It’s one of the earlier books that popularized the concept of lean manufacturing in the United States.

The software world has drawn a lot of inspiration from lean manufacturing over the past two decades, as is clear from the titles of influential software books such as Implementing Lean Software Development by Tom Poppendieck and Mary Poppendieck (2006), The Principles of Product Development Flow: Second Generation Lean Product Development by Don Reinersten (2009), The Lean Startup by Eric Ries (2011), Lean UX by Jeff Gothelf and Josh Sieden (first published in 2013), and Accelerate: The Science of Lean Software by Nicole Forsgren PhD, Jez Humble, and Gene Kim (2018). Another signal is the proliferation of Kanban boards, which are a concept taken from Toyota. I’ve also seen continuous delivery compared to single-piece flow from lean manufacturing, although I suspect that’s more a case of convergent evolution than borrowing.

In The Machine That Changed The World, the authors mention in passing how Toyota uses the five-whys problem identification technique. I had forgotten that five whys has its origins in manufacturing. This post isn’t about five whys, but it is about how applying concepts from manufacturing to incidents can lead us astray, because of assumptions that turn out to be invalid. For that, I’m going to turn to W. Edwards Deming and the idea of statistical control.

Deming & Statistical control

Deming is the famous American statistician who had enormous influence on the Japanese manufacturing industry in the second half of the twentieth century. My favorite book of his is Out of the Crisis, originally published in 1982, which I highly recommend.

One of the topics Deming wrote on was about a process being under statistical control, with the focus of his book being on manufacturing processes in particular. For example, imagine you’re tracking some metric of interest (e.g., defect rate) for a manufacturing process.

(Note: I have no experience in the manufacturing domain, so you should treat this is as a stylized, cartoon-ish view of things).

Deming argued that when a process is under statistical control, focusing on individual defects, or even days, where the defects are higher than average, is a mistake. To make this more concrete, you can compute an upper control limit and lower control limit based on the statistics of the observed data. There is variation inherent in the process, and focusing on the individual data points that happen to be higher than the average won’t lead to actual improvements.

The process with computed upper and lower control limits. This graph is sometimes called as a control chart.

Instead, in order to make an improvement, you need to make a change to the overall system. This is where Toyota’s five-whys would come in, where you’d identify a root cause, a systemic issue behind why the average rate is as high at is. Once you identified a root cause, you’d apply what Deming called the Plan-Do-Check-Act cycle, where you’d come up with an intervention, apply it, observe whether the intervention has actually achieved the desired improvement, and then react accordingly.

I think people have attempted to apply these concepts to improving availability, where time-to-resolve (TTR) is the control metric. But it doesn’t work the way it does in manufacturing. And the reason it doesn’t has everything to do with the idea of statistical control.

Out of control

Now, let’s imagine a control chart that looks a little different.

In the chart above, there are multiple points that are well outside the control limits. This is a process that is not under statistical control.

Deming notes that, when a process is not under statistical control, statistics associated with the process are meaningless:

Students are not warned in classes nor in the books that for analytic purposes (such as to improve a process), distributions and calculations of mean, mode, standard deviation, chi-square, t-test, etc. serve no useful purpose for improvement of a process unless the data were produced in a state of statistical control. – W. Edwards Deming, Out of the Crisis

Now, I’m willing to bet that if you were to draw a control chart for the time-to-resolve (TTR) metric for your incidents, it would look a lot more like the second control chart than the first one, that you’d have a number of incidents whose TTRs are well outside of the upper control limit.

The reason I feel confident saying this is because when an incident is happening, your system is out of control. This actually is a decent rough-and-ready definition of an incident: an event when your system goes out of control.

Time-to-resolve is a measure of how long your system was out of control. But because your system was out of control, then it isn’t a meaningful metric to perform statistical analysis on. As per the Deming quote above, mean-time-to-resolve (MTTR) serves no useful purpose for improvement.

Anyone who does operations work will surely sympathize with the concept that “a system during an incident is not under statistical control”. Incidents are often chaotic affairs, and individual events (a chance ordering by the thread scheduler, a responder who happens to remember a recent Slack message, someone with important knowledge happens to be on PTO) can mean the difference between a diagnosis that takes minutes versus one that takes hours.

As John Allspaw likes to say, a large TTR cannot distinguish between a complex incident handled well and a simple incident handled poorly. There are too many factors that can influence TTR to conclude anything useful from the metric alone.

Conclusion

To recap:

  1. When a system is out of control, statistical analysis on system metrics are useless as a signal for improving the system.
  2. Incidents are, by definition, events when the system is out control.

TTR, in particular, is a metric that only applies when the system is out of control. It’s really just a measure of how long the system was out of control.

Now, this doesn’t mean that we should throw up our hands and say “we can’t do anything to improve our ability to resolve incidents.” It just means that we need to let go of a metrics-based approach.

Think back to Allspaw’s observation: was your recent long incident a complex one handled well or a simple one handled poorly? How would you determine that? What questions would you ask?

If you don’t examine what worked, how will you know what works?

This is one of my favorite bits from fellow anglophone Québécois Norm McDonald:

Norm: not a lung expert

One of the goals I believe that we all share for post-incident work is to improve the system. For example, when I wrote the post Why I don’t like discussing action items during incident reviews, I understood why people would want to focus on action items: precisely because they share this goal of wanting to improve the system (As a side note, Chris Evans of incident.io wrote a response: Why I like discussing actions items in incident reviews). However, what I want to write about here is not the discussion of action items, but focusing on what went wrong versus what went right.

“How did things go right?”

How did things go right is a question originally posed by the safety researcher Erik Hollnagel, in his the safety paradigm that he calls Safety-II. The central idea is that things actually go right most of the time, and if you want to actually improve the system, you need to get a better understanding of how the system functions, which means you need to broaden your focus beyond the things that broke.

You can find an approachable introduction to Safety-II concepts in the EUROCONTROL white paper From Safety-I to Safety-II. Hollnagel’s ideas have been very influential in the resilience engineering community. As an example, check out my my former colleague Ryan Kitchens’s talk at SREcon Americas 2019: How Did Things Go Right? Learning More from Incidents.

It’s with this how did things go right lens that I want to talk a little bit about incident review.

Beyond “what went well”

Now, in most incident writeups that I’ve read, there is a “what went well” section. However, it’s typically the smallest section in the writeup, with maybe a few bullet points: there’s never any real detail there.

Personally, I’m looking for details like how an experienced engineer recognized the symptoms enough to get a hunch about where to look next, reducing the diagnostic time by hours. Or how engineers leveraged an operational knob that was originally designed for a different purpose. I want to understand how experts are able to do the work of effectively diagnosing problems, mitigating impact, and remediating the problem.

Narrowly, I want to learn this because I want to get this sort of working knowledge into other people’s heads. More broadly, I want to bring to light the actual work that gets done.

We don’t know how the system works

Safety researchers make a distinction between work-as-imagined and work-as-done. We think we understand how the day-to-day work gets done, but we actually don’t. Not really. To take an example from software, we don’t actually know how people really use the tooling to get their work done, and I can confirm this by being on-call for internal support for development tools in previous jobs. (“You’re using our tool to do what?” is not an uncommon reaction from the on-call person). People do things we never imagined, in both wonderful and horrifying ways (sometimes at the same time!).

We also don’t see all of the ways that people coordinate to get their work done. There are the meetings, the slack messages, the comments on the pull requests, but there’s also the shared understanding, the common knowledge, the stuff that everybody knows that everybody else knows, that enables people to get this work done, while reducing the amount of explicit communication that has to happen.

What’s remarkable is that these work patterns, well, they work. These people in your org are able to get their stuff done, almost all of the time. Some of them may exhibit mastery of the tooling, and others may use the tooling in ways even it was never intended that are fundamentally unsafe. But we’re never going to actually know unless we actually look at how they’re doing their work.

Because how people do their work is how the system works. And if we’re going to propose and implement interventions, it’s very likely that the outcomes of the interventions will surprise us, because these changes might disrupt effective ways of doing work, and people will adapt to those interventions in ways we never anticipated, and in ways we may never even know if we don’t take a look.

Then why use incidents to look at things that go right?

At first glance, it does seem odd to use incidents as the place to examine where work goes well: given that incidents are times where something unquestionably went wrong. It would be wonderful if we could study how work happens when things are going well. Heck, I’d love to see companies have sociologists or anthropologists on staff to study how the work happens at the company. Regrettably, though, incidents are one of the only times when the organization is actually willing to devote resources (specifically, time) on examining work in fine-grained detail.

We can use incidents to study how things go well, but we have to keep a couple of things in mind. One, we need to recognize that adaptations that fail led to an incident are usually successful, which is why people developed those adaptations. Note that because an adaptation usually works, doesn’t mean that it’s a good thing to keep doing: an adaptation could be a dangerous workaround to a constraint like a third-party system that can’t be changed directly and so must be awkwardly worked around.

Second, we need to look in more detail, to remark, at incident response that is remarkable. When incident response goes well, there is impressive diagnostic, coordination, and improvisation work to get the system back to healthy. These are the kinds of skills you want to foster across your organization. If you want to build tools to make this work even better, you should take the time to understand just how this work is done today. Keep this in mind when you’re proposing new interventions. After all, if you don’t examine what worked, how will you know what works?

Safety first!

I’m sure you’ve heard the slogan “safety first”. It is a statement of values for an organization, but let’s think about how to define what it should mean explicitly. Here’s how I propose to define safety first, in the context of a company. I’ll assume the company is in the tech (software) industry, since that’s the one I know best. So, in this context, you can think of “safety” as being about avoiding system outages, rather than about, say, avoiding injuries on a work site.

Here we go:


A tech company is a safety first company if any engineer has the ability to extend a project deadline, provided that the engineer judges in the moment that they need additional time in order to accomplish the work more safely (e.g., by following an onerous procedure for making a change, or doing additional validation work that is particular time-intensive).

This ability to extend the deadline must be:

  1. automatic
  2. unquestioned
  3. consequence-free

Automatic. The engineer does not to explicitly ask someone else for permission before extending the deadline.

Unquestioned. Nobody is permitted to ask the engineer “why did you extend the deadline?” after-the-fact.

Consequence-free. This action cannot be held against the engineer. For example, it cannot be a factor in a performance review.


Now, anyone who has worked in management would say to me, “Lorin, this is ridiculous. If you give people the ability to extend deadlines without consequence, then they’re just going to use this constantly, even if there isn’t any benefit to safety. It’s going to drastically harm the organization’s ability to actually get anything done”.

And, the truth is, they’re absolutely right. We all work under deadlines, and we all know that if there was a magical “extend deadline” button that anyone could press, that button would be pressed a lot, and not always for the purpose of improving safety. Organizations need to execute, and if anybody could introduce delays, this would cripple execution.

But this response is exactly the reason why safety first will always be a lie. Production pressure is an unavoidable reality for all organizations. Because of this, the system will always push back against delays, and that includes delays for the benefit of safety. This means engineers will always face double binds, where they will feel pressure to execute on schedule, but will be punished if they make decisions that facilitate execution but reduce safety.

Safety is never first in organization: it’s always one of a number of factors that trade off against each other. And those sorts of tradeoff decisions happen day-to-day and moment-to-moment.

Remember that the next time someone is criticized for “not being careful enough” after a change brings down production.

The “CrowdStrike” approach to reliability work

There’s a lot we simply don’t know about how reliability work was prioritized inside of CrowdStrike, but I’m going to propose a little thought experiment about the incident where I make some assumptions.

First, let’s assume that the CrowdStrike incident was the first time they had an incident that was triggered by a Rapid Response Content update, which is a config update. We’ll assume that previous sensor issues that led to Linux crashes were related to a sensor release, which is a code update.

Next, let’s assume that CrowdStrike focuses their reliability work on addressing the identified root cause of previous incidents.

Finally, let’s assume that none of the mitigations documented in their RCA were identified as action items that addressed the root cause of any incidents they experienced before this big one.

If these three assumptions are true, then it explains why these mitigations weren’t done previously. Because they didn’t address the root causes of previous incidents, and they focus their post-incident work on identifying the root cause of previous incidents. Now, I have no idea if any of these assumptions are actually true, but they sound plausible enough for this thought experiment to hold.

This thought experiment demonstrates the danger of focusing post-incident work on addressing the root causes of previous incidents: it acts to obscure other risks in the system that don’t happen to fit into the root cause analysis. After all, issues around validation of the channel files or staging of deploys were not really the root cause of any of the incidents before this one. The risks that are still in your system don’t care about what you have labeled “the real root cause” of the previous incident, and there’s no reason to believe that whatever gets this label is the thing that is most likely to bite you in the future.

I propose (cheekily) to refer to the prioritize-identifying-and-addressing-the-root-cause–of-previous-incidents thinking as the “CrowdStrike” approach to reliability work.

I put “CrowdStrike” in quotes because, in a sense, this really isn’t about them at all: I have no idea if the assumptions in this thought experiment are true. But my motivation for using this phrase is more about using CrowdStrike as a symbol that’s become salient to our industry then about the particular details of that company.

Are you on the lookout for the many different signals of risk in your system, or are you taking the “CrowdStrike” approach to reliability work?

Expect it most when you expect it least

Homer Simpson saying "It's probably the person you least suspect."
Homer Simpson: philosopher

Yesterday, CrowdStrike released a Preliminary Post-Incident Review of the major outage that happened last week. I’m going to wait until the full post-incident review is released before I do any significant commentary, and I expect we’ll have to wait at least a month for that. But I did want to highlight one section of the doc from the section titled What Happened on July 19, 2024, emphasis mine

On July 19, 2024, two additional IPC Template Instances were deployed. Due to a bug in the Content Validator, one of the two Template Instances passed validation despite containing problematic content data.

Based on the testing performed before the initial deployment of the Template Type (on March 05, 2024), trust in the checks performed in the Content Validator, and previous successful IPC Template Instance deployments, these instances were deployed into production.

And now, let’s reach way back into the distant past of three weeks ago, when the The Canadian Radio-television and Telecommunications Commission (CRTC) posted an executive summary of a major outage, which I blogged about at the time. Here’s the part I want to call attention to, once again, emphasis mine.

Rogers had initially assessed the risk of this seven-phased process as “High.” However, as changes in prior phases were completed successfully, the risk assessment algorithm downgraded the risk level for the sixth phase of the configuration change to “Low” risk, including the change that caused the July 2022 outage.

In both cases, the engineers had built up confidence over time that the types of production changes they were making were low risk.

When we’re doing something new with a technology, we tend to be much more careful with it, it’s riskier, we’re shaking things out. But, over time, after there haven’t been any issues, we start to gain more trust in the tech, confident that it’s a reliable technology. Our internal perception of the risk adjusts based on our experience, and we come to believe that the risks of these sorts of changes are low. Any organization who concentrates their reliability efforts on action items in the wake of an incident, rather than focusing on the normal work that doesn’t result in incidents, is implicit making this type of claim. The squeaky incident gets the reliability grease. And, indeed, it’s rational to allocate your reliability effort based on your perception of risk. Any change can break us, but we can’t treat every change the same. How could it be otherwise?

The challenge for us is that large incidents are not always preceded by smaller ones, which means that there may be risks in your system that haven’t manifested as minor outages. I think these types of risks are the most dangerous ones of all, precisely because they’re much harder for the organization to see. How are you going to prioritize doing the availability work for a problem that hasn’t bitten you yet, when your smaller incidents demonstrate that you have been bitten by so many other problems?

This means that someone has to hunt for weak signals of risk and advocate for doing the kind of reliability work where there isn’t a pattern of incidents you can point to as justification. The big ones often don’t look like the small ones, and sometimes the only signal you get in advance is a still, small sound.

A still, small sound

One of the benefits of having attended a religious elementary school (despite being a fairly secular one as religious schools go) is exposure to the text of the Bible. There are two verses from the first book of Kings that have always stuck with me. They are from I Kings 19:11–13, where God is speaking to the prophet Elijah. I’ve taken the text below from the English translation that was done by A.J. Rosenberg:

And He said: Go out and stand in the mountain before the Lord, behold!

The Lord passes, and a great and strong wind splitting mountains and shattering boulders before the Lord, but the Lord was not in the wind.

And after the wind an earthquake-not in the earthquake was the Lord.

After the earthquake fire, not in the fire was the Lord,

and after the fire a still small sound.

I was thinking of these passages when listening to an episode of Todd Conklin’s Pre-accident Investigation podcast, with the episode title Safety Moment – Embracing the Yellow: Rethinking Safety Indicators.

It’s in the aftermath of the big incidents where most of the attention is focused when it comes to investing in reliability: the great and strong winds, the earthquakes, the fires. But I think it’s the subtler signals, what Conklin refers to as the yellow (as opposed to the glaring signals of the red or the absence of signal of the green) that are the ones that communicate to us about the risk of the major outage that has not happened yet.

It’s these still small sounds we need to able to hear in order to see the risks that could eventually lead to catastrophe. But to hear these sounds, we need to listen for them.

Book review: How Life Works

In the 1980s, the anthropologist Lucy Suchman studied how office workers interacted with sophisticated photocopiers. What she found was that people’s actions were not determined by predefined plans. Instead, people decided what act to take based on the details of the particular situation they found themselves in. They used predefined plans as resources for helping them choose which action to take, rather than as a set of instructions to follow.

I couldn’t help thinking of Suchman when reading How Life Works. In it, the British science writer Philip Ball presents a new view of the role of DNA, genes, and the cell in the field of biology. Just as Suchman argued that people use plans as resources rather than explicit instructions, Ball discusses how the cell uses DNA as resources. Our genetic code is a toolbox, not a blueprint.

Imagine you’re on a software team that owns a service, and an academic researcher who is interested in software but doesn’t really know anything about it comes to and asks, “What function does redis play in your service? What would happen if it got knocked out?”. This is a reasonable question, and you explain the role that redis plays in improving performance through caching. And then he asks another question: “What function does your IDE’s debugger play in your service?” He notices the confused look on your face and tries to clarify the question by asking, “Imagine another team had to build the same service, but they didn’t have the IDE debugger? How would the behavior of the service be different? Which functions would be impaired” And you try to explain that you don’t actually know how it would be different. That the debugger, unlike redis, is a tool, which is sometimes used to help diagnose problems. But there are multiple ways to debug (for example, using log statements). It might not make any difference at all if that new team doesn’t happen to use the debugger. There’s no direct mapping of the debugger’s presence to the service’s functionality: the debugger doesn’t play a functional role in the service the way that redis does. In fact, the next team that builds a service might not end up needing to use the debugger at all, so removing it might have no observable effect on the next service.

The old view sees these DNA segments like redis, having an explicit functional role, and the new view sees them more like a debugger, as tools to support the cell in performing functions. As Ball puts it, “The old view of genes as distinct segments of DNA strung along the chromosomes like beads, interspersed with junk, and each controlling some aspect of phenotype, was basically a kind of genetic phrenology.” The research has shown that the story is more complex than that, and that there is no simple mapping between DNA segments in our chromosomes and observed traits, or phenotypes. Instead, these DNA segments are yet another input in a complex web of dynamic, interacting components. Instead of focusing on these DNA strands of our genome, Ball directs our attention on the cell as a more useful unit of analysis. A genome, he points out, is not capable of constructing a cell. Rather, a cell is always the context that must exist for the genome to be able to do anything.

The problem space that evolution works in is very different from the one that human engineers deal with, and, consequently, the solution space can appear quite alien to us. The watch has long been a metaphor for biological organisms (for example, Dawkins’s book “The Blind Watchmaker”), but biological systems are not like watches with their well-machined gears. The micro-world of the cell contains machinery at the scale of molecules, which is a very noisy place. Because biological systems must be energy efficient, they function close to the limits of thermal noise. That requires a very different types of machines than the ones we interact with at our human scales. Biology can’t use specialized parts with high tolerances, but must instead make do with more generic parts that can be used to solve many different kinds of problems. And because the cells can use the same parts of the genome to solve different problems, asking questions like “what does that protein do” becomes much harder to answer: the function of a protein depends on the context in which the cell uses it, and the cell can use it in multiple contexts. Proteins are not like keys designed to fit specifically into unique locks, but bind promiscuously to different sites.

This book takes a very systems-thinking approach, as opposed to a mechanistic one, and consequently I find it very appealing. This is a complex, messy world of signaling networks, where behavior emerges from the interaction of genome and environment. There are many connections here to the field of resilience engineering, which has long viewed biology as a model (for example, see Richard Cook’s talk on the resilience of bone). In this model, the genome acts as a set of resources which the cell can leverage to adapt to different challenges. The genome is an example, possible the paradigmatic example, of adaptive capacity. Or, as the biologists Michael Levin and Rafael Yuste put it, whom Ball quotes: “Evolution, it seems, doesn’t come up with answers so much as generate flexible problem-solving agents that can rise to new challenges and figure things out on their own.”

Quick takes on Rogers Network outage executive summary

The Canadian Radio-television and Telecommunications Commission (CRTC) has posted an executive summary of a report on a major telecom outage that happened in 2022 to Rogers Communications, which is one of the major Canadian telecom companies.

The full report doesn’t seem to be available yet, and I’m not sure if it ever will be publicly released (edit: the full report was released on November 2024). I recommend you read the executive summary, but here are some quick impressions of mine.

Note that I’m not a network engineer (I’ve only managed a single rack of servers in my time), so I don’t have any domain expertise here.

Migration!

When you hear “large-scale outage”, a good bet is that involved a migration. The language of the report describes it as an upgrade, but I suspect this qualifies as a migration.

In the weeks leading to the day of the outage on 8 July 2022, Rogers was executing on a seven-phase process to upgrade its IP core network. The outage occurred during  the sixth phase of this upgrade process.

I don’t know anything about what’s involved a telecom upgrading its IP core network, but I do have a lot of general opinions about migrations, and I’m willing to bet they apply here as well.

I think of migrations as high-impact, bespoke changes that the system was not originally designed to accommodate.

They’re high-impact because things can go quite badly if something goes wrong. If you’ve worked at a larger company, you’ve probably experienced migrations that seem to take forever, and this is one of the reasons why: there’s a lot of downside risk in doing migration work (and often not much immediate upside benefit for the people who have to do the work, but that’s a story for another day).

Migrations are bespoke in the sense that each migration is a one-off. This makes migrations even more dangerous because:

  • The organization doesn’t have any operational muscles around doing any particular migration, because each one is new.
  • Because each migration is unique, it’s not worth the effort to build tooling to support doing the migration. And even if you build tools, those tools will always be new, which means they haven’t been hardened through production use.

There’s a reason why you hear about continuous integration and continuous delivery but not continuous migration, even though every org past a certain age will have multiple migrations in flight.

Finally, migrations are changes that the system was not originally designed to accommodate. In my entire career, during the design of a new system, I have never heard anyone ask, “How are we going to migrate off of this new system at the end of its life?” We just don’t design for migrating off of things. I don’t even know if it’s possible to do so.

Saturation!

Rogers staff removed the Access Control List policy filter from the configuration of the distribution routers. This consequently resulted in a flood of IP routing information into the core network routers, which triggered the outage. The flood of IP routing data from the distribution routers into the core routers exceeded their capacity to process the information. The core routers crashed within minutes from the time the policy filter was removed from the distribution routers configuration. When the core network routers crashed, user traffic could no longer be routed to the appropriate destination. Consequently, services such as mobile, home phone, Internet, business wireline connectivity, and 9-1-1 calling ceased functioning.

Saturation is a term from resilience engineering which refers to a system receiving being pushed to the limit of the amount of load that it can handle. It’s remarkable how many outages in distributed systems are related to some part of the system being overloaded, or hitting a rate limit, or exceeding some other limit. (For example, see Slack’s Jan 2021 outage). This incident is another textbook example of a brittle system, which falls over when it becomes saturated.

Perception of risk

I mentioned earlier that migrations are risky, and everyone knows migrations are risky. Roger engineers knew that as well:

Rogers had initially assessed the risk of this seven-phased process as “High.”

Ironically, the fact that the migration had gone smoothly up until that point led them to revise their risk assessment downwards.

However, as changes in prior phases were completed successfully, the risk assessment algorithm downgraded the risk level for the sixth phase of the configuration change to “Low” risk, including the change that caused the July 2022 outage.

I wrote about this phenomenon in a previous post, Any change can break us, but we can’t treat every change the same. The engineers gained confidence as they progressed through the migration, and things went well. Which is perfectly natural. In fact, this is one of the strengths of the continuous delivery approach: you build enough confidence that you don’t have to babysit every single deploy anymore.

But the problem is that we can never perfectly assess the risk in the system. And no matter how much confidence we build up, that one change that we believe is safe can end up taking down the whole system.

I should note that the report is pretty blame-y when it comes to this part:

 Downgrading the risk assessment to “Low” for changing the Access Control List filter in a routing policy contravenes industry norms, which require high scrutiny for such configuration changes, including laboratory testing before deploying in the production network.

I wish I had more context here. How did it make sense to them at the time? What sorts of constraints or pressures were they under? Hopefully the full report reveals more details.

Cleanup

Rogers staff deleted the policy filter that prevented IP route flooding in an effort to clean up the configuration files of the distribution routers. 

Cleanup work has many of the same risks as migration work: it’s high-impact and bespoke. Say “cleanup script” to an SRE and watch the reaction on their face.

But not cleaning up is also a risk! The solution can’t be “never do cleanup” in the same way it can’t be “never do migrations”. Rather, we need to recognize that this work always involve risk trade-offs. There’s no safe path here.

Failure mode makes incident response harder

At the time of the July 2022 outage, Rogers had a management network that relied on the Rogers IP core network. When the IP core network failed during the outage, remote Rogers employees were unable to access the management network. …

Rogers staff relied on the company’s own mobile and Internet services for connectivity to communicate among themselves. When both the wireless and wireline networks failed, Rogers staff, especially critical incident management staff, were not able to communicate effectively during the early hours of the outage. 

When an outage affects not just your customers but also your engineers doing incident response, life gets a whole lot harder.

This brings to mind the Facebook outage from 2021:

[A]s our engineers worked to figure out what was happening and why, they faced two large obstacles: first, it was not possible to access our data centers through our normal means because their networks were down, and second, the total loss of DNS broke many of the internal tools we’d normally use to investigate and resolve outages like this. 

Component substitution fallacy

The authors point out that the system was not designed to handle this sort of overload:

Absence of router overload protection.  The July 2022 outage exposed the absence of overload protection on the core network routers. The network failure could have been prevented had the core network routers been configured with an overload limit that specifies the maximum acceptable number of IP routing data the router can support. However, the Rogers core network routers were not configured with such overload protection mechanisms. Hence, when the policy filter was removed from the distribution router, an excessive amount of routing data flooded the core routers, which led them to crash.

This is a great example of the component substitution fallacy, which fails to acknowledge explicit trade-offs that are made within organizations about which parts of the system to work on. Note that the Rogers engineers will certainly build in router overload protection now, but it means that’s engineering effort that won’t be spent building protections against other failure modes that haven’t happened yet.

Acknowledging trade-offs

To the authors’ credit, they explicitly acknowledge the tradeoffs involved in the overall design of the system.

The Rogers network is a national Tier 1 network and is architecturally designed for reliability; it is typical of what would be expected of such a Tier 1 service provider network. The July 2022 outage was not the result of a design flaw in the Rogers core network architecture. However, with both the wireless and wireline networks sharing a common IP core network, the scope of the outage was extreme in that it resulted in a catastrophic loss of all services. Such a network architecture is common to many service providers and is an example of the trend of converged wireline and wireless telecom networks. It is a design choice by service providers, including Rogers, that seeks to balance cost with performance.

I really hope the CRTC eventually releases the full report, I’m looking forward to reading it.

The error term isn’t Pareto distributed

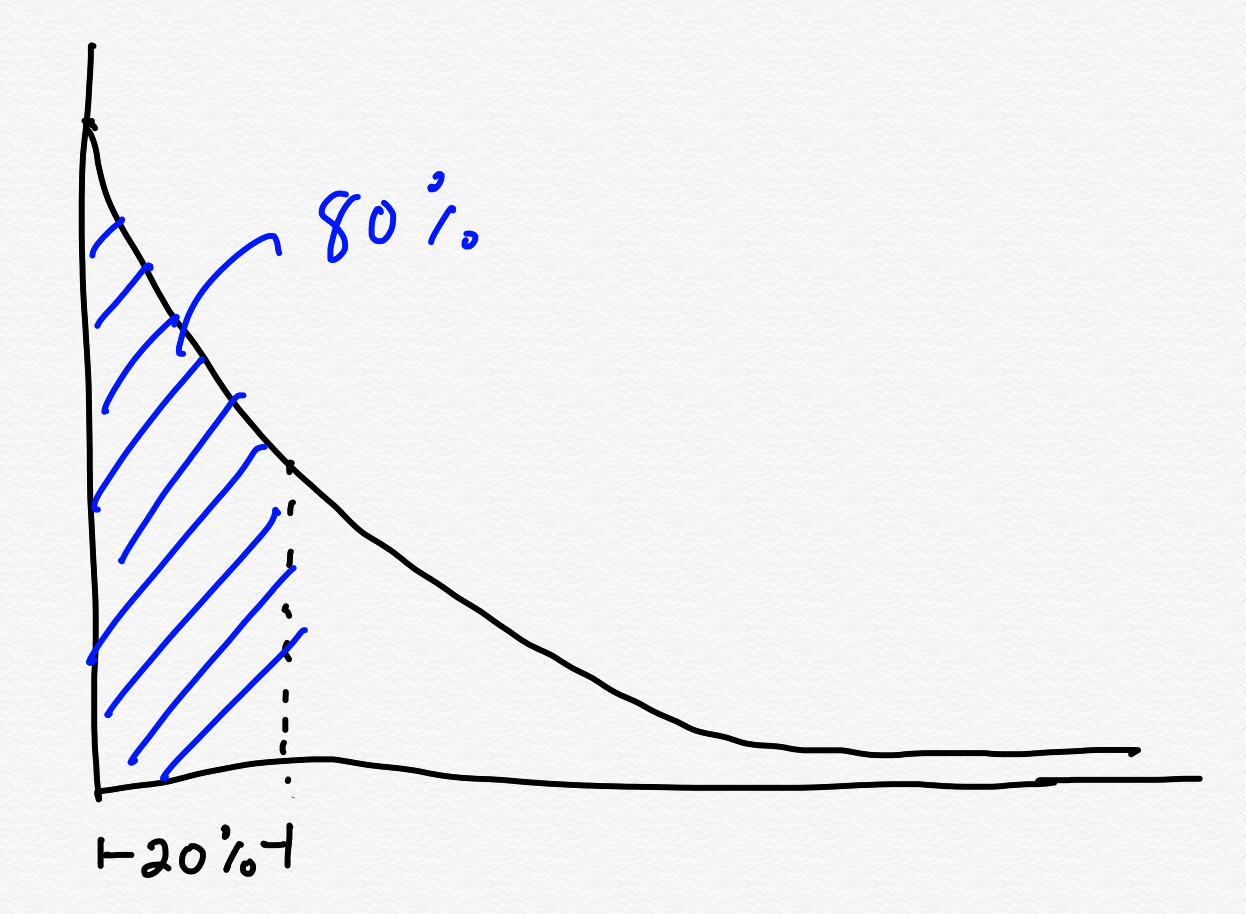
You’re probably familiar with the 80-20 rule: when 80% of the X stems from only 20% of the Y. For example, 80% of your revenue comes from only 20% of your customer, or 80% of the logs that you’re storing are generated from only 20% of the services. Talk to anybody who is looking to reduce cloud costs in their organization, and chances are they’re attacking the problem by looking for the 20% of services that are generating 80% of the costs, rather than trying to reduce cloud usage uniformly across all services.

Not all phenomena follow the 80-20 rule, but it’s common enough in the systems we encounter that it’s a good rule of thumb. The technical term for it is the Pareto principle, and distributions that exhibit this 80-20 phenomena are an example of Pareto distributions, also known as power law distributions.

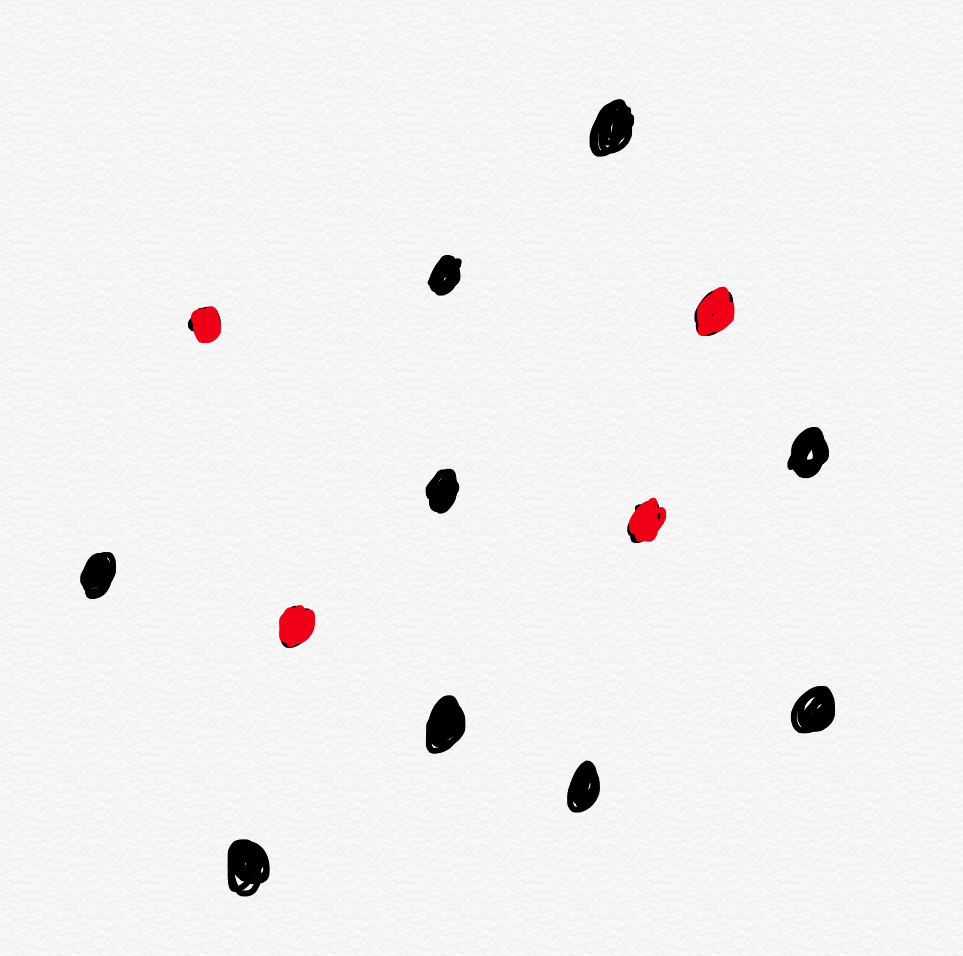
A common implicit assumption is that availability problems are Pareto-distributed. If you look at incidents and keep track of their causes, you should be able to identify a small number of causes that lead to the majority of the incidents. Because of this, we should attribute a cause to an incident, and then look to see which causes most often contribute to incident in order to identify interventions that will have the largest impact: those 20% of improvements that should yield 80% improvements. If you believe in the RCA (root cause analysis) model of incidents, that’s a reasonable assumption to make: identify the root cause of each incident, track these across incidents, and then invest in projects that attack the most expensive root causes.

If we can identify the problematic red dots, we can achieve significant improvements

But if you’re a frequent reader of this blog, you know there’s an alternative model of how incidents come to be. I’m fond of referring to the alternative as the LFI (learning from incidents) model. However, in the safety science research community this alternative model is more commonly associated with terms such as the New View, the New Look, or Safety-II.

The contrast of the LFI model with the RCA model is captured well in Richard Cook’s famous monograph, How Complex Systems Fail:

Post-accident attribution accident to a ‘root cause’ is fundamentally wrong.

Because overt failure requires multiple faults, there is no isolated ‘cause’ of an accident. There are multiple contributors to accidents. Each of these is necessary insufficient in itself to create an accident. Only jointly are these causes sufficient to create an accident. Indeed, it is the linking of these causes together that creates the circumstances required for the accident.

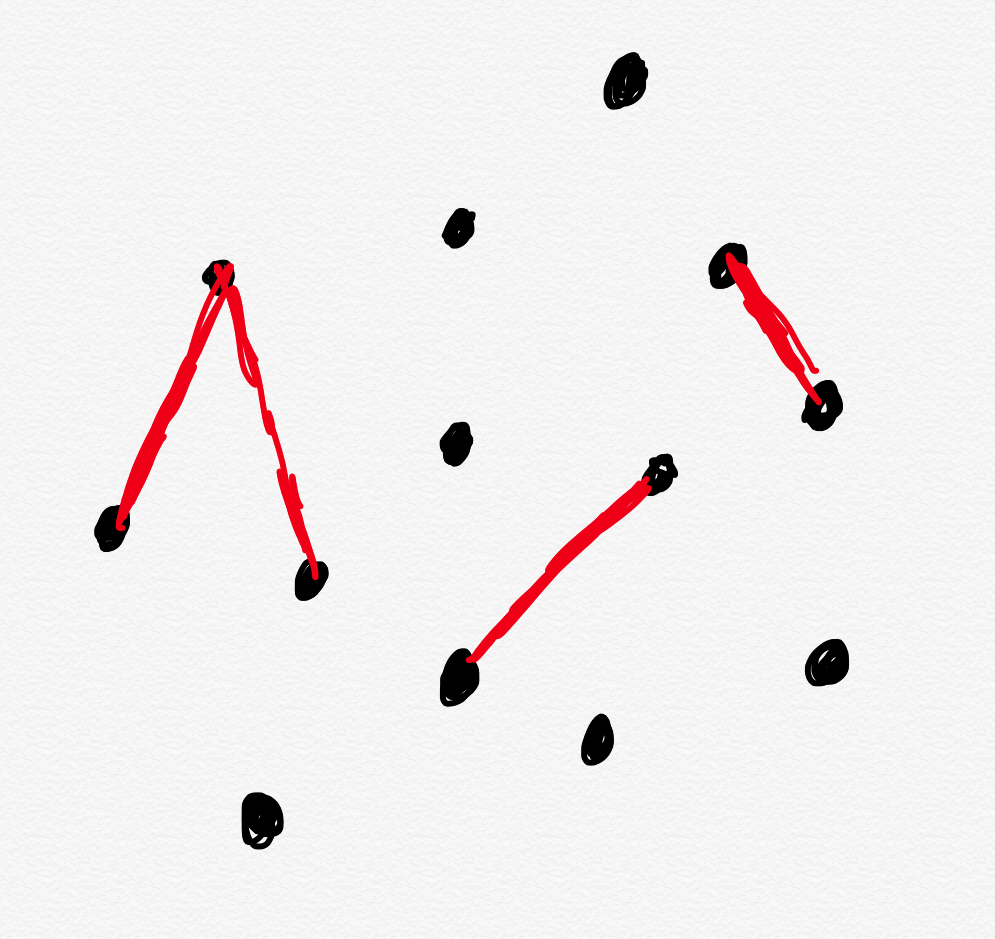
In this model, incidents don’t happen because of a single cause: rather, it’s through the interaction of multiple contributors.

If incidents stem from problematic interactions rather than problematic components, then focusing on components will lead us astray

Under an incident model where incidents are a result of interactions, we wouldn’t expect there to be a Pareto distribution of causes. This means that if we look at a distribution of incidents by contributor (or cause, or component), we’re unlikely to see any one of these stand out as being the source of a large number of incidents. Instead, by looking at the components instead of the interactions, we’re unlikely to see much of any pattern at all.

Turning back to How Complex Systems Fail again:

Complex systems are heavily and successfully defended against failure.

The high consequences of failure lead over time to the construction of multiple layers of defense against failure. These defenses include obvious technical components (e.g.
backup systems, ‘safety’ features of equipment) and human components (e.g. training, knowledge) but also a variety of organizational, institutional, and regulatory defenses (e.g. policies and procedures, certification, work rules, team training). The effect of these measures is to provide a series of shields that normally divert operations away from accidents.

All of these explicit and implicit components of the system work together to keep things up and running. You can think of this as a process that most of the time generates safety (or availability), but sometimes doesn’t. You can think of these failure cases as a sort of error or residual term, they’re the leftover, the weird cases at the edges of our system. I think treating incidents as an error term is a useful metaphor because we don’t fall into the trap of thinking about error terms as looking like Pareto distributions.

This doesn’t mean that there aren’t patterns of failure in our incidents: there absolutely are. But it means that the patterns we need to look for aren’t going to visible if we don’t ask the right questions. It’s the difference between asking “which services were involved?” and “what were the goal conflicts that the engineers were facing?“

What if everybody did everything right?

In the wake of an incident, we want to answer the questions “What happened?” and, afterwards, “What should we do differently going forward?” Invariably, this leads to people trying to answer the question “what went wrong?”, or, even more specifically, the two questions:

  • What did we do wrong here?
  • What didn’t we do that we should have?

There’s an implicit assumption behind these questions that because there was a bad outcome, that there must have been a bad action (or an absence of a good action) that led to that outcome. It’s such a natural conclusion to reach that I’ve only ever seen it questioned by people who have been exposed to concepts from resilience engineering.

In some sense, this belief in bad outcomes from bad actions is like Aristole’s claim that heavier objects fall faster than lighter ones. Intuitively, it seems obvious, but our intuitions lead us astray. But in another sense, it’s quite different, because it’s not something we can test by running an experiment. Instead, the idea that systems fail because somebody did something wrong (or didn’t do something right) is more like a lens or a frame, it’s a perspective, a way of making sense of the incident. It’s like how the fields of economics, psychology, and sociology act as different lenses for making sense of the world: a sociological explanation of a phenomenon (say, the First World War) will be different from an economic explanation, and we will get different insights from the different lenses.

An alternative lens for making sense of an incident is to ask the question “how did this incident happen, assuming that everybody did everything right?” In other words, assume that everybody whose actions contributed to the incident made the best possible decision based on the information they had, and the constraints and incentives that were imposed upon them.

Looking at the incident from this perspective will yield very different kinds of insights, because it will generate different types of questions, such as:

  • What information did people know in the moment?
  • What were the constraints that people were operating under?

Now, I personally believe that the second perspective is strictly superior to the first, but I acknowledge that this is a judgment based on personal experience. However, even if you think the first perspective also has merit, if you truly want to maximize the amount of insight you get from a post-incident analysis, then I encourage you to try to the second perspective as well. Make the claim “Let’s assume everybody did everything right. How could this incident still have happened?” I guarantee, you’ll learn something new about your system that you didn’t know before.