GitHub’s been taking it on the chin on the availability front lately. Yesterday, their CTO, Vlad Fedorov, wrote a post on their blog about their recent incidents: Addressing GitHub’s recent availability issues. This post shares some additional details about three recent incidents. I’ll list them in order that they are mentioned in the post:
- Feb. 9, 2026 – involved an overloaded database cluster
- Feb. 2, 2026 – involved security policies unintentionally blocking access to VM metadata
- Mar. 5, 2026 – involved writes failing on a Redis cluster
First observation: I really appreciate it when a company addresses availability concerns by providing more public details about recent incidents. I always think more of companies that are willing to provide these sorts of details, and I hope GitHub provides even more details about their outages in the future.
Saturation, again and again and again
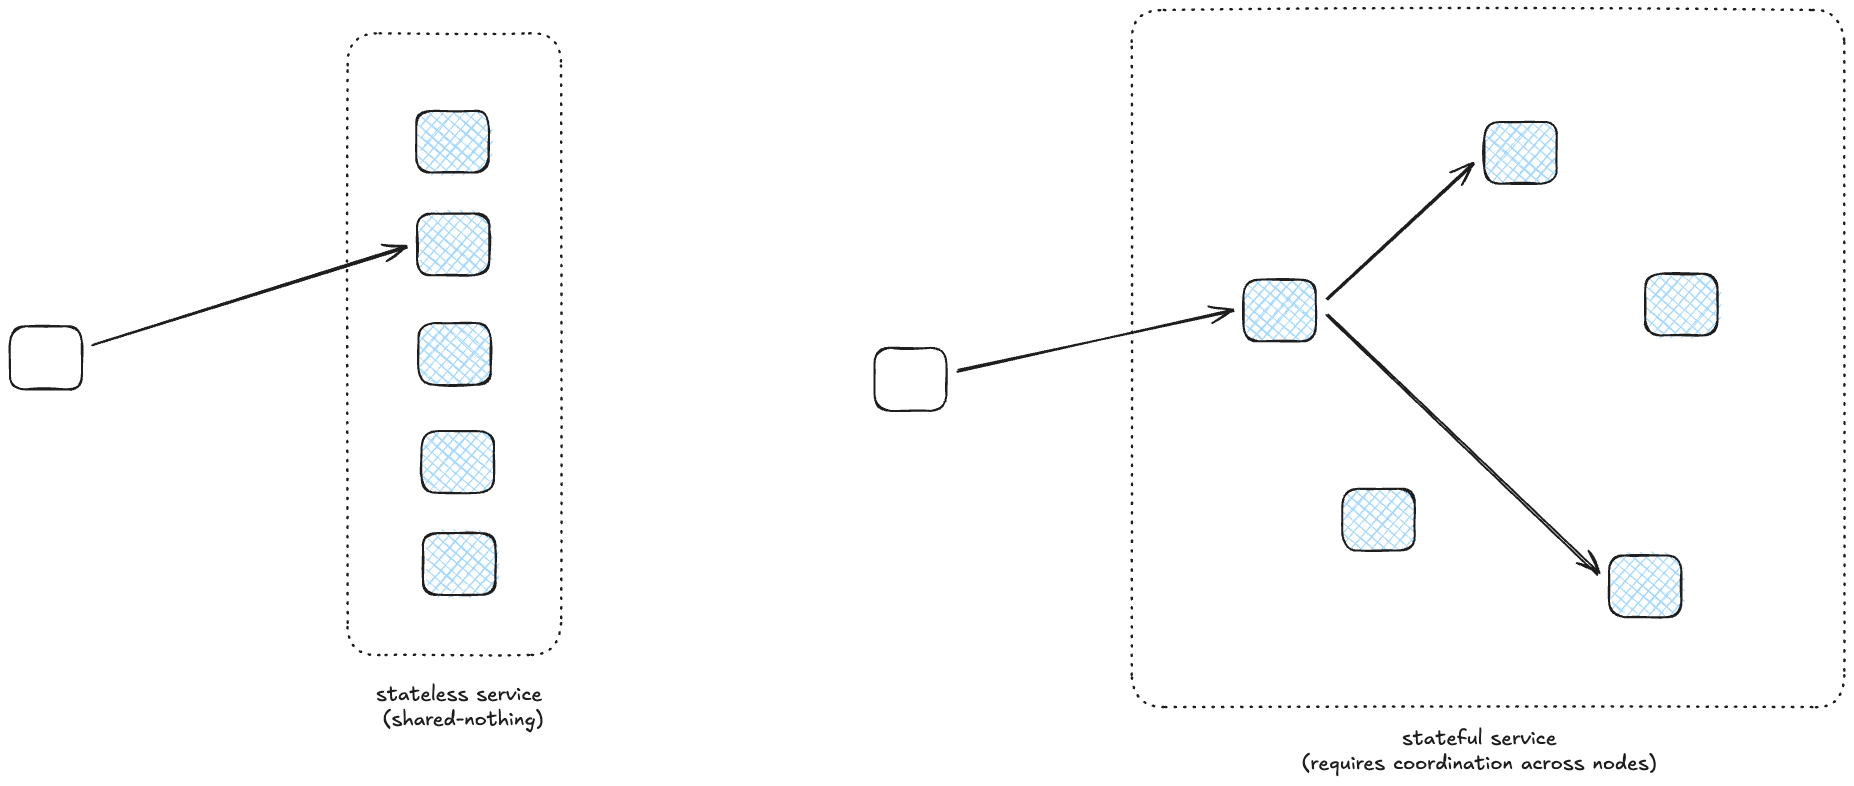
The first incident is a classic example of saturation. In this case, it was an important database cluster that got overloaded. Because databases are much harder to scale up than stateless services, your best bet when dealing with overload is to figure out how to reduce the load so the database can go healthy again. On the other hand, reducing load means denying requests: a “healthy” database that is taking zero traffic has 0% availability! So it’s a balancing act, and the responders are constrained by the infrastructure that currently exists for selectively limiting traffic. Once the overload happens, you can only twist the knobs that you already have available.
Fedorov notes they’re now prioritizing implementing mechanisms to protect against these sorts of scenarios where load increases unexpectedly.
Protecting downstream components during spikes to prevent cascading failures while prioritizing critical traffic loads.
Taking it to the limit, and then over it
Fedorov also provided details on how they ended up seeing so much more traffic than usual. They released a new model (I think it’s an AI model) on a Saturday, when traffic is lower. And then, on Monday, multiple different factors contributed to an increase in traffic that pushed them over the limit. The blog post mentions these four contributors:
- new model release
- they had reduced a user settings cache TTL from 12 hours to 2 hours, increasing write load
- they hit their regular peak load on Monday
- many of their users updated to the new version of their client apps, and this update activity increased read load
They had reduced the TTL so that people would get the new model more quickly, but reducing the TTL means that more cache evictions, which meant more database load.
This compounding effect of multiple factors is pernicious, because it can be hard to reason about why your system hit a tipping point. From the write-up:
While the TTL change was quickly identified as a culprit, it took much longer to understand why the read load kept increasing, which prolonged the incident.
Understanding the role of multiple, independent contributing factors is hard enough in a post-incident analysis, identifying this in the heat of an incident can be damn near impossible.
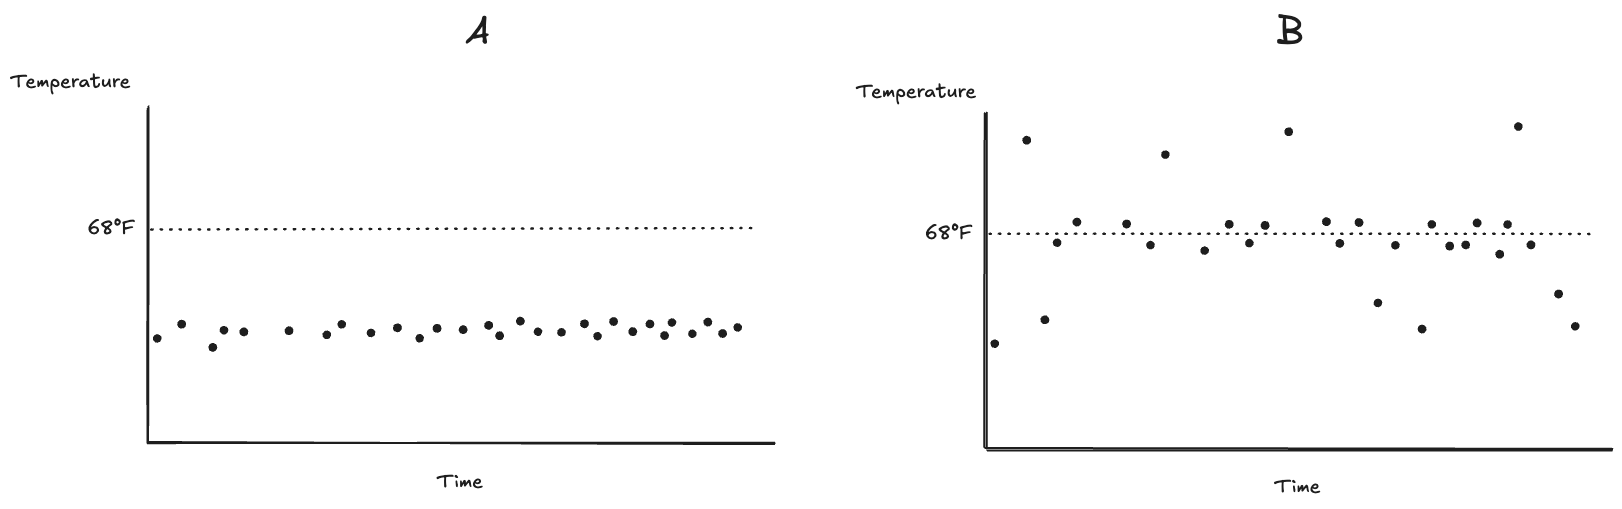
The thing about tipping points is that you don’t notice until you tip
This failure mode was a case where the danger was growing over time, but there were no visible symptoms until they hit the limit.
The architecture was originally selected for simplicity at a time when there were very few models and very few governance controls and policies related to those models. But over time, something that was a few bytes per user grew into kilobytes. We didn’t catch how dangerous that was because the load was visible only during new model or policy rollouts and was masked by the TTL.
The resilience engineering folks would call this an example of a brittle collapse, where a system falls over when it hits the limit. We do our best to monitor for trouble and anticipate trouble ahead, but we’re always going to hit scenarios like this where signals of a problem are being masked, until the perfect storm hits. At that point, we just have to be good at responding. And, hopefully, good at learning as well.
Failovers are a different mode of operation
Their February 2nd incident involved a failover where they had some sort of infrastructure issue in one(?) region. GitHub has mechanisms for automatically shifting traffic to healthy regions, and that mechanism worked here, but there was another issue that they hit:
However, in this case, there was a cascading set of events triggered by a telemetry gap that caused existing security policies to be applied to key internal storage accounts affecting all regions. This blocked access to VM metadata on VM creates and halted hosted runner lifecycle operations.
It was the combination of the traffic failover and a telemetry gap that ultimately led to the outage. (Did the automatic traffic shift end up making things worse? I can’t tell from the write-up). The traffic redirection didn’t create the incident, but it enabled it to happen. Whenever our system runs in an alternate mode, there’s an increased risk that we’ll hit some weird edge case that we haven’t seen before because it doesn’t regularly run in that mode. Automated reliability mechanisms often put our systems in these alternate modes. This means that they can enable novel failure modes.
In fact, the March 5th incident followed a similar pattern, this time it was a Redis cluster primary failover enabled the incident.
The failover performed as expected, but a latent configuration issue meant the failover left the cluster in a state with no writable primary.
Reliability vs security, the eternal struggle
The Feb 2nd incident also illustrates the fundamental tradeoff between reliability and security. Reliability’s job is to ensure service access to the users who are supposed to have it. Security’s job is to deny service access to the users that aren’t supposed to have it. These two forces are are in tension, as we see in this incident where a security mechanism denied access.
It’s not just about automation, it’s about more options for responders
In the Feb 9th incident, Fedorov notes how the responders lacked certain functionality that would have helped them mitigate (emphasis mine)
Further, due to the interaction between different services after the database cluster became overwhelmed, we needed to block the extra load further up the stack, and we didn’t have sufficiently granular switches to identify which traffic we needed to block at that level.
He also notes how they had to manually recover from the March 5th incident:
With writes failing and failover not available as a mitigation, we had to correct the state manually to mitigate.
I hope they don’t pull all of their eggs in the “automation” basket in their remediations. For the first incident in particular, automated load shedding is tricky to get right, it’s hard to reason about, and you won’t have experience with the behavior of this new automation until either you have the incident, or until the automation actually creates an incident (e.g., opens a circuit breaker when it shouldn’t). Making it easier for the responders to manually control load shedding during an incident is important as well.
More generally, reliability work isn’t just about putting in automated mechanisms to handle known failure modes. It’s also about setting up the incident responders for success by providing them with as many resources as possible before the next incident happens. In this context, resources means the ability to manually control different aspects of the infrastructure, whether that’s selective traffic blocking, manually updating database state, or many of the other potential remediations that a responder might have to do. The more flexibility they have, the more room to maneuver (to use David Woods’s phrase), the easier it will be for them to improvise a solution, and the faster the next surprising incident will be mitigated.