Scene 1: A meeting room in an office. The walls are adorned with whiteboards with boxes and arrows.
EM: So, do you think the team will be able to finish all of these features by end of the Q2?
TL: Well, it might be a bit tight, but I think it should be possible, depending on where we set the carefulness knob.
EM: What’s the carefulness knob?
TL: You know, the carefulness knob! This thing.
TL leans over and picks a small box off of the floor and places it on the table. The box has a knob on it with numerical markings.
EM: I’ve never seen that before. I have no idea what it is.
TL: As the team does development, we have to make decisions about how much effort to spend on testing, how closely to hew to explicitly documented processes, that sort of thing.
EM: Wait, aren’t you, like, careful all of the time? You’re responsible professionals, aren’t you?
TL: Well, we try our best to allocate our effort based on what we estimate the risk to be. I mean, we’re a lot more careful when we do a database migration than we do when we fix a typo in the readme file!
EM: So… um… how good are you at actually estimating risk? Wasn’t that incident that happened a few weeks ago related to a change that was considered a low risk at the time?
TL: I mean, we’re pretty good. But we’re definitely not perfect. It certainly happens that we misjudge the risk sometimes. I mean, in some sense, isn’t every incident in some sense a misjudgment of risk? How many times do we really say, “Hoo boy, this thing I’m doing is really risky, we’re probably going to have an incident!” Not many.
EM: OK, so let’s turn that carefulness knob up to the max, to make sure that the team is careful as possible. I don’t want any incidents!
LM: Sounds good to me! Of course, this means that we almost certainly won’t have these features done by the end of Q2, but I’m sure that the team will be happy to hear…
EM: What, why???
TL picks up a marker off of the table and walks up to the whiteboard. She draws an x axis and y-axis. She labels the x-axis “carefulness” and the y-axis “estimated completion time”.
TL: Here’s our starting point: the carefulness knob is currently set at 5, and we can properly hit end of Q2 if we keep it at this setting.
EM: What happens if we turn up the knob?
TL draws an exponential curve.
EM: Woah! That’s no good. Wait, if we turn the carefulness knob down, does that mean that we can go even faster?
TL: If we did that, we’d just be YOLO’ing our changes, not doing validation. Which means we’d increase the probability of incidents significantly, which end up taking a lot of time to deal with. I don’t think we’d actually end up delivering any faster if we chose to be less careful than we normally are.
EM: But won’t we also have more incidents at a carefulness setting of 5 than at higher carefulness settings?
TL: Yes, there’s definitely more of a risk that a change that we incorrectly assess as low risk ends up biting us at our default carefulness level. It’s a tradeoff we have to make.
EM: OK, let’s just leave the carefulness knob at the default setting.
Scene 2: An incident review meeting, two and a half months later.
X: We need to be more careful when we make these sorts of changes in the future!
Fin
Coda
It’s easy to forget that there is a fundamental tradeoff between how careful we can be and how much time it will take us to perform a task. This is known as the efficiency-thoroughness trade-off, or ETTO principle.
You’ve probably hit a situation where it’s particularly difficult to automate the test for something, and doing the manual testing is time-intensive, and you developed the feature and tested it, but then there was a small issue that you needed to resolve, and then do you go through all of the manual testing again? We make these sort of time tradeoffs in the small, they’re individual decisions, but they add up, and we’re always under schedule pressure to deliver.
As a result, we try our best to adapt to the perceived level of risk in our work. The Human and Organizational Performance folks are fond of the visual image of the black line versus the blue line to depict the difference between how the work is supposed to be done with how workers adapt to get their work done.
But sometimes these adaptations fail. And when this happens, inevitably someone says “we need to be more careful”. But imagine if you explicitly asked that person at the beginning of a project about where they wanted to set that carefulness knob, and they had to accept that increasing the setting would increase the schedule significantly. If an incident happened, you could then say to them, “well, clearly you set the carefulness knob too low at the beginning of this project”. Nobody wants to explicitly make the tradeoff between less careful and having a time estimate that’s seen as excessive. And so the tradeoff gets made implicitly. We adapt as best we can to the risk. And we do a pretty good job at that… most of the time.
When I first learned about the mutual exclusion problem, it seemed easy and the published algorithms seemed needlessly complicated. So, I dashed off a simple algorithm and submitted it to CACM. I soon received a referee’s report pointing out the error. This had two effects. First, it made me mad enough at myself to sit down and come up with a real solution. The result was the bakery algorithm described in [12]. The second effect was to arouse my interest in verifying concurrent algorithms.
Modeling concurrency control in database systems is a great use case for TLA+, so I decided to learn use TLA+ to learn more about database isolation. This post is about modeling serializability.
You can find all of the the TLA+ models referenced in this post in my snapshot-isolation-tla repo. This post isn’t about snapshot isolation at all, so think of the name as a bit of foreshadowing of a future blog post, which we’ll discuss at the end.
Modeling a database for reasoning about transaction isolation
In relational databases, data is modeled as rows in different tables, where each table has a defined set of named columns, and there are foreign key relationships between the tables.
However, when modeling transaction isolation, we don’t need to worry about those details. For the purpose of a transaction, all we care about is if any of the columns of a particular row are read or modified. This means we can ignore details about tables, columns, and relations. All we care about are the rows.
The transaction isolation literature talks about objects instead of rows, and that’s the convention I’m going to use. Think of an object like a variable that is assigned a value, and that assignment can change over time. A SQL select statement is a read, and a SQL update statement is a write.
An example of how we’re modeling the database
Note that the set of objects is fixed during the lifetime of the model, it’s only the values that change over time. I’m only going to model reads and writes, but it’s simple enough to extend this model to support creation and deletion by writing a tombstone value to model deletion, and having a not-yet-created-stone value to model an object that has not yet been created in the database.
I’ll use the notation r[obj, val] to refer to a read operation where we read the object obj and get the value val and w[obj, val] to mean where we write the value val to obj. So, for example, setting x=1 would be: w[x, 1], and reading the value of x as 1 would be r[x, 1].
I’m going to use Obj to model the set of objects, and Val to model the set of possible values that objects can take on.
Obj is the set of objects, Val is the set of values that can be assigned to objects
We can model the values of the objects at any point in time as a function that maps objects to values. I’ll call these sorts of functions environments (env for short) since that’s what people who write interpreters call them.
Example of an environment
As an example of syntax, here’s how we would assert in TLA+ that the variable env is a function that maps element of the set Obj to elements of the set Val:
The execution of concurrent SQL-transactions at isolation level SERIALIZABLE is guaranteed to be serializable. A serializable execution is defined to be an execution of the operations of concurrently executing SQL-transactions that produces the same effect as some serial execution of those same SQL-transactions. A serial execution is one in which each SQL-transaction executes to completion before the next SQL-transaction begins.
An execution history of reads and writes is serializable if it is equivalent to some other execution history where the committed transactions are scheduled serially (i.e., they don’t overlap in time). Here’s an example of a serializable execution history.
It’s important to remember that a specification is just a set of behaviors (series of state transitions). We’re going to use TLA+ to define the set of all of the behaviors that we consider valid for serializability. Another way to put that is that our specification is the set of all serializable executions.
We want to make sure that if we build an implementation, all of the behaviors permitted by the implementation are a subset of our serializability specification.
Note: Causality is not required
Here’s an example of an execution history that is serializable according to the definition:
This looks weird to us because the write happens after the read: T1 is reading data from the future!
But the definition of serializability places no constraints on the ordering of the transaction, for that you need a different isolation level: strict serializability. But we’re modeling serializability, not strict serializability, so we allow histories like the one above in our specification.
(I’d say “good luck actually implementing a system that can read events from the future”, but in distributed databases when you’re receiving updates from different nodes at different times, some pretty weird stuff can happen…)
If you’d like to follow along as we go, my Serializable TLA+ model is in the github repo (source, pdf).
Externally visible variables
My specification will generate operations (e.g., reads, writes, commits, aborts). The four externally visible variables in the specification are:
Variable name
Description
op
the operation (read, write, commit, abort), modeled as a single letter: {“r”, “w”, “c”, “a”} )
arg
the argument(s) to the operation
rval
the return value of the operation
tr
the transaction executing the operation
Here’s the serializable example from earlier:
The execution history shown above can be modeled as a TLA+ behavior like this:
Initial state of the specification
We need to specify the set of valid initial states. In the initial state of our spec, before any operations are issued, we determine:
which transactions will commit and which will abort
the order in which the transactions will occur
the value of the environment for each committed transaction at the beginning and at the end of its lifetime
This is determined by using three internal variables whose values are set in the initial state:
Variable
Description
fate
function which encodes which transactions commit and which abort
to
transaction order
benv
the value of the environments at the beginning/end of each transaction
We couldn’t actually implement a system that could predict in advance whether a transaction will commit or abort, but it’s perfectly fine to use these for defining our specification.
The values of these variables are specified like this:
In our initial state, our specification chooses a fate, ordering, and begin/end environments for each transaction. Where Orderings is a helper operator:
As an example, consider a behavior with three transactions fated to commit, where the fated transaction order is:
T2
T3
T1
Furthermore, assume the following starting environments for each transaction:
T1: [x=2, y=5, z=3] T2: [x=0, y=0, z=0] T3: [x=0, y=1, z=0] Finally, assume that the final environment state (once T1 completes) is [x=2,y=5,z=1].
We can visually depict the committed transactions like like this:
Reads and writes
You can imagine each transaction running in parallel. As long as each transaction’s behavior is consistent with its initial environment, and it ends up with its final environment the resulting behavior will be serializable. Here’s an example.
Each transaction has a local environment, tenv. If the transaction is fated to commit, its tenv is initialized to its benv at the beginning:
where:
Here’s an example that shows how tenv for transaction T3 varies over time:
benv is fixed, but tenv for each transaction varies over time based on the writes
If the transaction is fated to abort, then we don’t track its environment in tenv, since any read or write is valid.
A valid behavior, as the definition of serializability places no constraints on the reads of an aborted transaction
Actions permitted by the specification
The specification permits the following actions:
commit transaction
abort transaction
read a value
write a value
I’m not modeling the start of a transaction, because it’s not relevant to the definition of serializability. We just assume that all of the transactions have already started.
In TLA+, we specify it like this:
Note that there are no restrictions here on the order in which operations happen. Even if the transaction order is [T2, T3, T1], that doesn’t require that the operations from T2 have to be issued before the other two transactions.
Rather, the only constraints for each transaction that will commit is that:
Its reads must be consistent with its initial environment, as specified by benv.
Its local environment must match the benv of the next transaction in the order when it finally commits.
We enforce (1) in our specification by using a transaction-level environment, tenv, for the reads. This environment gets initialized to benv for each transaction, and is updated if the transaction does any writes. This enables each transaction to see its own writes.
We enforce (2) by setting a precondition on the Commit action that it can only fire when tenv for that transaction is equal to benv of the next transaction:
Termination
If all of the transactions have committed or aborted, then the behavior is complete, which is modeled by the Termination sub-action, which just keeps firing and doesn’t change any of the variables:
Liveness
In our specification, we want to ensure that every behavior eventually satisfies the Termination action. This means that all transactions either eventually commit or abort in every valid behavior of the spec. In TLA+, we can describe this desired property like this:
The diamond is a temporal operator that means “eventually”.
To achieve this property, we need to specify a liveness condition in our specification. This is a condition of the type “something we want to happen eventually happens”.
We don’t want our transactions to stay open forever.
For transactions that are fated to abort, they must eventually abort
For transactions that are fated to commit, they must eventually commit
We’re going to use weak and strong fairness to specify our liveness conditions; for more details on liveness and fairness, see my post a liveness example in TLA+.
Liveness for aborts
We want to specify that everyone transaction that is fated to abort eventually aborts. To do this, we can use weak fairness.
This says that “the Abort action cannot be forever enabled without the Abort action happening”.
Here’s the Abort action.
The abort action is enabled for a transaction t if the transaction is in the open state, and its fate is Aborted.
Liveness for commits
The liveness condition for commit is more subtle. A transaction can only commit if its local environment (tenv) matches the starting environment of the transaction that follows it in transaction order (benv).
Consider two scenarios: one where tenv matches the next benv, and one where it doesn’t:
We want to use fairness to specify that every transaction fated to commit eventually reaches the state of scenario 1 above. Note that scenario 2 is a valid state in a behavior, it’s just not a state from which a commit can happen.
Consider the following diagram:
For every value of tenv[Ti], the number of variables that match the values in benv[i+1] is somewhere between 0 and 5. In the example above, there are two variables that match, x and z.
Note that the Commit action is always enabled when a transaction is open, so with every step of the specification, tenv can move left or right in the diagram above, with a min of 0 and a max of 5.
We need to specify “tenv always eventually moves to the right”. When tenv is at zero, we can use weak fairness to specify that it eventually moves from 0 to 1.
To specify this, I defined a function W(0, 1) which is true when tenv moves from 0 to 1:
Where M(env1, env2) is a count of the number of variables that have the same value:
This means we can specify “tenv cannot forever stay at 0” using weak fairness, like this:
We also want to specify that tenv eventually moves from 1 matches to 2, and then from 2 to 3, and so on, all of the way from 4 to all 5. And then we also want to say that it eventually goes from all matches to commit.
We can’t use weak fairness for this, because if tenv is at 1, it can also change to 0. However, the weak fairness of W(0,1) ensures that it if it goes from 1 down to 0, it will always eventually go back to 1.
Instead, we need to use strong fairness, which says that “if the action is enabled infinitely often, then the action must be taken”. We can specify strong fairness for each of the steps like this:
Recall that Obj is the set of objects {x, y, z, …}, and Cardinality refres to the size of the set. We also need to specify strong fairness on the commit action, to ensure that we eventually commit if all variables matching is enabled infinitely often:
Now putting it all together, here’s one way to specify the liveness condition, which is conventionally called L.
Once again, the complete model is in the github repo (source, pdf).
How do we know our spec is correct?
We can validate our serializable specification by creating a refinement mapping to a sequential specification. Here’s a simple sequential specification for a key-value store, Sequential.tla:
I’m not going to get into the details of the refinement mapping in this post, but you can find it at in the SerializabilityRefinement model (source, pdf).
OK, but how do you know that this spec is correct?
It’s turtles all of the way down! This is really the bottom in terms of refinement, I can’t think of an even simpler spec that we can use to validate this one.
However, one thing we can do is specify invariants that we can use to validate the specification, either with the model checker or by proof.
For example, here’s an invariant that checks whether each write has an associated read that happened before:
where:
But what happens if there’s no initial write? In that case, we don’t know what the read should be. But we do know that we don’t want to allow two successive reads to read different values, for example:
r[x,3], r[x,4]
So we can also specify this check as an invariant. I called that SuccessiveReads, you can find it in the MCSequential model (source, pdf).
The value of formalizing the specification
Now that we have a specification for Serializability, we can use it to check if a potential concurrency control implementation actually satisfies this specification.
That was my original plan for this blog post, but it got so long that I’m going to save that for a future blog post. In that future post, I’m going to model multi-version concurrency control (MVCC) and show how it fails to satisfy our serializability spec by having the model checker find a counterexample.
However, in my opinion, the advantage of formalizing a specification is that it forces you to think deeply about what it is that you’re specifying. Finding counter-examples with the model checker is neat, but the real value is the deeper understanding you’ll get.
This is one of my favorite bits from fellow anglophone Québécois Norm McDonald:
Norm: not a lung expert
One of the goals I believe that we all share for post-incident work is to improve the system. For example, when I wrote the post Why I don’t like discussing action items during incident reviews, I understood why people would want to focus on action items: precisely because they share this goal of wanting to improve the system (As a side note, Chris Evans of incident.io wrote a response: Why I like discussing actions items in incident reviews). However, what I want to write about here is not the discussion of action items, but focusing on what went wrong versus what went right.
“How did things go right?”
How did things go right is a question originally posed by the safety researcher Erik Hollnagel, in his the safety paradigm that he calls Safety-II. The central idea is that things actually go right most of the time, and if you want to actually improve the system, you need to get a better understanding of how the system functions, which means you need to broaden your focus beyond the things that broke.
It’s with this how did things go right lens that I want to talk a little bit about incident review.
Beyond “what went well”
Now, in most incident writeups that I’ve read, there is a “what went well” section. However, it’s typically the smallest section in the writeup, with maybe a few bullet points: there’s never any real detail there.
Personally, I’m looking for details like how an experienced engineer recognized the symptoms enough to get a hunch about where to look next, reducing the diagnostic time by hours. Or how engineers leveraged an operational knob that was originally designed for a different purpose. I want to understand how experts are able to do the work of effectively diagnosing problems, mitigating impact, and remediating the problem.
Narrowly, I want to learn this because I want to get this sort of working knowledge into other people’s heads. More broadly, I want to bring to light the actual work that gets done.
We don’t know how the system works
Humans adapt to the constraints they face in order to get their work done. Look for these adaptations if you want to understand the work better.
— @norootcause.surfingcomplexity.com on Bluesky (@norootcause) October 13, 2024
Safety researchers make a distinction between work-as-imagined and work-as-done. We think we understand how the day-to-day work gets done, but we actually don’t. Not really. To take an example from software, we don’t actually know how people really use the tooling to get their work done, and I can confirm this by being on-call for internal support for development tools in previous jobs. (“You’re using our tool to do what?” is not an uncommon reaction from the on-call person). People do things we never imagined, in both wonderful and horrifying ways (sometimes at the same time!).
We also don’t see all of the ways that people coordinate to get their work done. There are the meetings, the slack messages, the comments on the pull requests, but there’s also the shared understanding, the common knowledge, the stuff that everybody knows that everybody else knows, that enables people to get this work done, while reducing the amount of explicit communication that has to happen.
What’s remarkable is that these work patterns, well, they work. These people in your org are able to get their stuff done, almost all of the time. Some of them may exhibit mastery of the tooling, and others may use the tooling in ways even it was never intended that are fundamentally unsafe. But we’re never going to actually know unless we actually look at how they’re doing their work.
Because how people do their work is how the system works. And if we’re going to propose and implement interventions, it’s very likely that the outcomes of the interventions will surprise us, because these changes might disrupt effective ways of doing work, and people will adapt to those interventions in ways we never anticipated, and in ways we may never even know if we don’t take a look.
Then why use incidents to look at things that go right?
At first glance, it does seem odd to use incidents as the place to examine where work goes well: given that incidents are times where something unquestionably went wrong. It would be wonderful if we could study how work happens when things are going well. Heck, I’d love to see companies have sociologists or anthropologists on staff to study how the work happens at the company. Regrettably, though, incidents are one of the only times when the organization is actually willing to devote resources (specifically, time) on examining work in fine-grained detail.
We can use incidents to study how things go well, but we have to keep a couple of things in mind. One, we need to recognize that adaptations that fail led to an incident are usually successful, which is why people developed those adaptations. Note that because an adaptation usually works, doesn’t mean that it’s a good thing to keep doing: an adaptation could be a dangerous workaround to a constraint like a third-party system that can’t be changed directly and so must be awkwardly worked around.
Second, we need to look in more detail, to remark, at incident response that is remarkable. When incident response goes well, there is impressive diagnostic, coordination, and improvisation work to get the system back to healthy. These are the kinds of skills you want to foster across your organization. If you want to build tools to make this work even better, you should take the time to understand just how this work is done today. Keep this in mind when you’re proposing new interventions. After all, if you don’t examine what worked, how will you know what works?
I’m not a fan of talking about action items during incident reviews.
My whole shtick is that I believe updating people's mental models will have a more significant positive impact on the system than discussing action items, but boy is that a tough sell.
— @norootcause@hachyderm.io on mastodon (@norootcause) September 26, 2024
First, let’s talk about what an incident review is. It’s a meeting that takes place not too long after an incident has occurred, to discuss the incident. In many organizations, these meetings are open to any employee interested in attending, which means that these can have potentially large and varied audiences.
I was going to write “the goal of an incident review is…” in the paragraph above, but the whole purpose of this post is to articulate how my goals differ from other people’s goals.
My claims
Nobody fully understands how the system works. Once a company reaches a certain size, the software needs to get broken up across different teams. Ideally, the division is such that the teams are able to work relatively independent of each other. These are well-defined abstractions that lead to low coupling that we all prize in large-scale systems. As a consequence, there’s no single person who actually fully understands how the whole system works. It’s just too large and complex. And this actually understates the problem, given the complexity of the platforms we build on top of. Even if I’m the sole developer of a Java application, there’s a good chance that I don’t understand the details of the garbage collection behavior of the JVM I’m using.
The gaps in our understanding of how the system works contributes to incidents. Because we don’t have a full understanding of how the system works, we can’t ever fully reason about the impact of every single change that we make. I’d go so far as to say that, in every single incident, there’s something important that somebody didn’t know. That means that gaps in our understanding are dangerous in addition to being omnipresent.
The way that work is done profoundly affects incidents, both positively and negatively, butthat work is mostly invisible. Software systems are socio-technical systems, and the work that the people in your organization do every day is part of how the system works. This day-to-day work enables, trigger, exacerbate, prevent, lessen, and remediate incidents. And sometimes the exact same work in one context will prevent an incident and in another context will enable an incident! However, we generally don’t see what the real work is like. I’m lucky if my teammates have any sense of what my day-to-day work looks like, including how I use the internal tools to accomplish this work. The likelihood that people on other teams know how I do this work is close to zero. Even the teams that maintain the internal tooling have few opportunities to see this work directly.
Incident reviews are an opportunity for many people to gain insight into how the system works. An incident review is an opportunity to examine an aspect of the socio-technical system in detail. It’s really the only meeting of its kind where you can potentially have such a varied cross-section of the company getting into the nitty-gritty details of how things work. Incident reviews give us a flashlight that we get to shine on a dark corner of the system.
The best way to get a better understanding of how the system behaves is to look at how the system actually behaved. This phrasing should sound obvious, but it’s the most provocative of these claims. Every minute you spend discussing action items is a minute you are not spending learning more about how the system behaved. I feel similarly about discussing counterfactuals (if there had been an alert…). These discussions take the focus away from how the system actually behaved, and enter a speculative world about how the system might behave under a different set of circumstances.
We don’t know what other people don’t know We all have incomplete, out-of-date models of how the system works, that includes our models of other people’s models! That means that, in general, we don’t know what other people don’t know about the system. We don’t know in advance what people are going to learn that they didn’t know before!
There are tight constraints on incident review meetings. There is a fixed amount of time in an incident review meeting, which means that every minute spend on topic X means one less minute to spend discussing topic Y. Once that meeting is over, the opportunity of bringing in this group of people together to update their mental models is now gone.
Action item discussions are likely to be of interest to a smaller fraction of the audience. This is a very subjective observation, but my theory is that people tend to find that incident reviews don’t have a lot of value precisely because they focus too much of the time on discussing action items, and the details of the proposed action items are of potential interest to only a very small subset of the audience.
Teams are already highly incentivized to implement action items that prevent recurrence. Often I’ll go to an incident review, and there will be mention of multiple action items that have already been completed. As an observer, I’ve never learned anything from hearing about these.
A learning meeting will never happen later, but action items discussion will. There’s no harm in having an action item discussion in a future meeting. In fact, teams are likely to have to do this when they do their planning work for the next quarter. However, once the incident review meeting is over, the opportunity for having a learning-style meeting is gone, because the org’s attention is gone and off to the next thing.
More learning up-front will improve the quality of action items. The more you learn about the system, the better your proposed action items are likely to be. But the reverse isn’t true.
Why not do both learning and action items during an incident review?
Hopefully the claims above address the question of why not do both activities. There’s a finite amount of time in an incident review meeting, which means there’s a fundamental tradeoff between time spent learning and time spent discussing action items, and I believe that devoting the entire time to learning will maximize the return-on-investment of the meeting. I also believe that additional action item discussions are much more likely to be able to happen after the incident review meeting, but that learning discussions won’t.
Why I think people emphasize action items
Here’s my mental model as to why I think people are so keen on emphasizing action items as the outcome of a meeting.
Learning is fuzzy, actions are concrete. An incident review meeting is an expensive meeting for an organization. Action items are a legible outcome of a meeting, they are an indicator to the organization that the meeting had value. The value of learning, of updated mental models, is invisible.
Incidents make orgs uncomfortable and action items reassure them. Incidents are evidence that we are not fully in control of our system, and action items make us feel like this uncomfortable uncertainty has been addressed.
Back in August, Murat Derimbas published a blog post about the paper by Herlihy and Wing that first introduced the concept of linearizability. When we move from sequential programs to concurrent ones, we need to extend our concept of what “correct” means to account for the fact that operations from different threads can overlap in time. Linearizability is the strongest consistency model for single-object systems, which means that it’s the one that aligns closest to our intuitions. Other models are weaker and, hence, will permit anomalies that violate human intuition about how systems should behave.
Beyond introducing linearizability, one of the things that Herlihy and Wing do in this paper is provide an implementation of a linearizable queue whose correctness cannot be demonstrated using an approach known as refinement mapping. At the time the paper was published, it was believed that it was always possible to use refinement mapping to prove that one specification implemented another, and this paper motivated Leslie Lamport and Martín Abadi to propose the concept of prophecyvariables.
I have long been fascinated by the concept of prophecy variables, but when I learned about them, I still couldn’t figure out how to use them to prove that the queue implementation in the Herlihy and Wing paper is linearizable. (I even asked Leslie Lamport about it at the 2021 TLA+ conference).
Recently, Lamport published a book called The Science of Concurrent Programs that describes in detail how to use prophecy variables to do the refinement mapping for the queue in the Herlihy and Wing paper. Because the best way to learn something is to explain it, I wanted to write a blog post about this.
In this post, I’m going to assume that readers have no prior knowledge about TLA+ or linearizability. What I want to do here is provide the reader with some intuition about the important concepts, enough to interest people to read further. There’s a lot of conceptual ground to cover: to understand prophecy variables and why they’re needed for the queue implementation in the Herlihy and Wing paper requires an understanding of refinement mapping. Understanding refinement mapping requires understanding the state-machine model that TLA+ uses for modeling programs and systems. We’ll also need to cover what linearizability actually is.
We’ll going to start all of the way at the beginning: describing what it is that a program should do.
What does it mean for a program to be correct?
Think of an abstract data type (ADT) such as a stack, queue, or map. Each ADT defines a set of operations. For a stack, it’s push and pop , for a queue, it’s enqueue and dequeue, and for a map, it’s get, set, and delete.
Let’s focus on the queue, which will be a running example throughout this blog post, and is the ADT that is the primary example in the linearizability paper. Informally, we can say that dequeue returns the oldest enqueued value that has not been dequeued yet. It’s sometimes called a “FIFO” because it exhibits first-in-first-out behavior. But how do we describe this formally?
Think about how we would test that a given queue implementation behaves the way we expect. One approach is write a test that consists of a history of enqueue and dequeue operations, and check if our queue returns the expected values.
Here’s an example of an execution history, where enq is the enqueue operation and deq is the dequeue operation. Here I assume that enq does not return a value.
If we have a queue implementation, we can make these calls against our implementation and check that, at each step in the history, the operation returns the expected value, something like this:
Of course, a single execution history is not sufficient to determine the correctness of our queue implementation. But we can describe the set of every possible valid execution history for a queue. The size of this set is infinite, so we can’t explicitly specify each history like we did above. But we can come up with a mathematical description of the set of every possible valid execution history, even though it’s an infinite set.
Specifying valid execution histories: the transition-axiom method
In order to specify how our system should behave, we need a way of describing all of its valid execution histories. We are particularly interested in a specification approach that works for concurrent and distributed systems, since those systems have historically proven to be notoriously difficult for humans to reason about.
In the 1980s, Leslie Lamport introduced a specification approach that he called the transition-axiom method. He later designed TLA+ as a language to support specifying systems using the transition-axiom method.
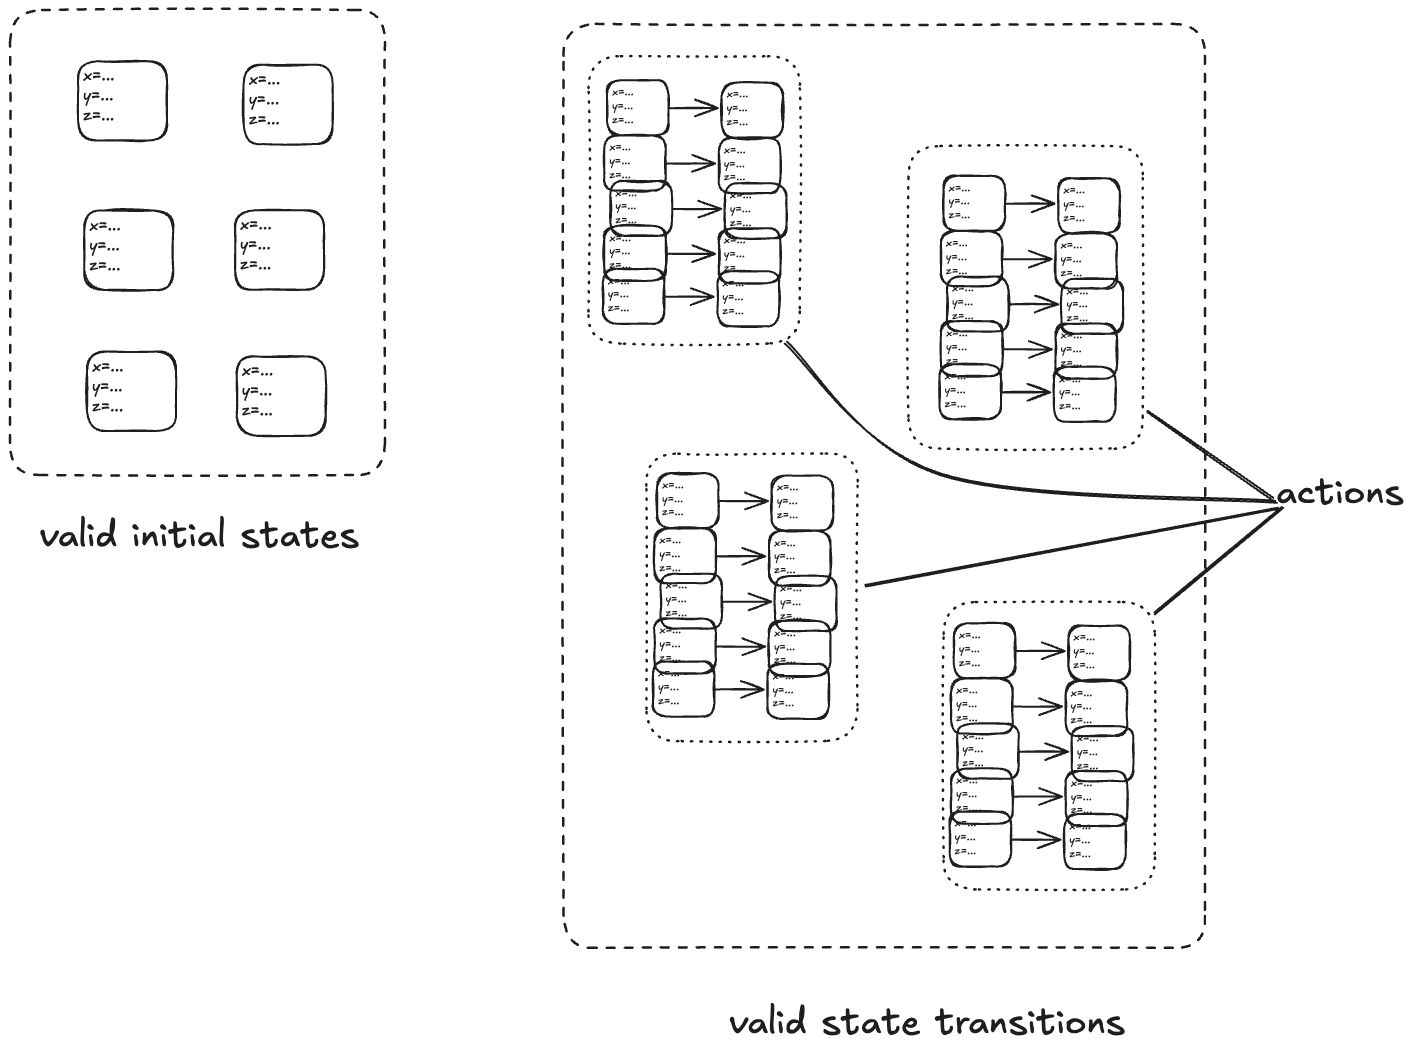
The transition-axiom method uses a state-machine model to describe a system. You describe a system by describing:
The set of valid initial states
The set of valid state transitions
(Aside: I’m not covering the more advanced topic of livenessin this post).
A set of related state transitions is referred to as an action. We use actions in TLA+ to model the events we care about (e.g., calling a function, sending a message).
With a state-machine description, we can generate all sequences that start at one of the initial states and transition according to the allowed transitions. A sequence of states is called a behavior. A pair of successive states is called a step.
Each step in a behavior must be a member of one of the actions. In the diagram above, we would call the first step an A-step because it is a step that is a member of the A action.
We refer to the set that includes all of the actions as the next-state action, which is typically called Next in TLA+ specifications.
In the example above, we would say that A, B, C are sub-actions of the Next action.
We call the entire state-machine description a specification: it defines the set of all allowed behaviors.
To make things concrete, let’s start with a simple example: a counter.
You think distributed systems is about trying to accomplish complex tasks, and then you read the literature and it's like "consider the problem of incrementing a counter", and it turns out that distributed systems is about how the simplest tasks become mind-bogglingly complex. https://t.co/4O2jfgfGQV
— @norootcause@hachyderm.io on mastodon (@norootcause) May 21, 2020
Modeling a counter with TLA+
Consider a counter abstract data type, that has only two operations:
inc – increment the counter
get – return the current value of the counter
reset – return the value of the counter to zero
Here’s an example execution history.
inc()
inc()
get() → 2
get() → 2
reset()
get() → 0
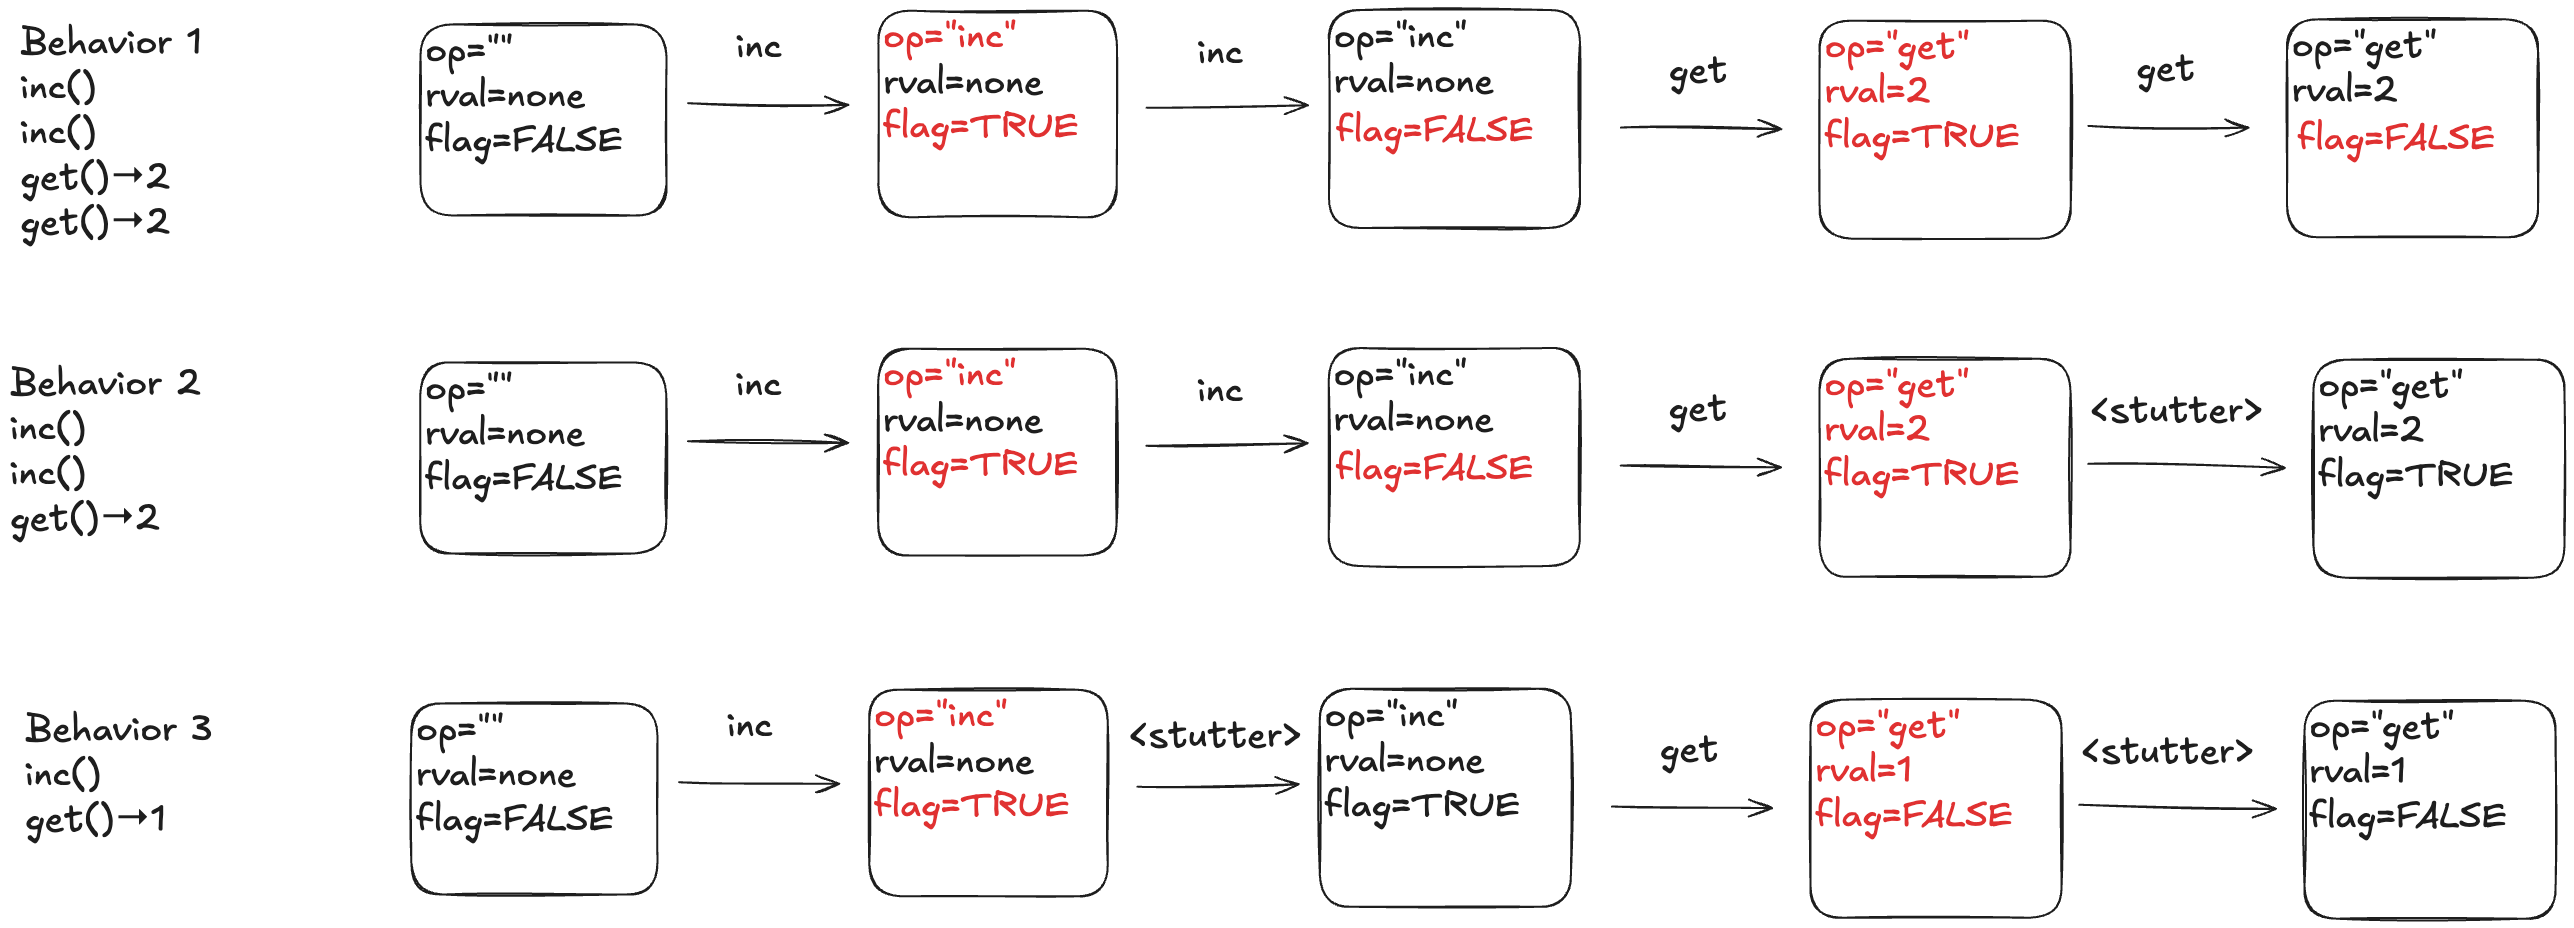
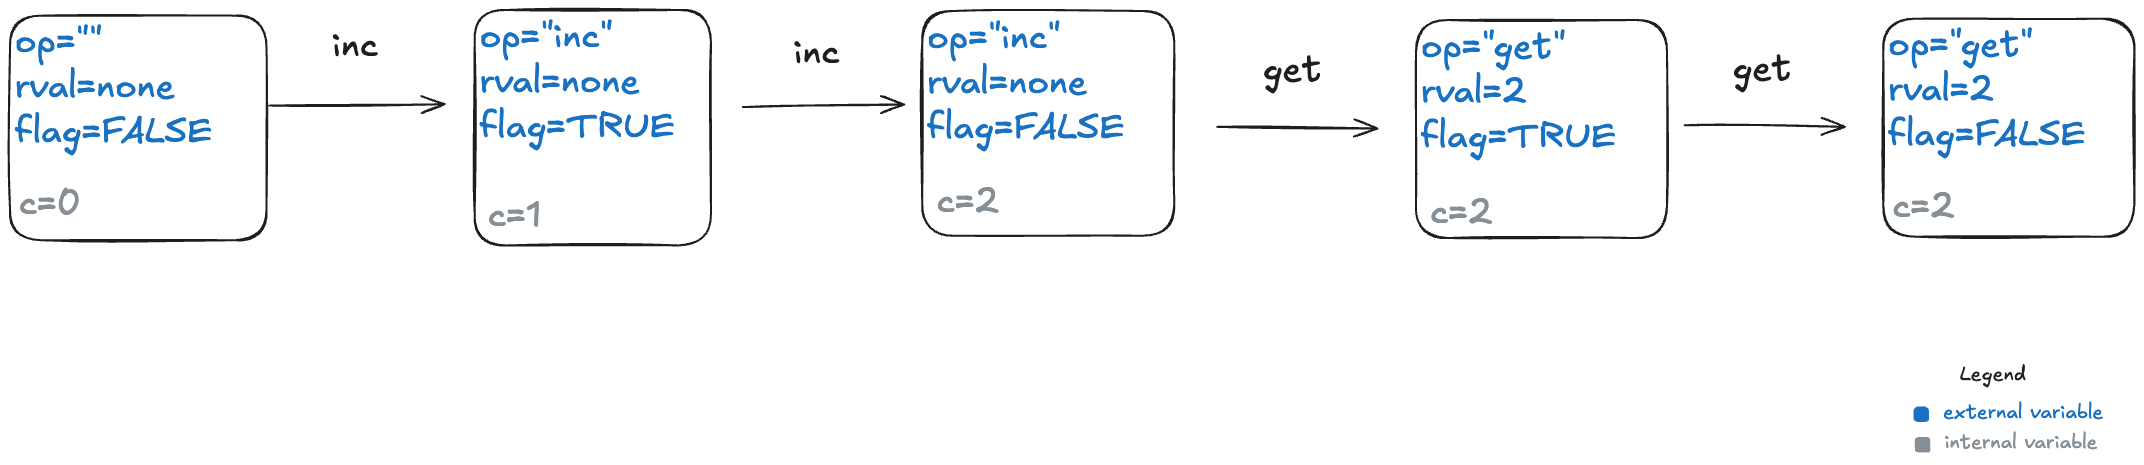
To model this counter in TLA+, we need to model the different operation types (inc, get, reset). We also need to model the return value for the get operation. I’ll model the operation with a state variable named op, and the return value with a state variable named rval.
But there’s one more thing we need to add to our model. In a state-machine model, we model an operation using one or more state transitions (steps) where at least one variable in the state changes. This is because all TLA+ models must allow what are called stuttering steps, where you have a state transition where none of the variables change.
This means we need to distinguish between two consecutive inc operations versus an inc operation followed by a stuttering step where nothing happens.
To do that, I’ll add a third variable to my model, which I’ll unimaginatively call flag. It’s a boolean variable, which I will toggle every time an operation happens. To sum up, my three state variables are:
op – the operation (“inc”, “get”, “reset”), which I’ll initialize to “” (empty string) in the first state
rval – the return value for a get operation. It will be a special value called none for all of the other operations
flag – a boolean that toggles on every (non-stuttering) state transition.
Below is a depiction of an execution history and how this would be modeled as a behavior at TLA+. The text in red indicated which variable changed in the transition. As mentioned above, every transition associated with an operation must have at least one variable that changes value.
Here’s a visual depiction of an execution history. Note how each event in the history is modeled as a step (pair of states) where at least one variable changes.
To illustrate why we need the extra variables, consider the following three behaviors.
In behavior 1, there are no stuttering steps. In behavior 2, the last step is a stuttering step, so there is only one “get” invocation. In behavior 3, there are two stuttering steps.
The internal variables
Our model of a counter so far has defined the external variables, which are the only variables that we really care about as the consumer of a specification. If you gave me a set of all of the valid behaviors for a queue, where behaviors were described using only these external behaviors, that’s all I need to understand how a queue behaves.
However, the external variables aren’t sufficient for the producer of a specification to actually generate the set of valid behaviors. This is because we need to keep track of some additional state information: how many increments there have been since the last reset. This type of variable is known as an internal state variable. I’m going to call this particular internal state variable c.
Here’s behavior 1, with different color codings for the external and internal variables.
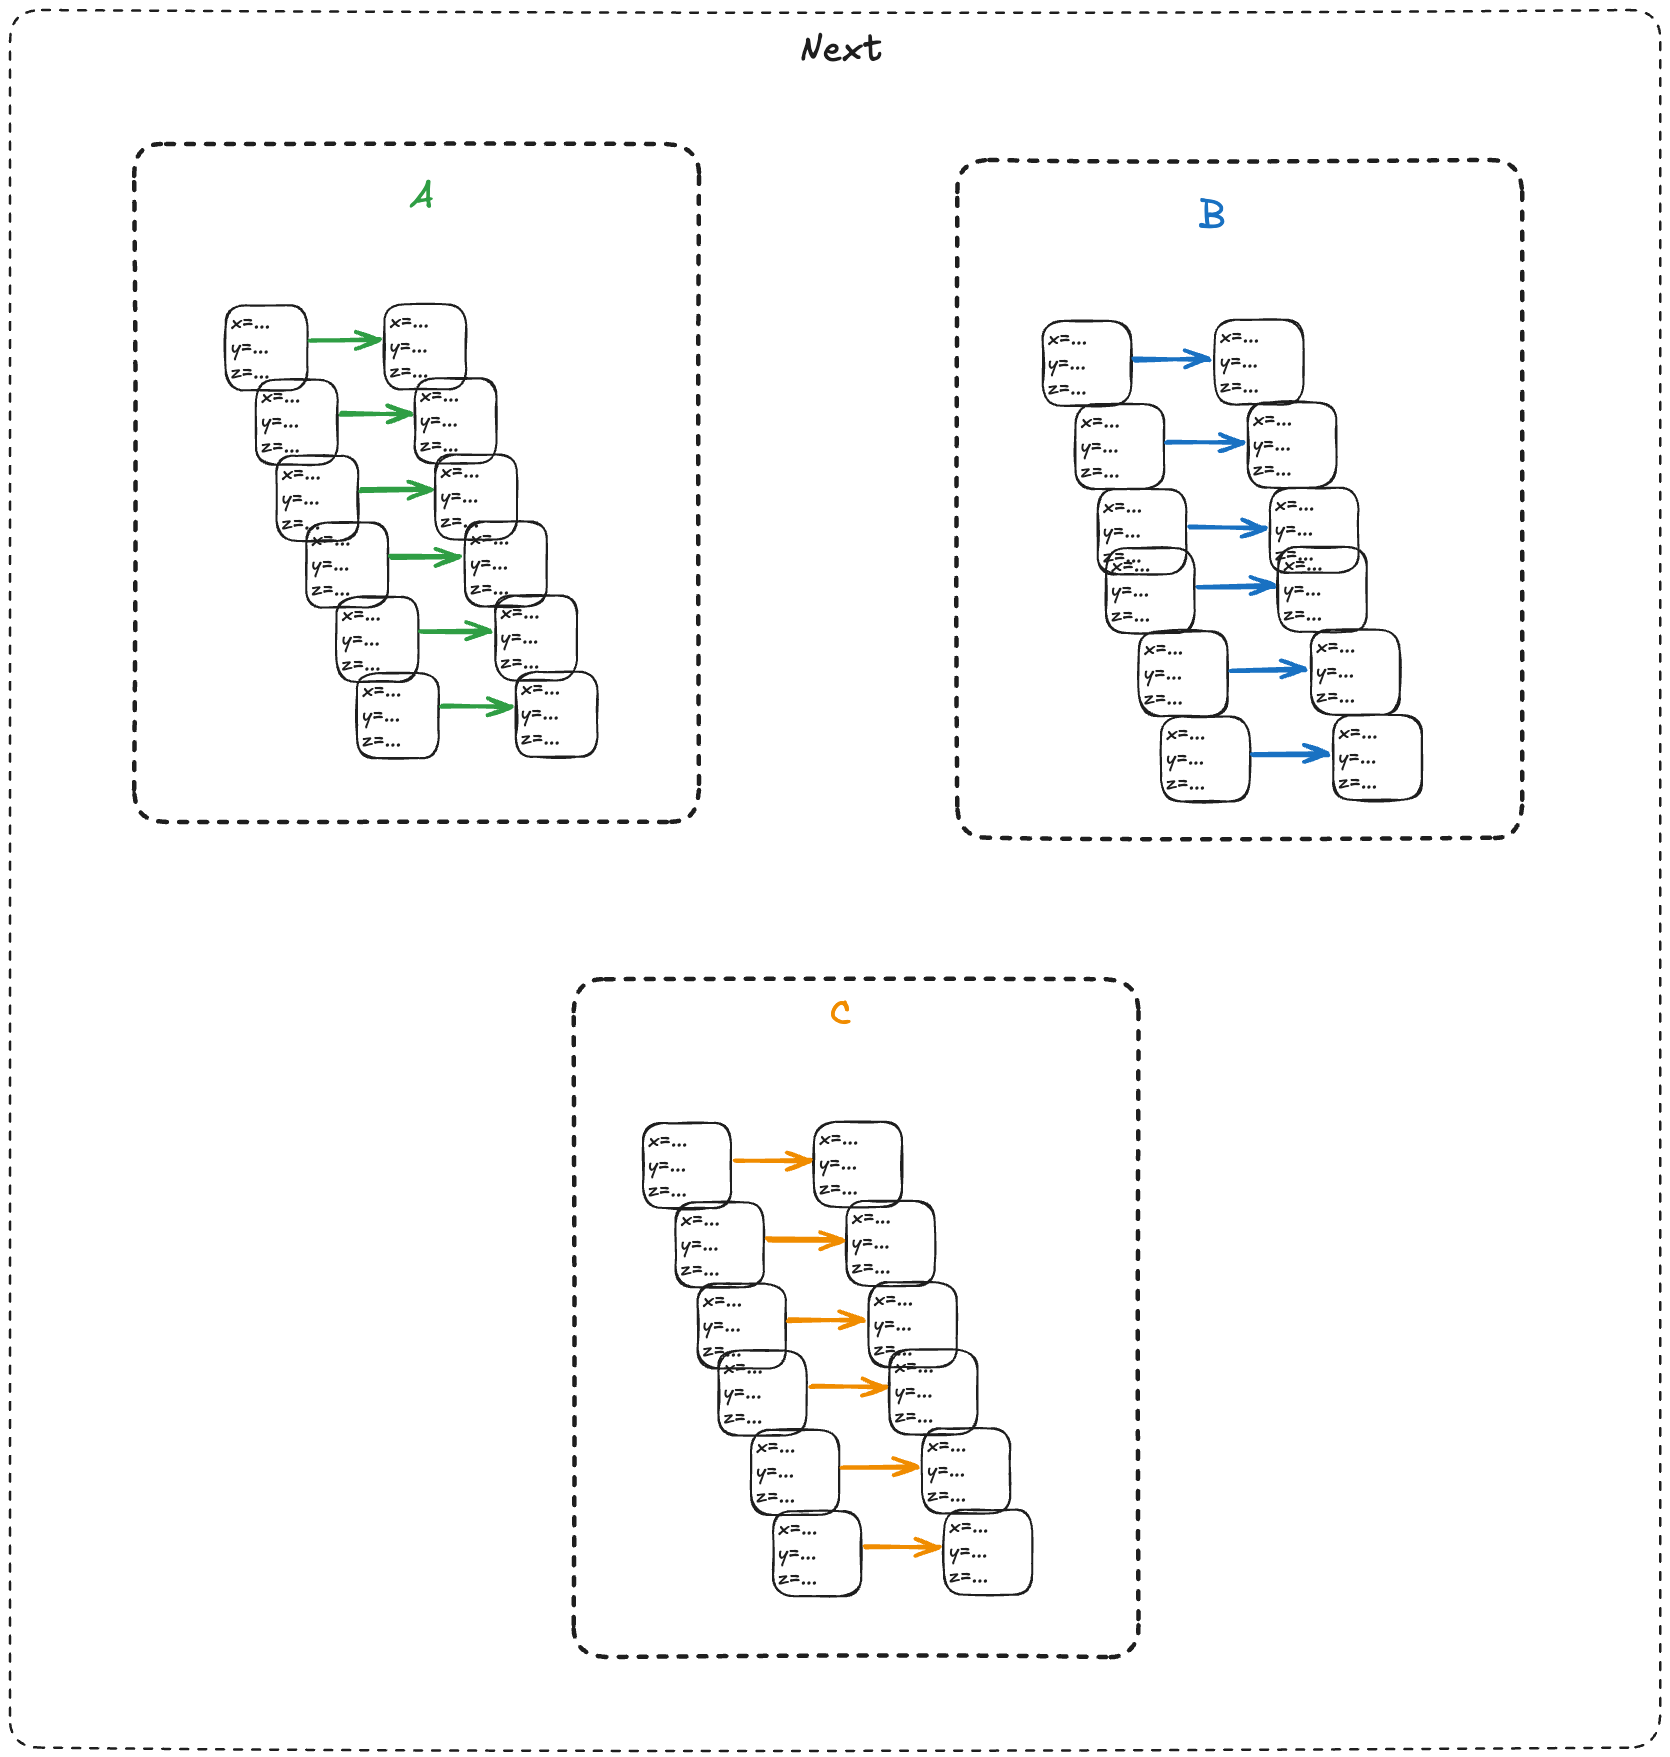
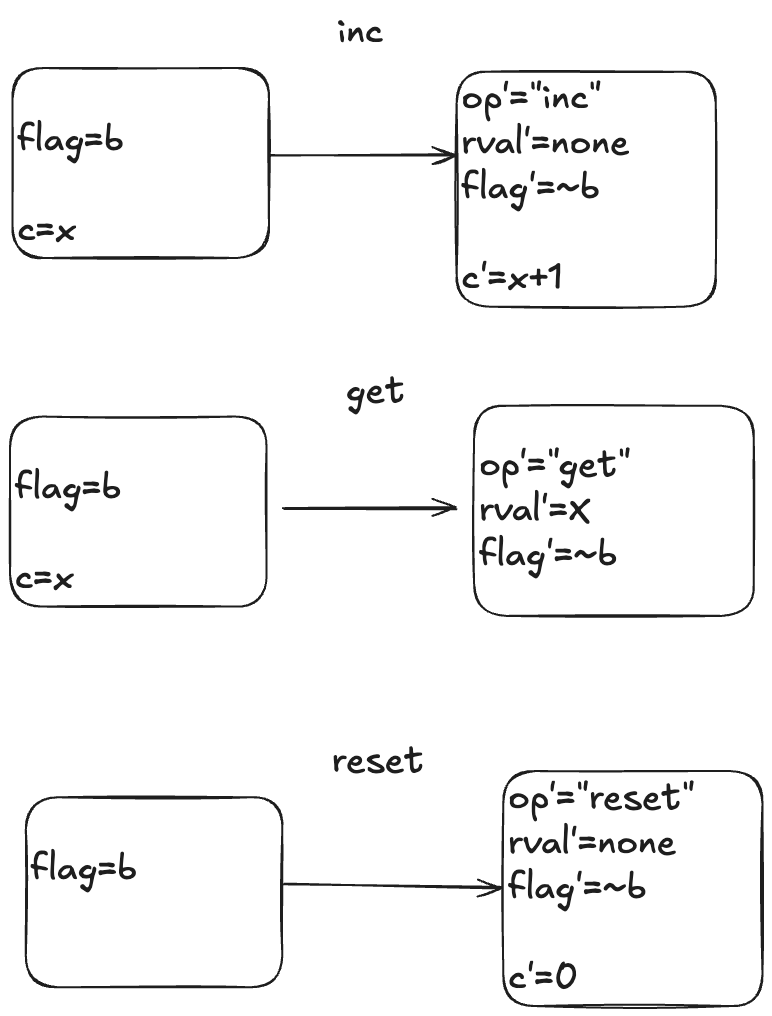
The actions
Here is a visual depiction of the permitted state transitions. Recall the set of permitted state transitions is called an action. For our counter, there are three actions, which corresponds to the three different operations we model: inc, get, and reset.
Each transition is depicted as two boxes with variables in it. The left-hand box shows the values of the variables before the state transition, and the right-hand box shows the values of the variables after the state transition. By convention we add a prime (‘) to the variables to refer to their values after the state transition.
While the diagram depicts three actions, each action describes a set of allowed state transitions. As an example, here are two different state transitions that are both members of the inc set of permitted transitions.
[flag=TRUE, c=5] → [flag=FALSE, c=6]
[flag=TRUE, c=8]→ [flag=FALSE, c=9]
In TLA+ terminology, we call these two steps inc steps. Remember: in TLA+, all of the action is in the actions. We use actions (sets of permitted state transitions) to model the events that we care about.
Modeling a queue with TLA+
We’ll move on to our second example, which will form the basis for the rest of this post: a queue. A queue supports two operations, which I’ll call enq (for enqueue) and deq (for dequeue).
Modeling execution histories as behaviors
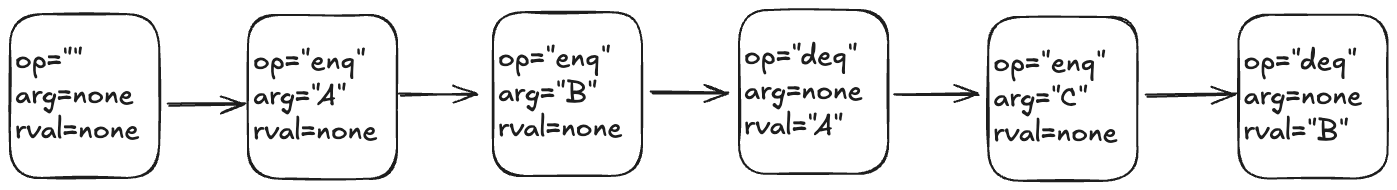
Recall our example of a valid execution history for a queue:
enq("A")
enq("B")
deq() → "A"
enq("C")
deq() → "B"
We now have to model argument passing, since the enq operation takes an argument.
Here’s one way to model this execution history as a TLA+ behavior.
My model uses three state variables:
op – identifies which operation is being invoked (enq or deq)
arg – the argument being passed in the case of the enq operation
rval – the return value in the case of the deq operatoin
TLA+ requires that we specify a value for every variable in every state, which means we need to specify a value for arg even for the deq operation, which doesn’t have an argument, and a value for rval for the enq operation, which doesn’t return a value. I defined a special value called none for this case.
In the first state, when the queue is empty, I chose to set op to the empty string (“”) and arg and rval to none.
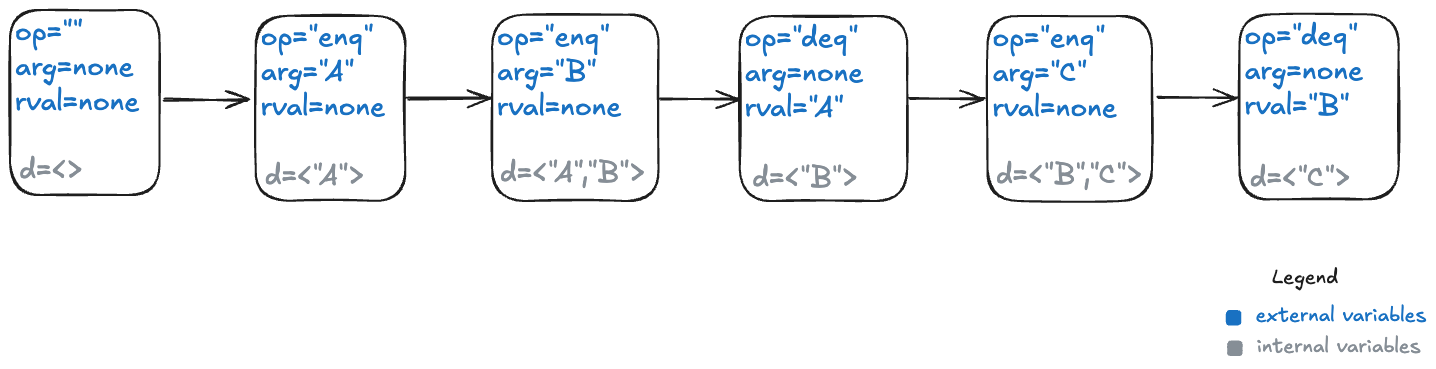
The internal variables
For a queue, we need to keep track all of the values that have previously been enqueued, as well as the order in which they were enqueued.
TLA+ has a type called a sequence which I’ll use to encode this information: a sequence is like a list in Python.
I’ll add a new variable which I’ll unimaginatively call d, for data. Here’s what that behavior looks like with the internal variable.
Modeling dequeues
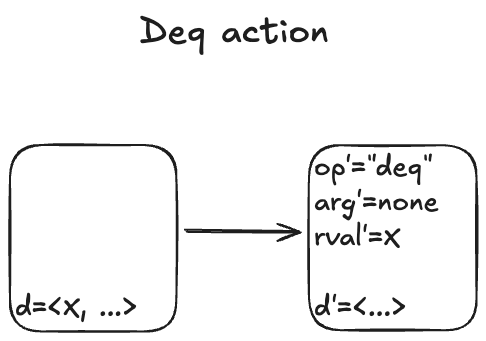
Recall that our queue supports two operations: enqueue and dequeue. We’ll start with the dequeue operation. I modeled it with an action called Deq.
Here are some examples of state transitions that are permitted by the Deq action. We call these Deq steps.
I’m not going to write much TLA+ code in this post, but to give you a feel for it, here is how you would write the Deq action in TLA+ syntax:
The syntax of the first line might be a bit confusing if you’re not familiar with TLA+:
# is TLA+ for ≠
<<>> is TLA+ for the empty sequence.
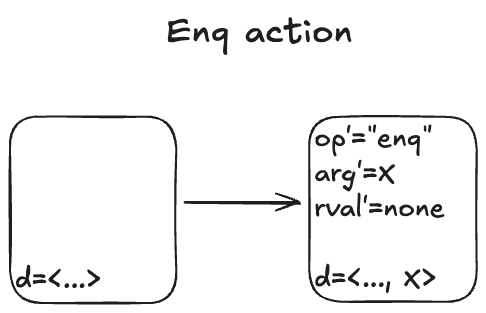
Modeling dequeues
Here’s what the Enq action looks like:
There’s non-determinism in this action: the value of arg’ can be any valid value that we are allowed to put onto the queue.
I’ll spend just a little time in this section to give you a sense of how you would use TLA+ to represent the simple queue model.
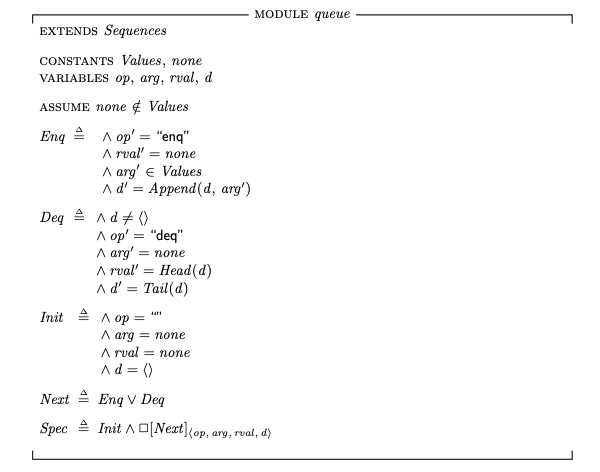
To describe the queue in TLA+, we define a set called Values that contains all of the valid values that could be enqueued, as well as a special constant named none that means “not a value”.
The complete description of our queue, its specification that describes all permitted behaviors, looks like this:
For completeness, here’s what the TLA+ specification looks like: (source in Queue.tla).
Init corresponds to our set of initial states, and Next corresponds to the next-state action, where the two sub-actions are Enq and Deq.
The last line, Spec, is the full specification. You can read this as: The initial state is chosen from the Init set of states, and every step is a Next step (every allowed state transition is a member of the set of state transitions defined by the Next action).
Modeling concurrency
In our queue model above, an enqueue or dequeue operation happens in one step (state transition). That’s fine for modeling sequential programs, but it’s not sufficient for modeling concurrent programs. In concurrent programs, the operations from two different threads can overlap in time.
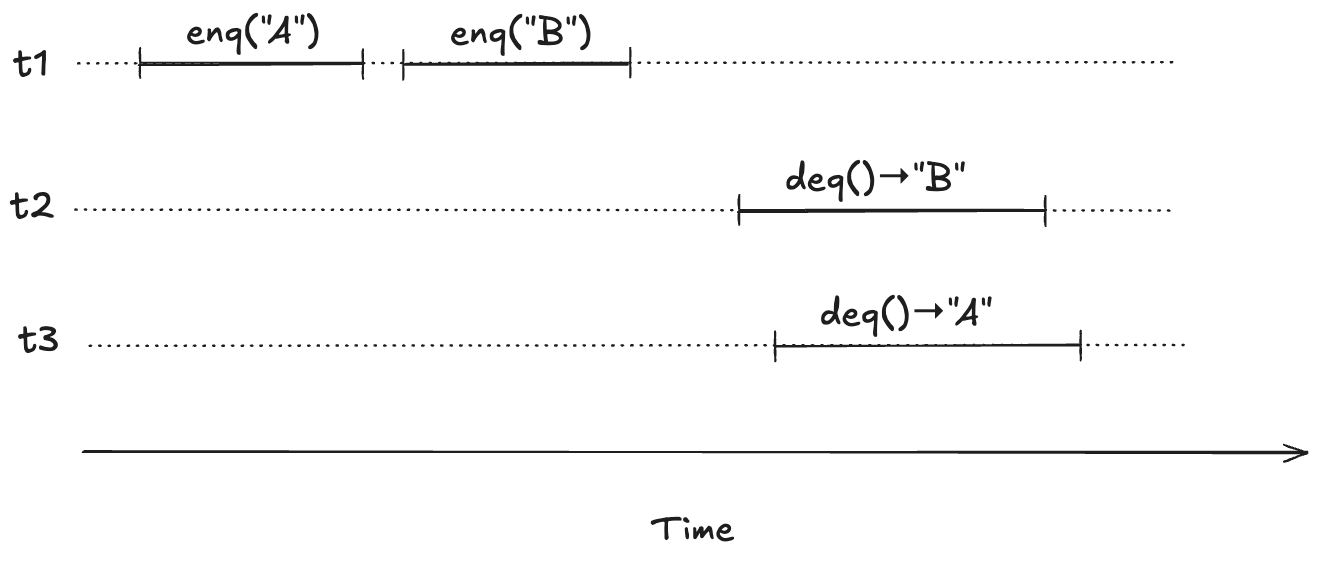
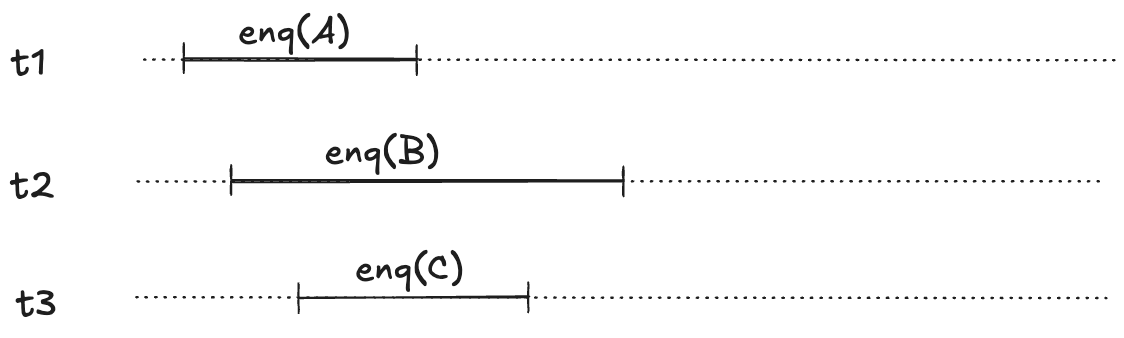
To illustrate, imagine a scenario where there are three threads, t1, t2, t3. First, t1 enqueues “A”, and “B”. Then, t2 and t3 both call dequeue, and those queries overlap in time.
We want to model concurrent executions using a state-machine model. The diagram above, shows the start and end time for each operation. But to model this behavior, we don’t actually care about the exact start and end times: rather, we only care about the relative order of the start and events.
We can model execution histories like the one above using state machines. We were previously modeling an operation in a single state transition (step). Now we will need to use two steps to model an operation: one to indicate when the operation starts and the other to indicate when the operate ends.
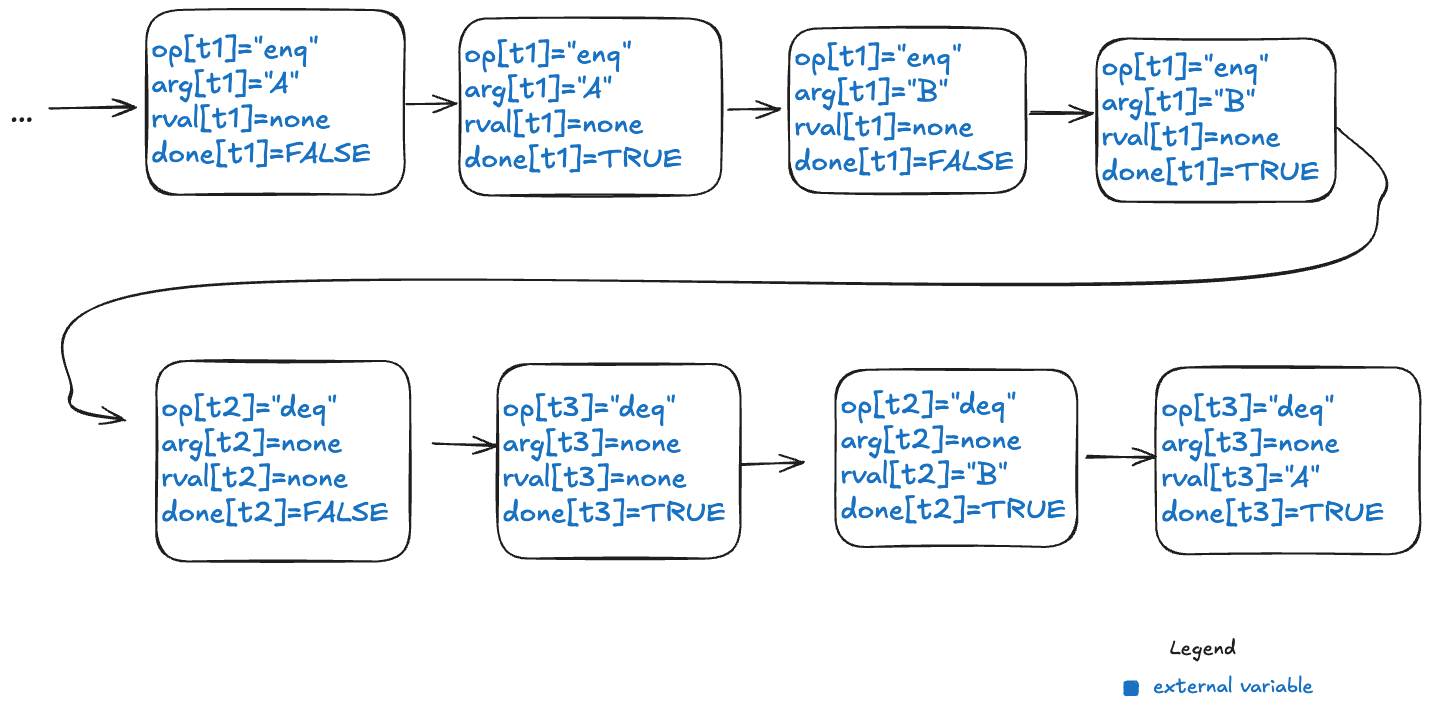
Because each thread acts independently, we need to model variables that are local to threads. And, in fact, all externally visible variables are scoped to threads, because each operation always happens in the context of a particular thread. We do this by changing the variables to be functions where the domain is a thread id. For example, where we previously had op=”enq” where op was always a string, now op is a function that takes a thread id as an argument. Now we would have op[t1]=”enq” where t1 is a thread id. (Functions in TLA+ use square brackets instead of round ones. you can think of these function variables as acting like dictionaries)
Here’s an example of a behavior that models the above execution history, showing only the external variables. Note that this behavior only shows the values that change in a state.
Note the following changes from the previous behaviors.
There is a boolean flag, done, which indicates when the operation is complete.
The variables are all scoped to a specific thread.
But what about the internal variable d?
Linearizability as correctness condition for concurrency
We know what it means for a sequential queue to be correct. But what do we want to consider correct when operations can overlap? We need to decide what it means for an execution history of a queue to be correct in the face of overlapping operations. This is where linearizability comes in. From the abstract of the Herlihy and Wing paper:
Linearizability provides the illusion that each operation applied by concurrent processes takes effect instantaneously at some point between its invocation and its response, implying that the meaning of a concurrent object’s operations can be given by pre- and post-conditions.
For our queue example, we say our queue is linearizable if, for every history where there are overlapping operations, we can identify a point in time between the start and end of the operation where the operation instantaneously “takes effect”, giving us a sequential execution history that is a correct execution history for a serial queue. This is a called a linearization. If every execution history for our queue has a linearization, then we say that our queue is linearizable.
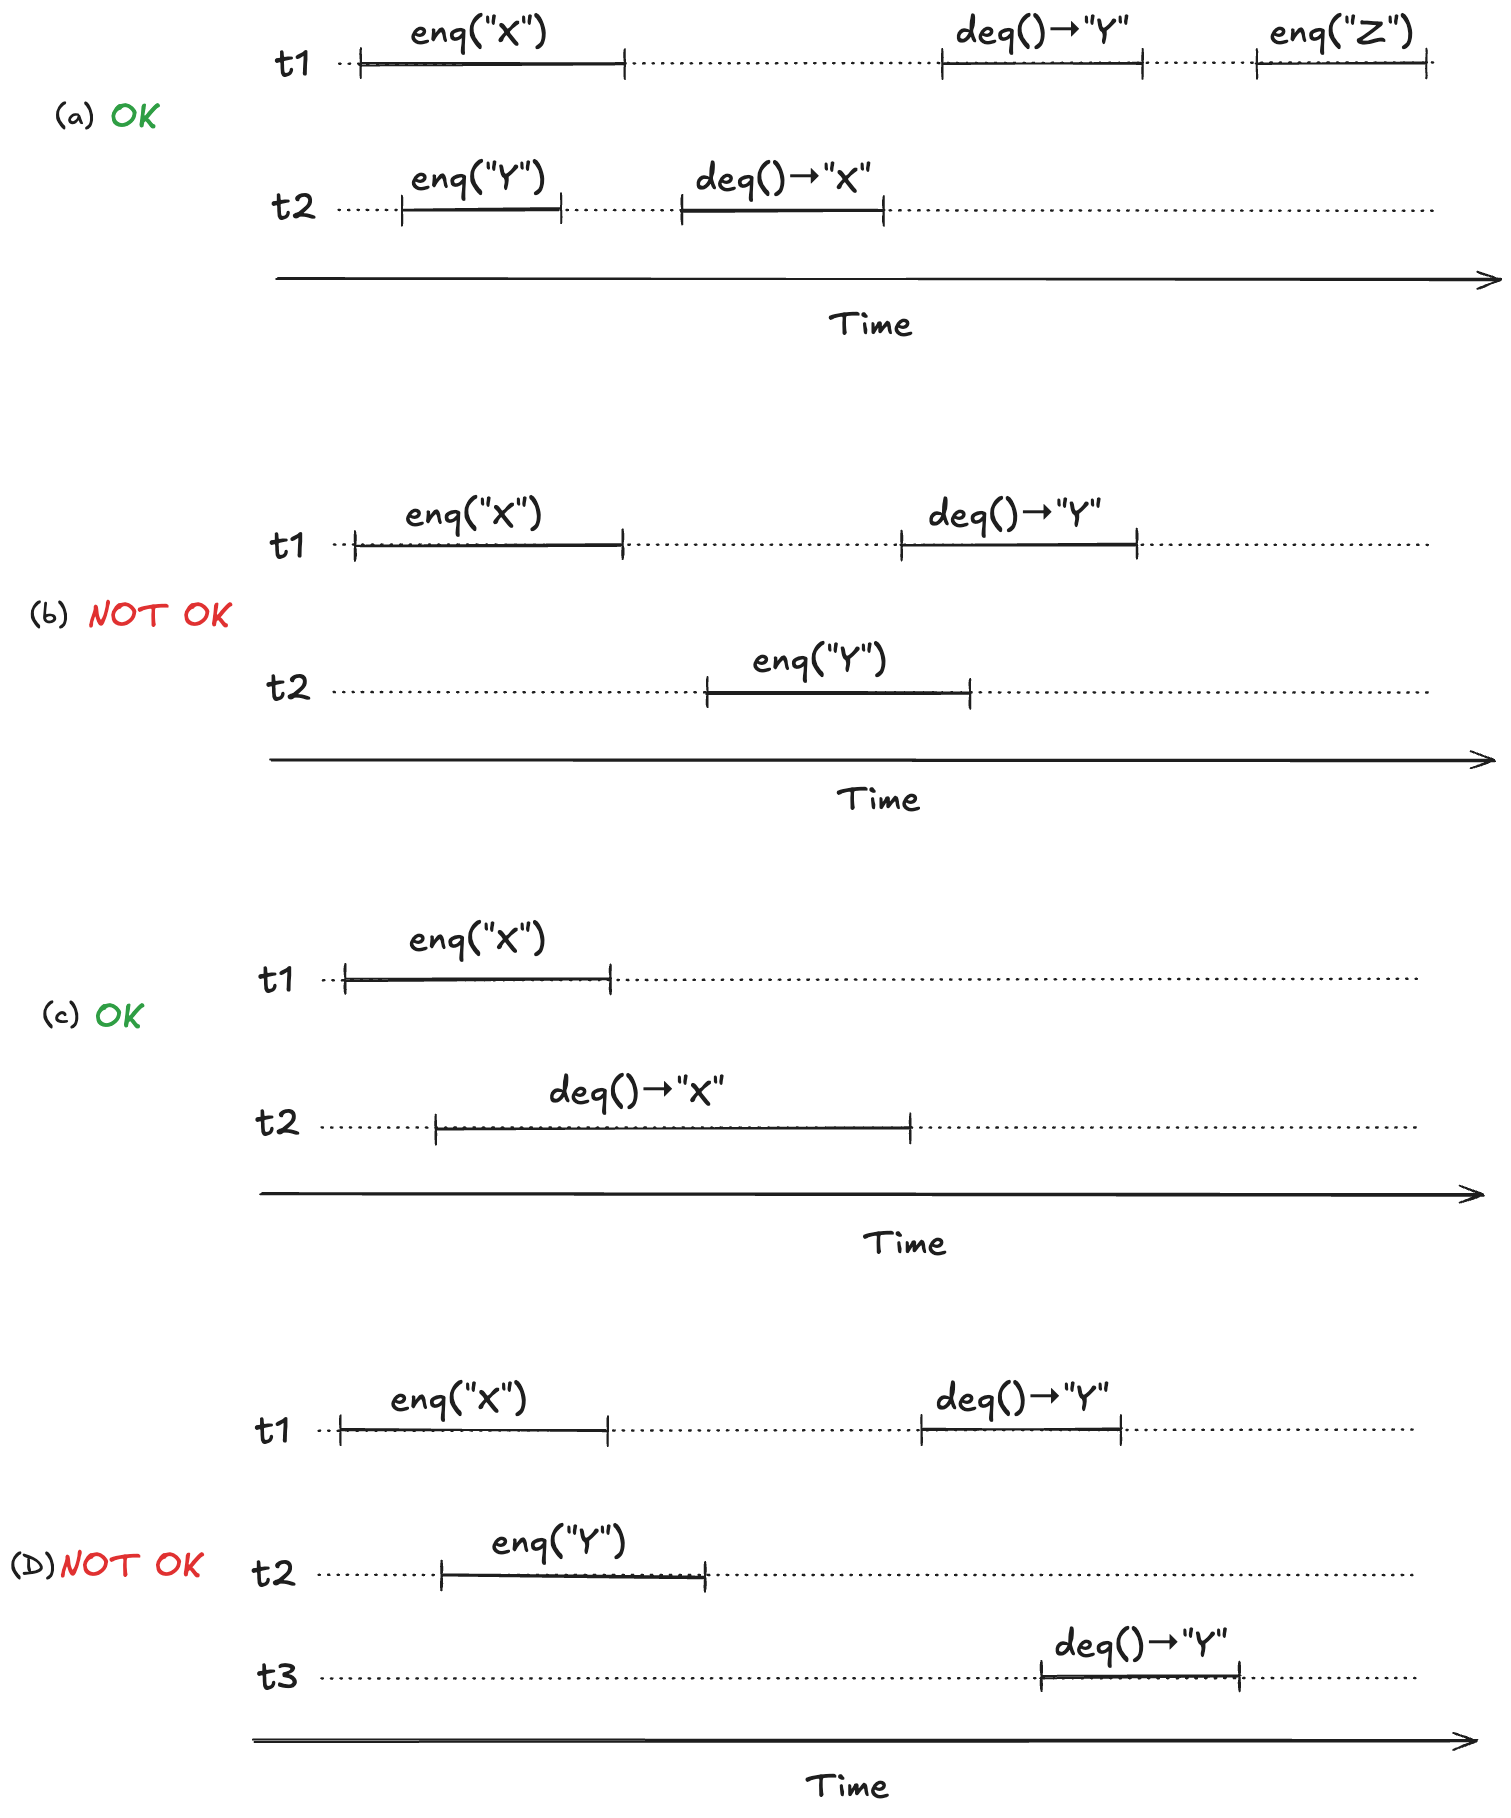
To make this concrete, consider the following four observed execution histories of a queue, labeled (a), (b), (c), (d), adapted from Fig. 1 of the Herlihy and Wing linearizable paper. Two of these histories are linearizable (they are labeled “OK”), and two are not (labeled “NOT OK”).
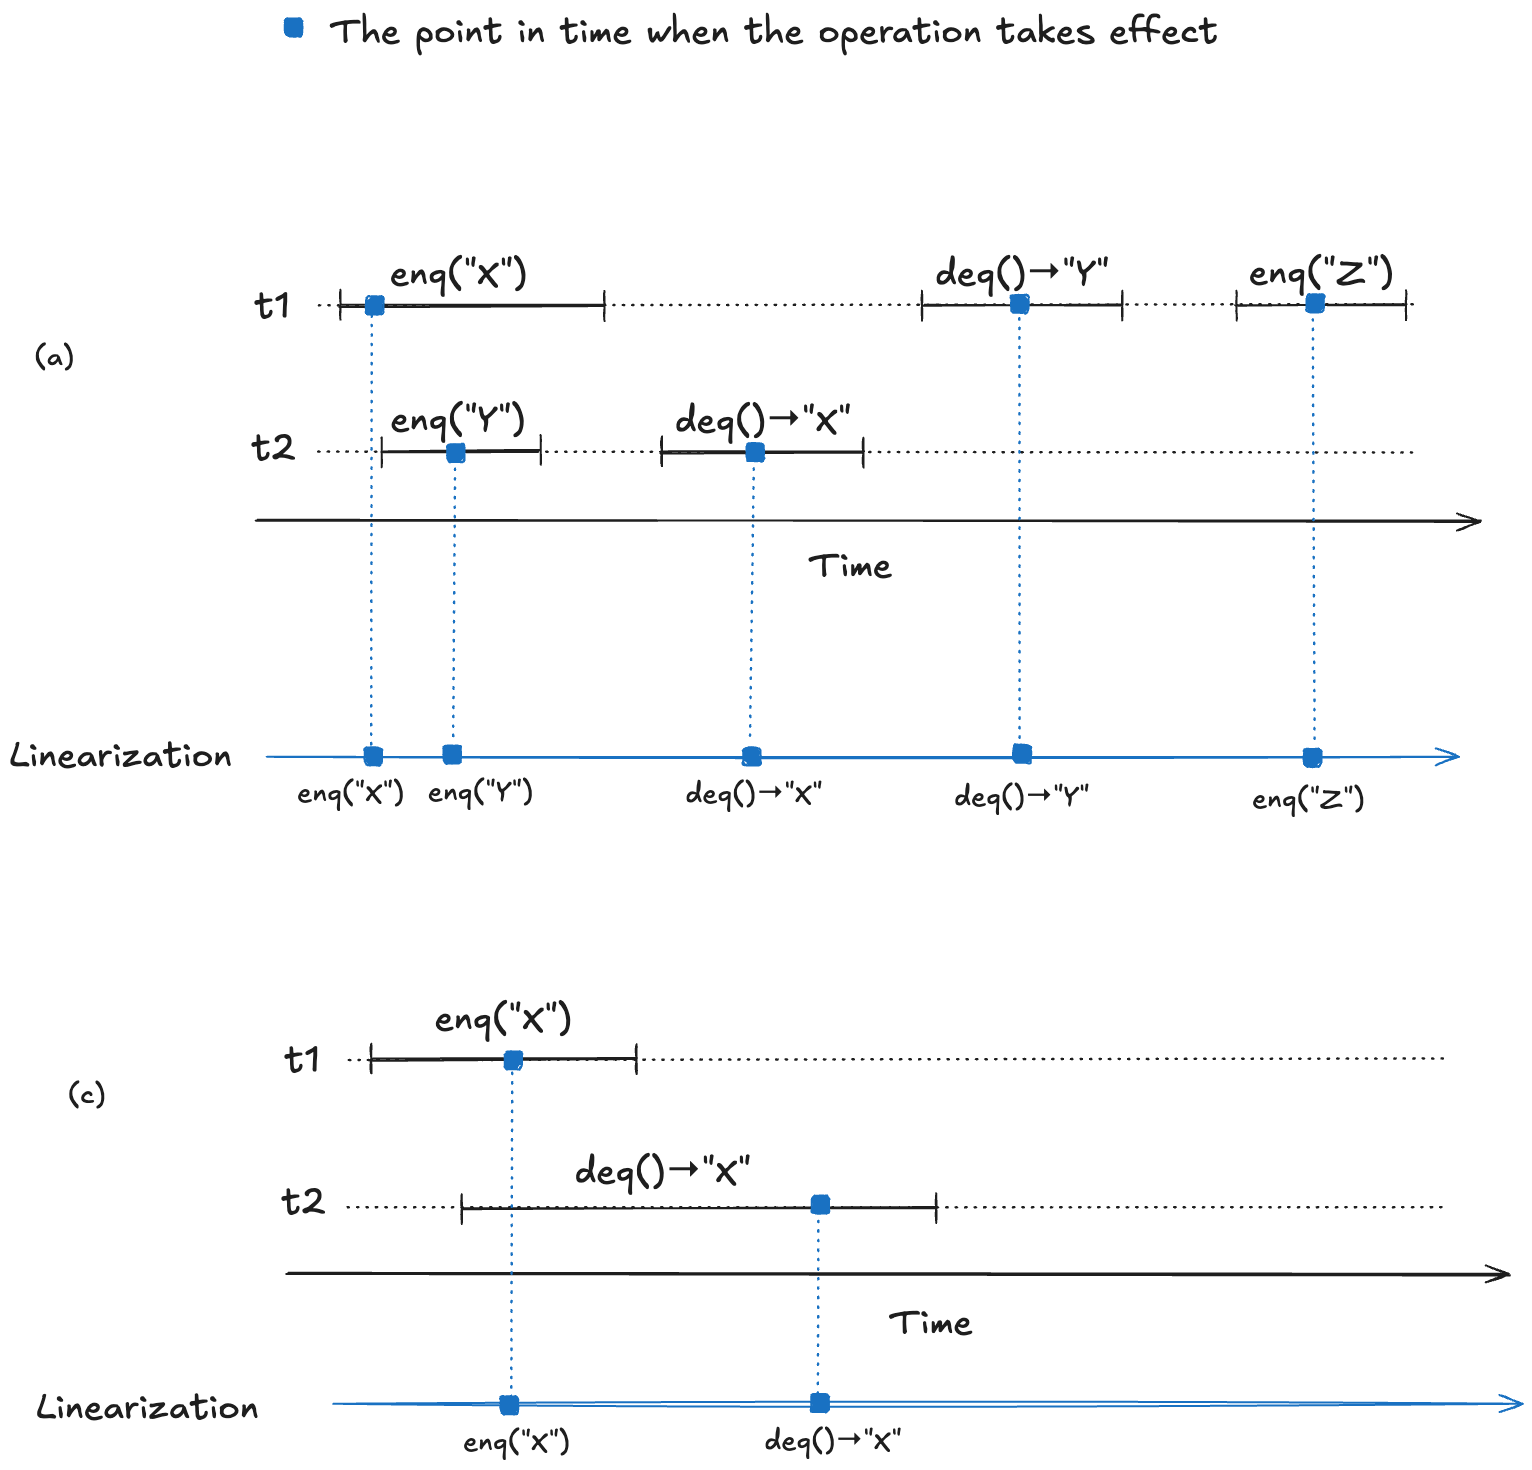
For (a) and (c), we can identify points in time during the operation where it appears as if the operation has instantaneously taken effect.
We now have a strict ordering of operations because there is no overlap, so we can write it as a sequential execution history. When the resulting sequential execution history is valid, it is called a linearization:
To repeat from the last section, a data structure is linearizable if, for every operation that executes on the data structure, we can identify a point in time between the start and the end of the operation where the operation takes effect.
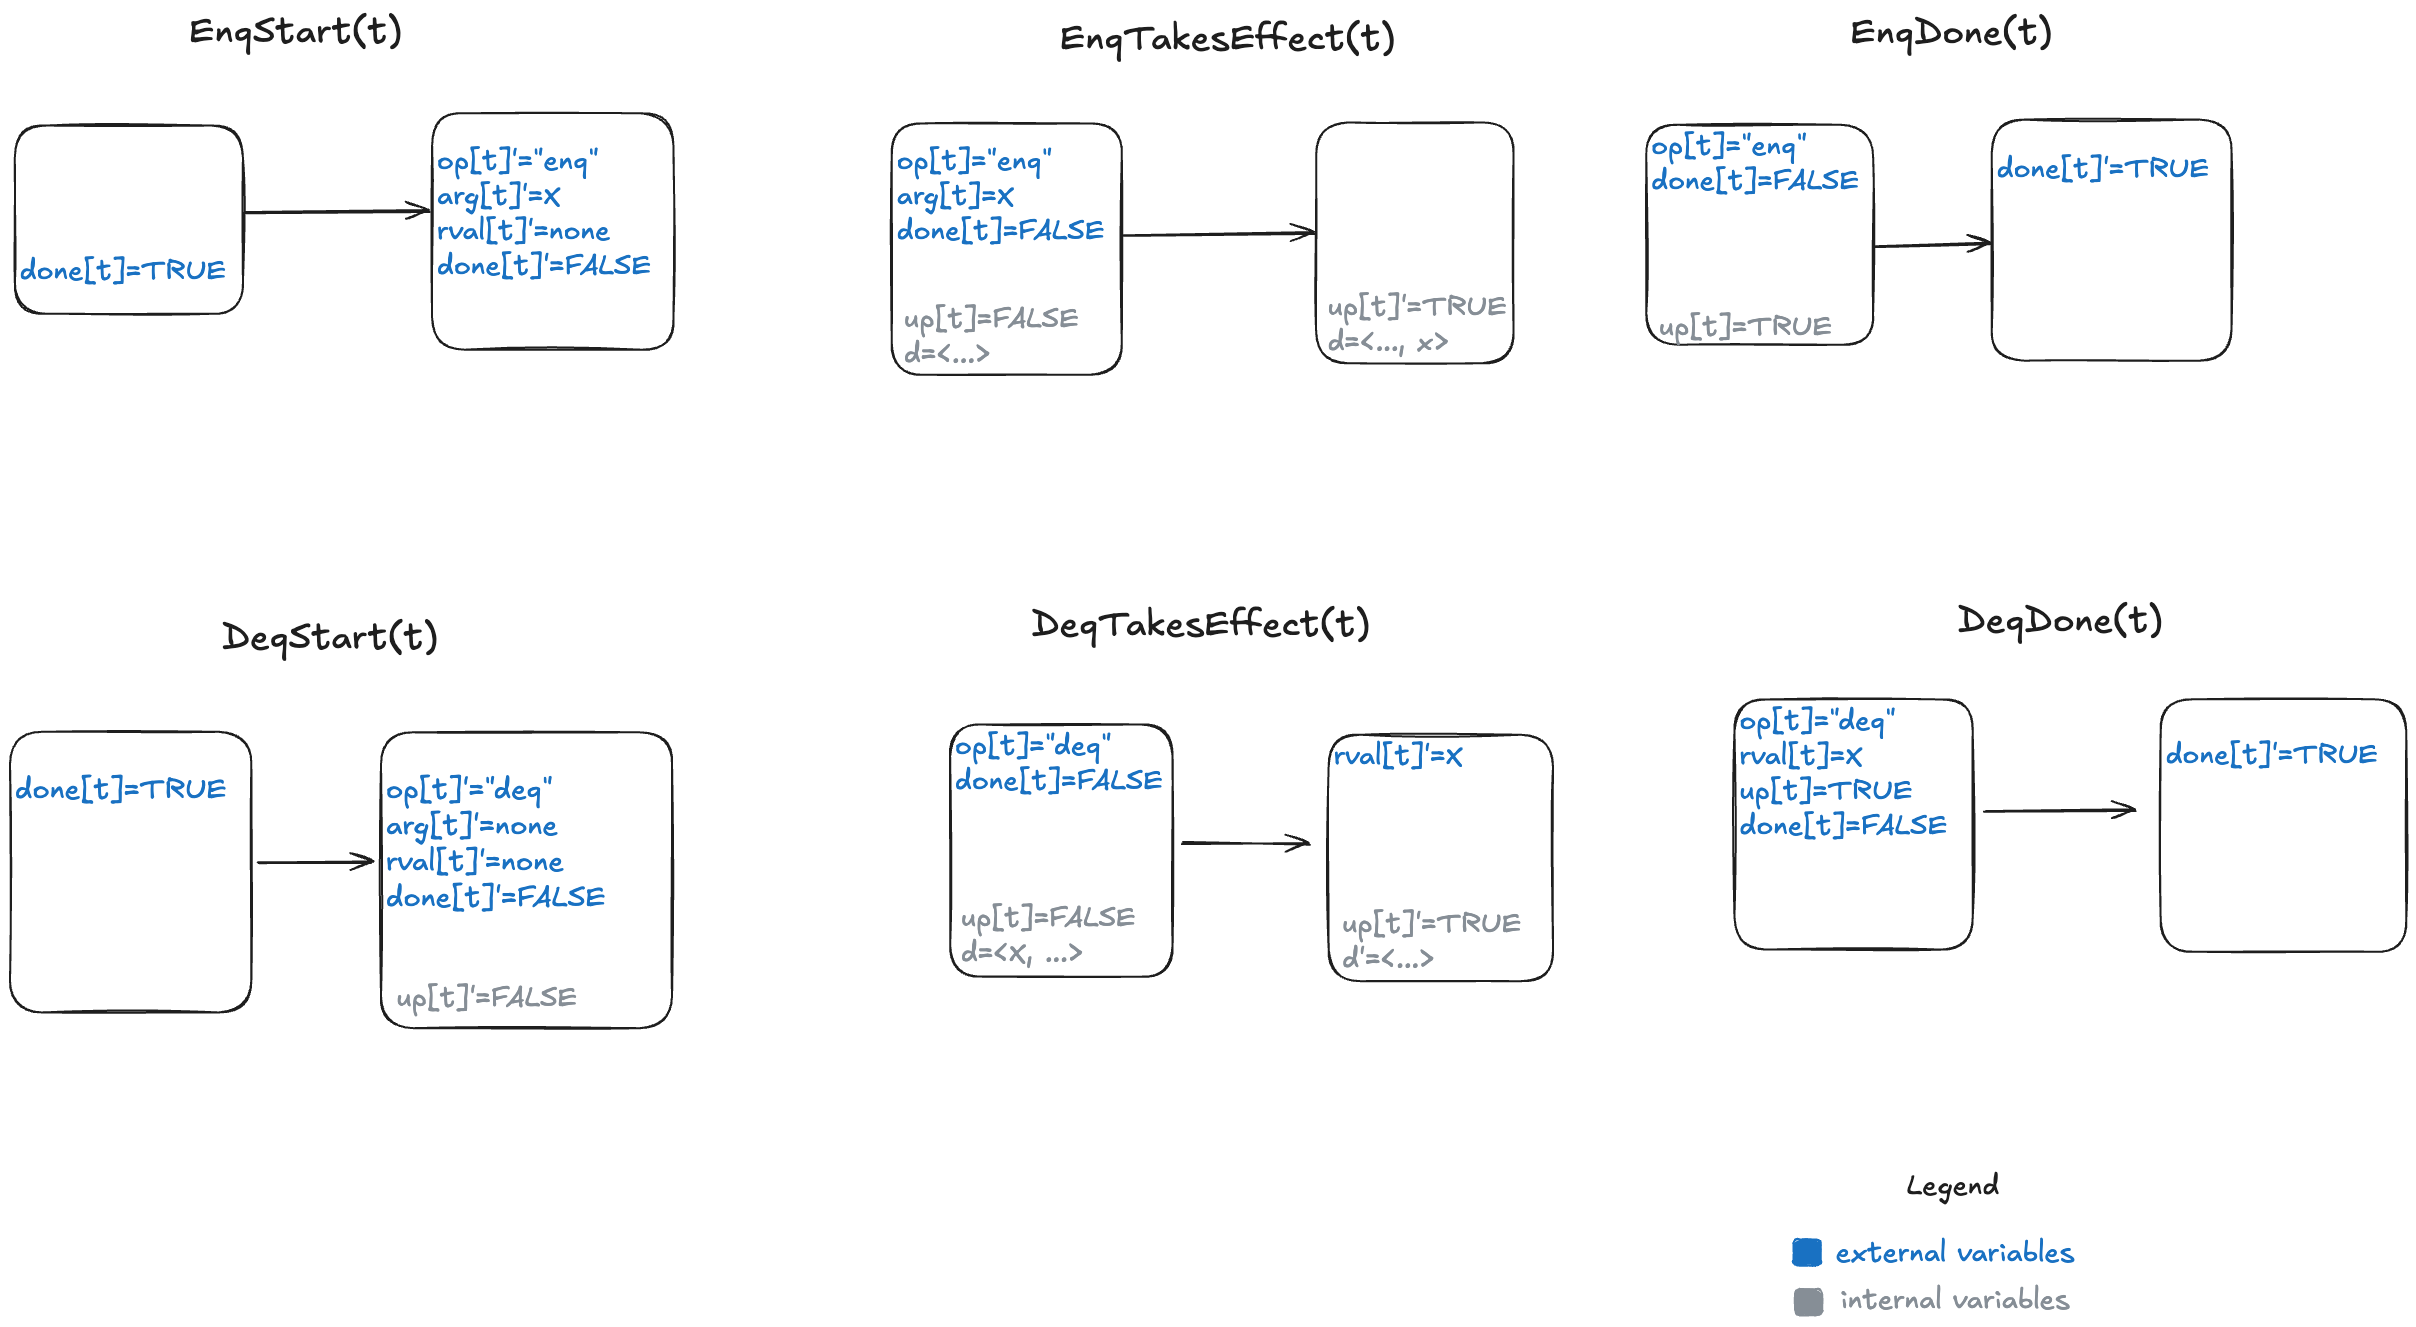
We can model a linearizable queue by modeling each operation (enqueue/dequeue) as three actions:
Start (invocation) of operation
When the operation takes effect
End (return) of operation
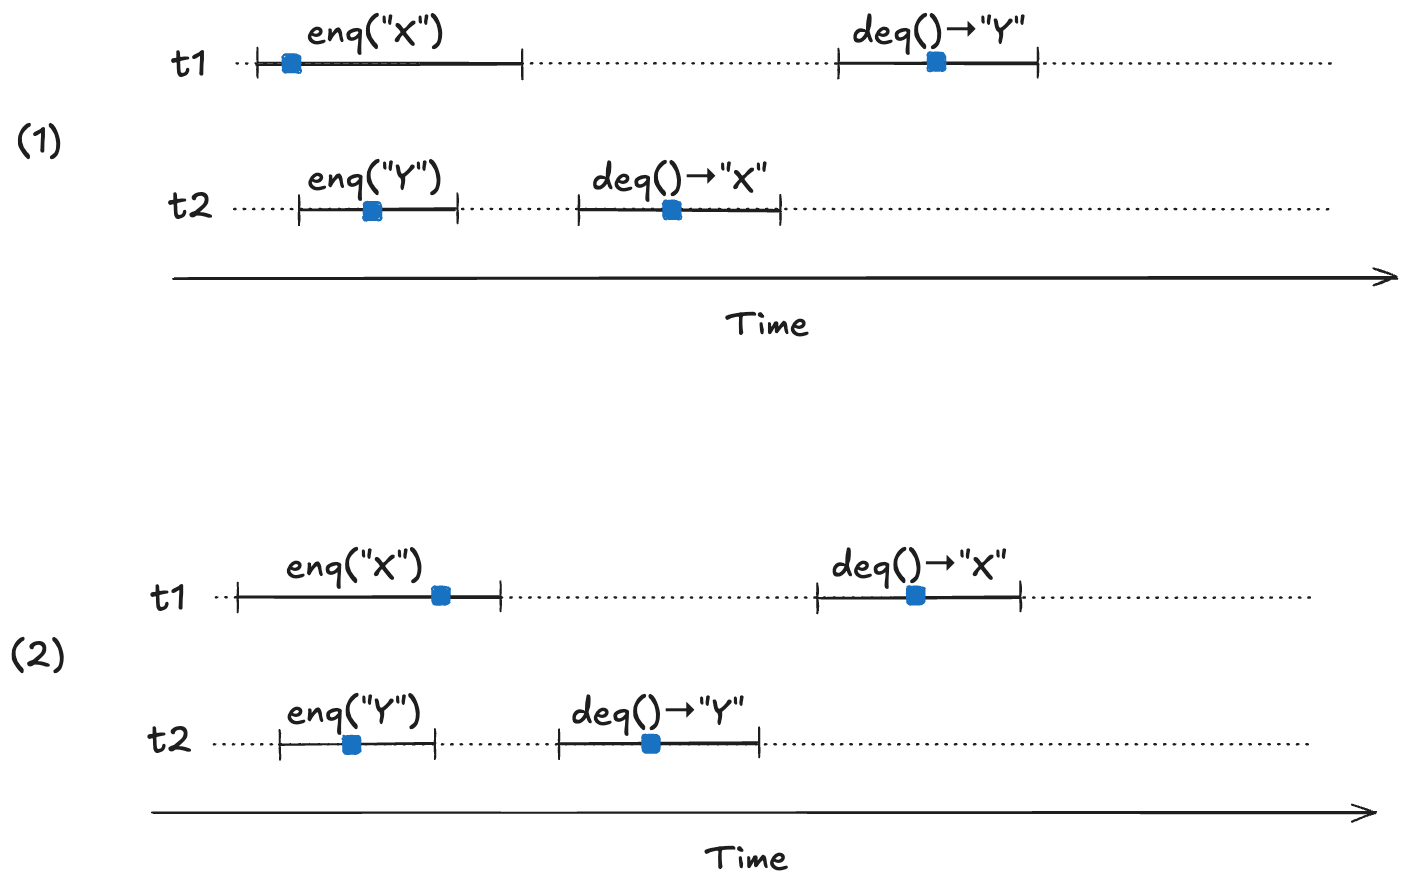
Our model needs to permit all possible linearizations. For example, consider the following two linearizable histories. Note how the start/end timings of the operations are identical in both cases, but the return values are different.
In (1) the first deq operation returns “X”, and in (2) the first deq operation “returns Y”. Yet they are both valid histories. The difference between the two is the order in which the enq operations take effect. In (1), enq(“X”) takes effect before enq(“Y”), and in (2), enq(“Y”) takes effect before enq(“X”). Here are the two linearizations:
Our TLA+ model of a linearizable queue will need to be able to model the relative order of when these operations take effect. This is where the internal variables come into play in our model: “taking effect” will mean updating internal variables of our model.
We need an additional variable to indicate whether the internal state has been updated or not for the current operation. I will call this variable up (for “updated”). It starts off as false when the operation starts, and is set to true when the internal state variable (d) has been updated.
Here’s a visual representation of the permitted state transitions (actions). As before, the left bubble shows the values that must be true in the first state for the transition to happen, and the second bubble shows which variables change.
Since we now have to deal with multiple threads, we parameterize our action by thread id (t). You can see the TLA+ model here: LinearizableQueue.tla.
We now have a specification for a linearizable queue, which is a description of all valid behaviors. We can use this to verify that a specific queue implementation is linearizable. To demonstrate, let’s shift gears and talk about an example of an implementation.
An example queue implementation
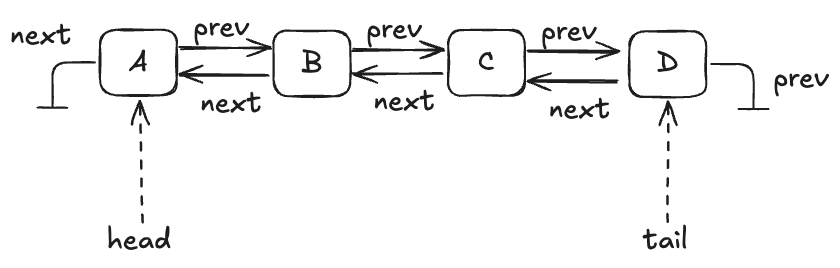
Let’s consider an implementation of a queue that:
Stores the data in a doubly-linked list
Uses a lock to protect the list
A queue with four entries looks like this:
Here’s an implementation of this queue in Python that I whipped up. I call it an “LLLQueue” for “locked-linked-list queue”. I believe that my LLLQueue is linearizable, and I’d like to verify this.
One way is to use TLA+ to build a specification of my LLLQueue, and then prove that every behavior of my LLLQueue is also a behavior of the LinearizableQueue specification. The way we do this is in TLA+ is by a technique called refinement mappings.
But, first, let’s model the LLLQueue in TLA+.
Modeling the LLLQueue in TLA+ (PlusCal)
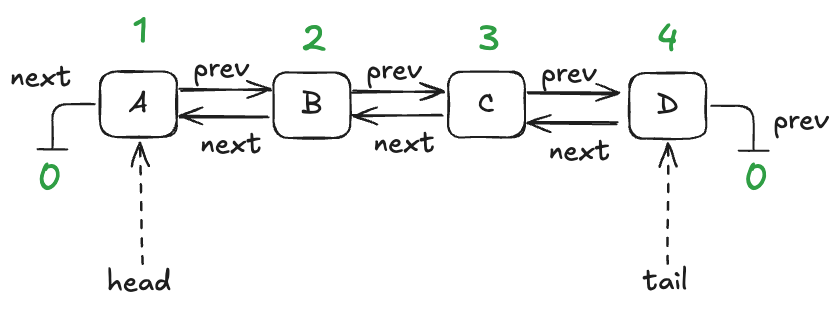
In a traditional program, a node would be associated with a pointer or reference. I’m going to use numerical IDs for each node, starting with 1. I’ll use the value of 0 as a sentinel value meaning null.
We’ll model this with three functions:
vals – maps node id to the value stored in the node
prev – maps node id to the previous node id in the list
next – maps node id to the next node id in the list
Here are these functions in table form for the queue shown above:
node id
vals
1
A
2
B
3
C
4
D
The vals function
node id
prev
1
2
2
3
3
4
4
0 (null)
The prev function
node id
next
1
0 (null)
2
1
3
2
4
3
The next function
It’s easier for me to use PlusCal to model an LLLQueue than to do it directly in TLA+. PlusCal is a language for specifying algorithms that can be automatically translated to a TLA+ specification.
It would take too much space to describe the full PlusCal model and how it translates, but I’ll try to give a flavor of it. As a reminder, here’s the implementation of the enqueue method in my Python implementation.
Here’s what my PlusCal model looks like for the enqueue operation:
procedure enqueue(val)
variable new_tail;
begin
E1: acquire(lock);
E2: with n \in AllPossibleNodes \ nodes do
        Node(n, val, tail);
        new_tail := n;
    end with;
E3: if IsEmpty then
        head := new_tail;
    else
        prev[tail] := new_tail;
    end if;
    tail := new_tail;
E4: release(lock);
E5: return;
end procedure;
Note the labels (E1, E2, E3, E4, E5) here. The translator turns those labels into TLA+ actions (state transitions permitted by the spec). In my model, an enqueue operation is implemented by five actions.
Refinement mappings
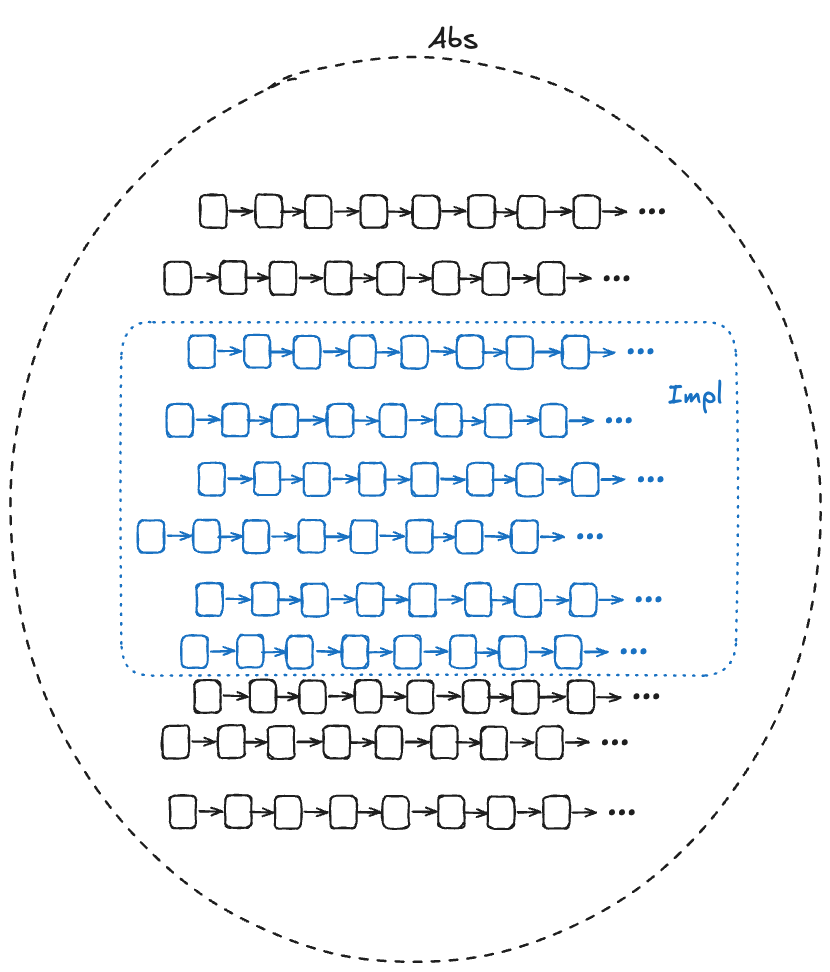
One of the use cases for formal methods is to verify that a (low-level) implementation conforms to a (higher-level) specification. In TLA+, all specs are sets of behaviors, so the way we do this is that we:
create a high-level specification that models the desired behavior of the system
create a lower-level specification that captures some implementation details of interest
show that every behavior of the low-level specification is among the set of behaviors of the higher-level specification, considering only the externally visible variables
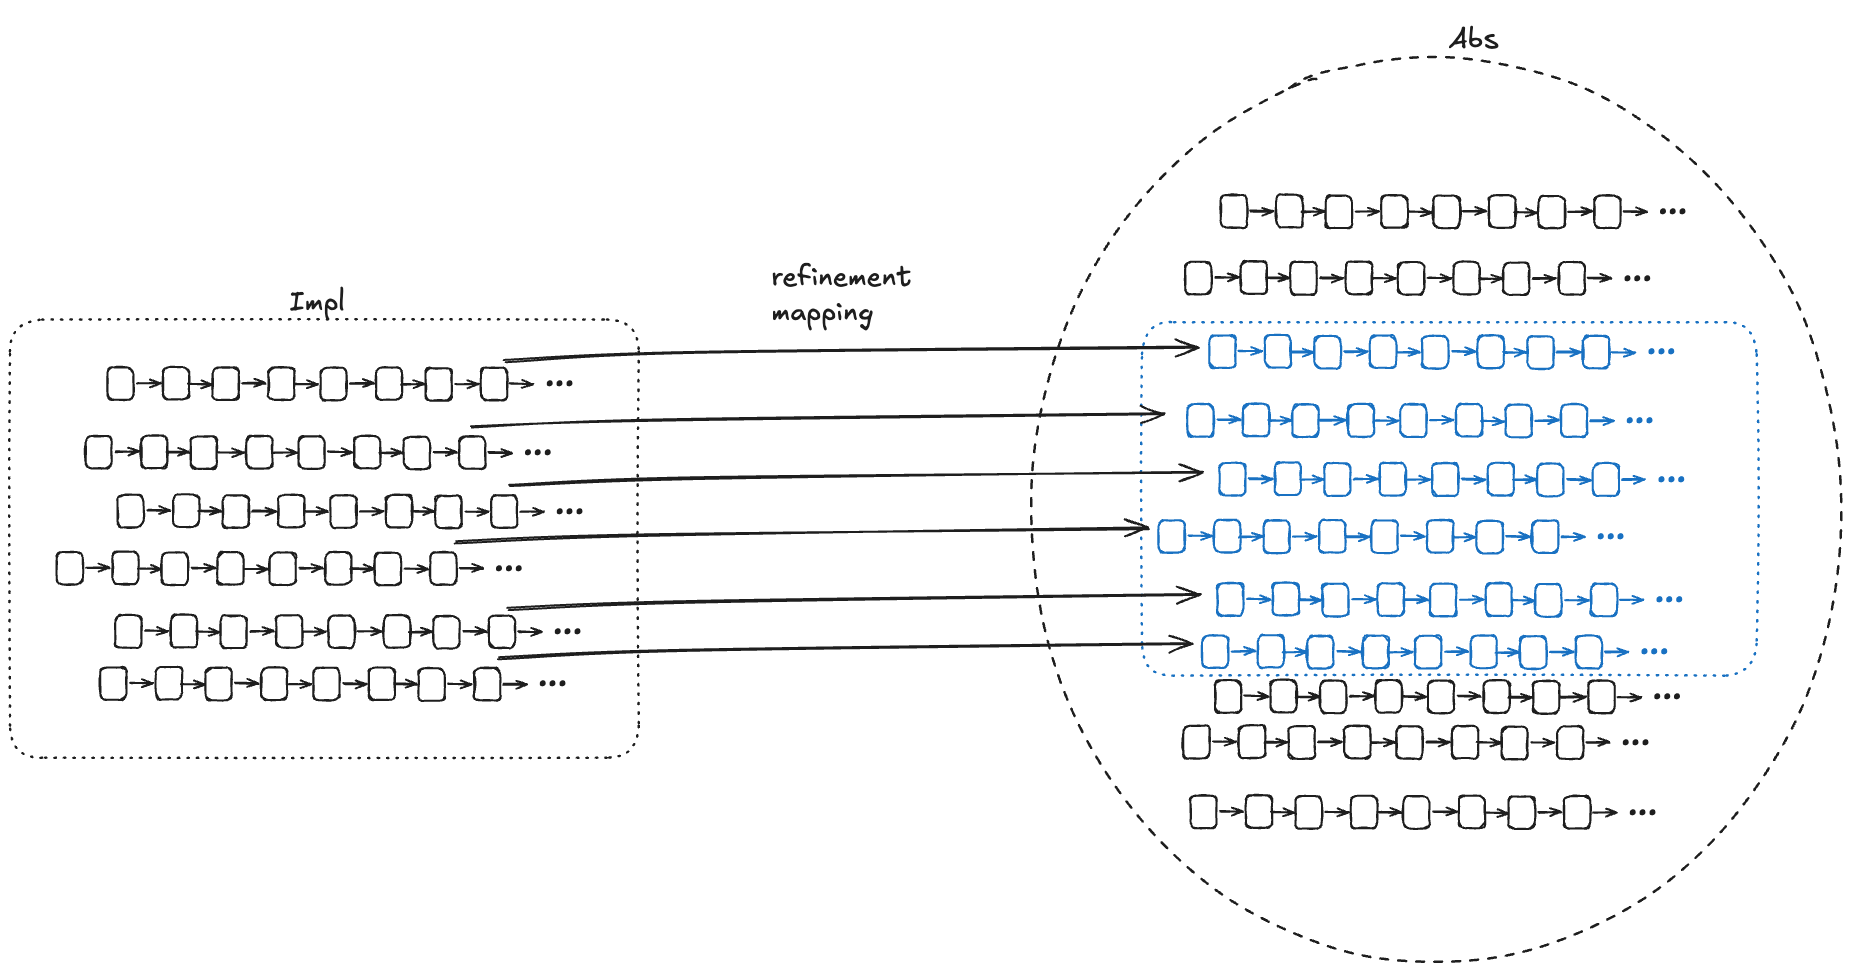
In the diagram below, Abs (for abstract) represents the set of valid (externally visible) behaviors of a high-level specification, and Impl (for implementation) represents the set of valid (externally visible) behaviors for a low-level specification. For Impl to implement Abs, the Impl behaviors must be a subset of the Abs behaviors.
We want to be able to prove that Impl implements Abs. In other words, we want to be able to prove that every externally visible behavior in Impl is also an externally visible behavior in Abs.
We want to be able to find a corresponding Abs behavior for every Impl behavior
One approach is to do this by construction: if we can take any behavior in Impl and construct a behavior in Abs with the same externally visible values, then we have proved that Impl implements Abs.
To prove that S1 implements S2, it suffices to prove that if S1 allows the behavior <<(e0,z0), (e1, z1), (e2, z2), …>>
where [ei is a state of the externally visible component and] the zi are internal states, then there exists internal states yi such that S2 allows <<(e0,y0), (e1, y1), (e2, y2), … >>
For each behavior B1 in Impl, if we can find values for internal variables in a behavior of Abs, B2, where the external variables of B2 match the external variables of B1, then that’s sufficient to prove that Impl implements Abs.
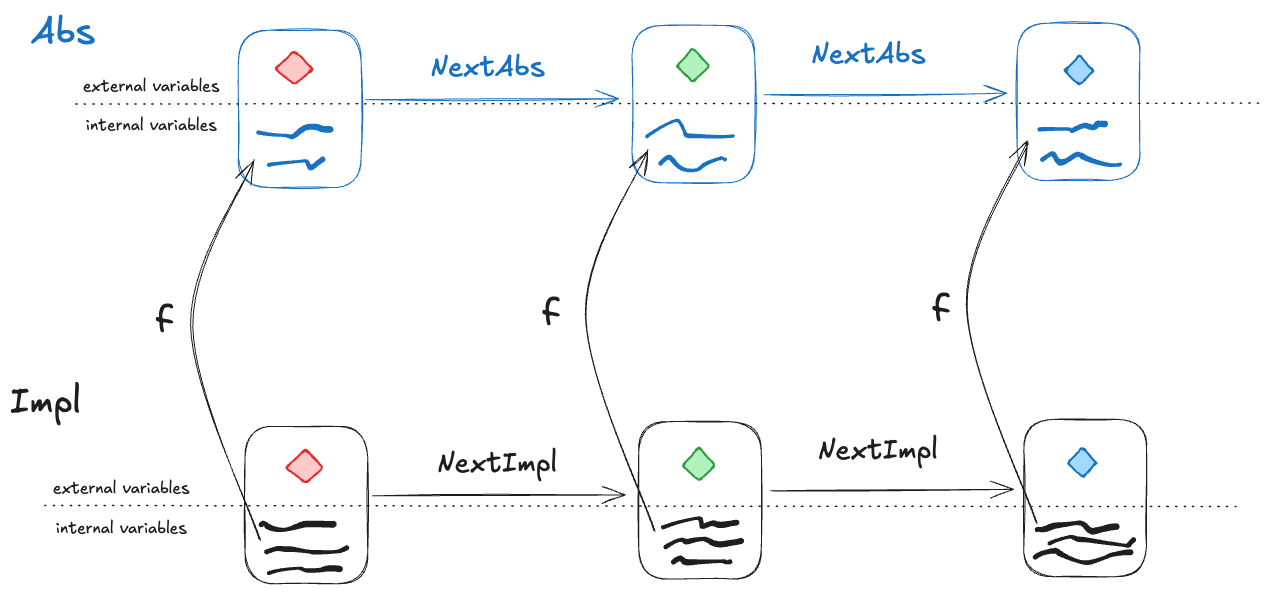
To show that Impl implements Abs, we need to find a refinement mapping, which is a function that will map every behavior in Impl to a behavior in Abs.
A refinement mapping takes a state in an Impl behavior as input and maps to an Abs state, such that:
the external variables are the same in both the Impl state and the Abs state
if a pair of states is a permitted Impl state transition, then the corresponding mapped pair of states must be a permitted Abs state transition
Or, to reword statement 2: if NextImpl is the next-state action for Impl (i.e., the set of allowed state transitions for Impl), and NextAbs is the next-state action for Abs, then under the refinement mapping, every NextImpl-step must map to a NextAbs step.
(Note: this technically isn’t completely correct, we’ll see why in the next section).
Example: our LLLQueue
We want to verify that our Python queue implementation is linearizable. We’ve modeled our Python queue in TLA+ as LLLQueue, and to prove that it’s linearizable, we need to show that a refinement mapping exists between the LLLQueue spec and the LinearizableQueue spec. This means we need to show that there’s a mapping from LLLQueue’s internal variables to LinearizableQueue’s internal variables.
We need to define the internal variables in LinearizableQueue (up, d) in terms of the variables in LLLQueue (nodes, vals, next, prev, head, tail, lock, new_tail, empty, pc, stack) in such a way that all LLLQueue behaviors are also LinearizableQueue behaviors under the mapping.
Internal variable: d
The internal variable d in LinearizableQueue is a sequence which contains the values of the queue, where the first element of the sequence is the head of the queue.
Looking back at our example LLLQueue queue:
We need a mapping that, for this example, results in: d =〈A,B,C,D 〉
I defined a recursive operator that I named Data such that when you call Data(head), it evaluates to a sequence with the values of the queue.
Internal variable: up
The variable up is a boolean flag that flips from false to true after the value has been added to the queue.
In our LLLQueue model, the new node gets added to the tail by the action E3. In PlusCal models, there’s a variable named pc (program counter) that records the current execution state of the program. You can think of pc like a breakpoint that points to the action that will be executed on the next step of the program. We want up to be true after action E3. You can see how the up mapping is defined at the bottom of the LLLQueue.tla file.
Refinement mapping and stuttering
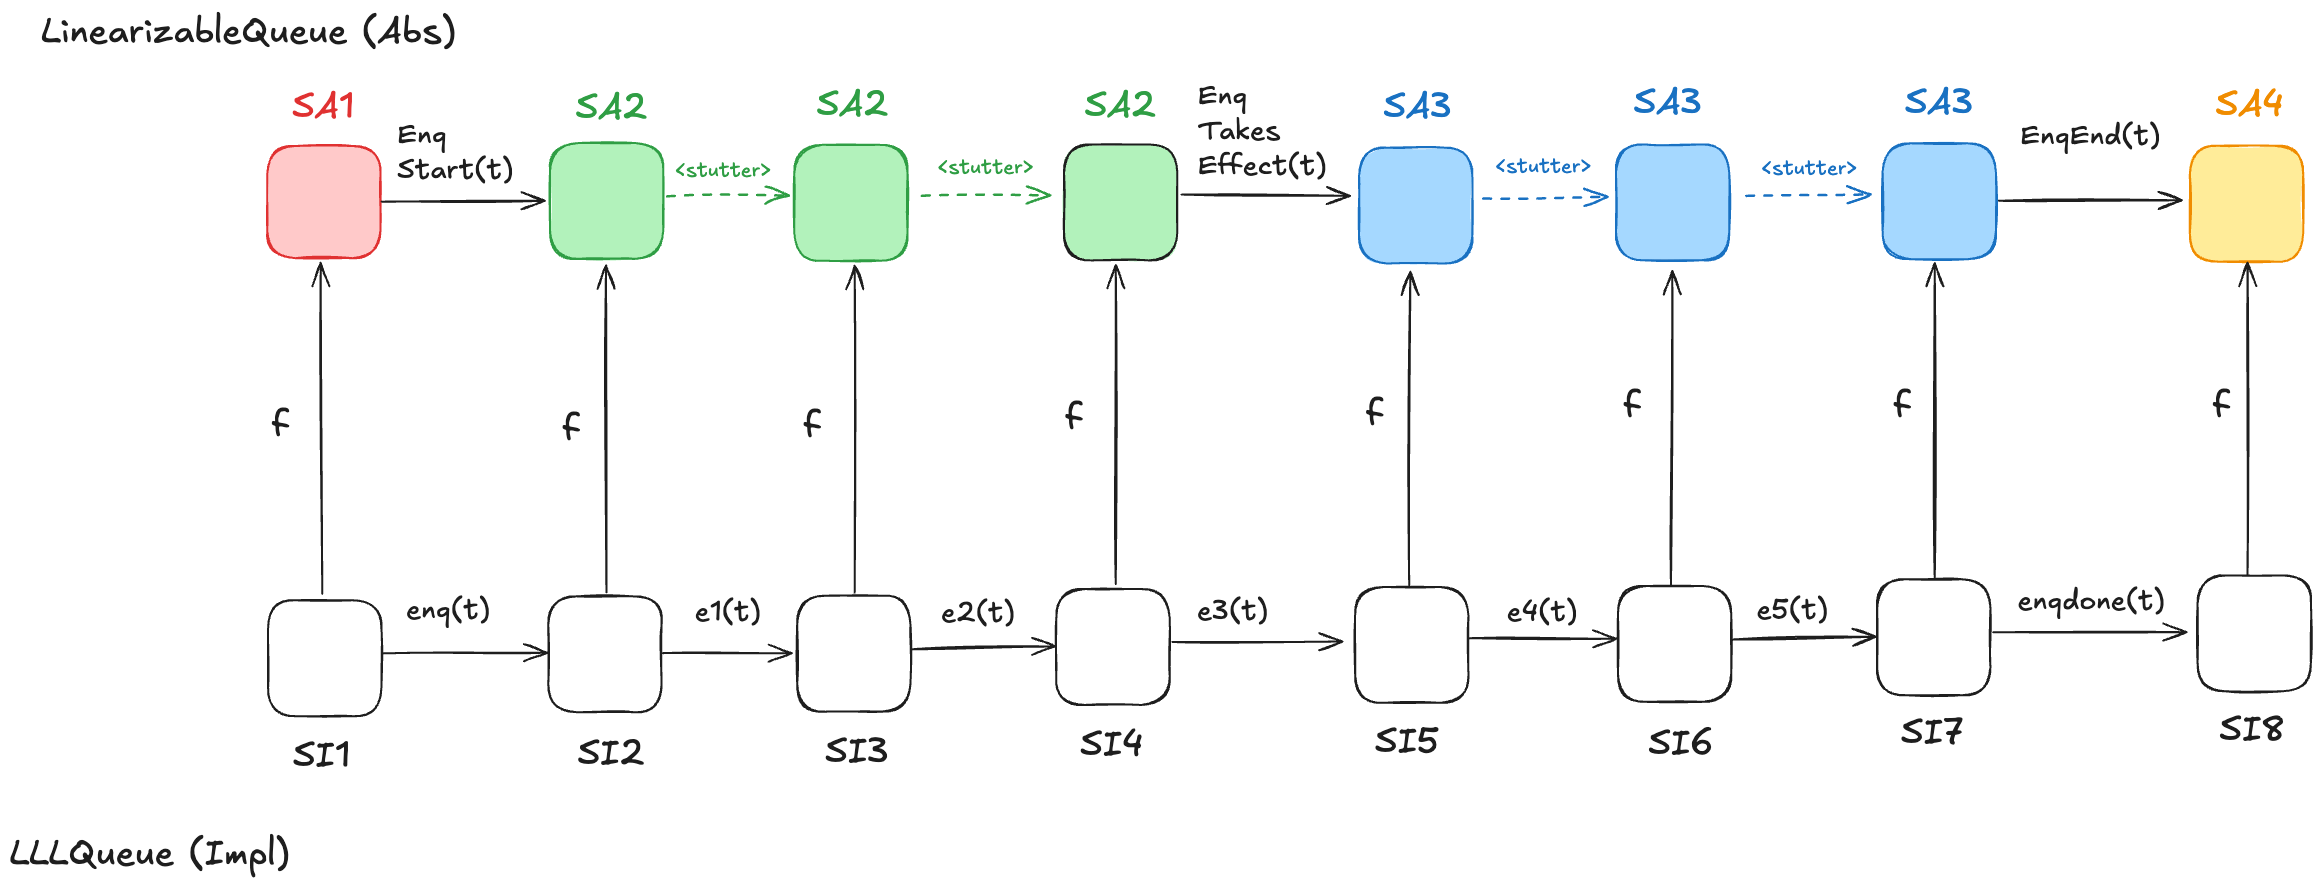
Let’s consider a behavior of the LLLQueue spec that enqueues a single value onto the queue, with a refinement mapping to the LinearizableQueue spec:
In the LinearizableQueue spec, an enqueue operation is implemented by three actions:
EnqStart
EnqTakesEffect
EnqEnd
In the LLLQueue spec, an enqueue operation is implemented by seven actions: enq, e1, …, e5, enqdone. That means that the LLLQueue enqueue behavior involves eight distinct states, where the corresponding LinearizableQueue behavior involves only four distinct states. Sometimes, different LLLQueue states map to the same LinearizableQueue state. In the figure above, SI2,SI3,SI4 all map to SA2, and SI5,SI6,SI7 all map to SA3. I’ve color-coded the states in the LinearizableQueue behavior such that states that have the same color are identical.
As a result, some state transitions in the refinement mapping are not LinearizableQueue actions, but are instead transitions where none of the variables change at all. These are called stuttering steps. In TLA+, stuttering steps are always permitted in all behaviors.
A problem with refinement mappings: the Herlihy and Wing queue
The last section of the Herlihy and Wing paper describes how to prove that a concurrent data structure’s operations are linearizable. In the process, the authors also point out a problem with refinement mappings. They illustrate the problem using a particular queue implementation, which we’ll call the “Herlihy & Wing queue”, or H&W Queue for short.
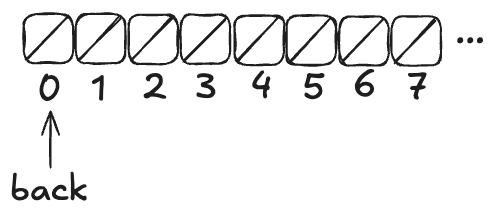
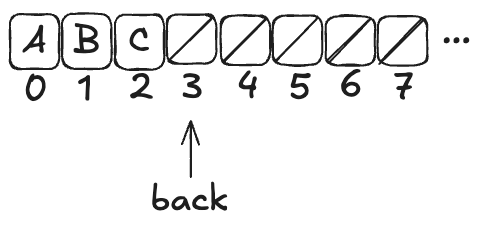
Imagine an array of infinite length, where all of the values are initially null. There’s a variable named back which points to the next available free spot in the queue.
Enqueueing
To enqueue a value onto the Herlihy & Wing queue involves two steps:
Increment the back variable
Write the value into the spot where the back variable pointed before being incremented .
Here’s what the queue looks like after three values (A,B,C) have been enqueued:
Note how back always points to the next free spot.
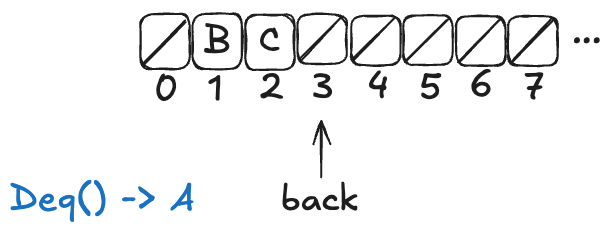
Dequeueing
To dequeue, you start at index 0, and then you sweep through the array, looking for the first non-null value. Then you atomically copy that value out of the array and set the array element to null.
Here’s what a dequeue operation on the queue above would look like:
The Deq operation returned A, and the first element in the array has been set to null.
If you were to enqueue another value (say, D), the array would now look like this:
Note: the elements at the beginning of the queue that get set to null after a dequeue don’t get reclaimed. The authors note that this is inefficient, but the purpose of this queue is to illustrate a particular issue with refinement mappings, not to be a practical queue implementation.
H&W Queue pseudocode
Here’s the pseudocode for Herlihy & Wing queue, which I copied directly from the paper. The two operations are Enq (enqueue) and Deq (dequeue).
rep = record {back: int, items: array [item]}

Enq = proc (q: queue, x: item)
  i: int := INC(q.back) % Allocate a new slot
  STORE (q.items[i], x) % Fill it.
  end Enq

Deq = proc (q: queue) returns (item)
  while true do
    range: int := READ(q.back) - 1
    for i: int in 1 .. range do
      x: item := SWAP(q.items[i], null)
      if x ~= null then return(x) end
      end
    end
end Deq
This algorithm relies on the following atomic operations on shared variables:
INC – atomically increment a variable and return the pre-incremented value
STORE – atomically write an element into the array
READ – atomically read an element in the array (copy the value to a local variable)
SWAP – atomically write an element of an array and return the previous array value
H&W Queue implementation in C++
Here’s my attempt at implementing this queue using C++. I chose C++ because of its support for atomic types. C++’s atomic types support all four of the atomic operations required of the H&W queue.
Atomic operation
Description
C++ equivalent
INC
atomically increment a variable and return the pre-incremented value
My queue implementation stores pointers to objects of parameterized type T. Note the atomic types of the member variables. The back variable and elements of the items array need to be atomics because we will be invoking atomic operations on them.
template <typename T>
class Queue {
    atomic<int> back;
    atomic<T *> *items;

public:
    Queue(int sz) : back(0), items(new atomic<T *>[sz]) {}
    ~Queue() { delete[] items; }

    void enq(T *x);
    T *deq();
};

template<typename T>
void Queue<T>::enq(T *x) {
    int i = back.fetch_add(1);
    std::atomic_store(&items[i], x);
}

template<typename T>
T *Queue<T>::deq() {
    while (true) {
        int range = std::atomic_load(&back);
        for (int i = 0; i < range; ++i) {
            T *x = std::atomic_exchange(&items[i], nullptr);
            if (x != nullptr) return x;
        }
    }
}
We can write enq and deq to look more like idiomatic C++ by using the following atomic operators:
Using these operators, enq and deq look like this:
template<typename T>
void Queue<T>::enq(T *x) {
    int i = back++;
    items[i] = x;
}

template<typename T>
T *Queue<T>::deq() {
    while (true) {
        int range = back;
        for (int i = 0; i < range; ++i) {
            T *x = std::atomic_exchange(&items[i], nullptr);
            if (x != nullptr) return x;
        }
    }
}
Note that this is, indeed, a linearizable queue, even though it does not use mutual exclusion: tthere are no critical sections in the algorithm.
Modeling the H&W queue in TLA+ with PlusCal
The H&W queue is straightforward to model in PlusCal. If you’re interested in learning PlusCal, it’s actually a great example to use. See HWQueue.tla for my implementation.
Refinement mapping challenge: what’s the state of the queue?
Note how the enq method isn’t an atomic operation. Rather, it’s made up of two atomic operations:
Increment back
Store the element in the array
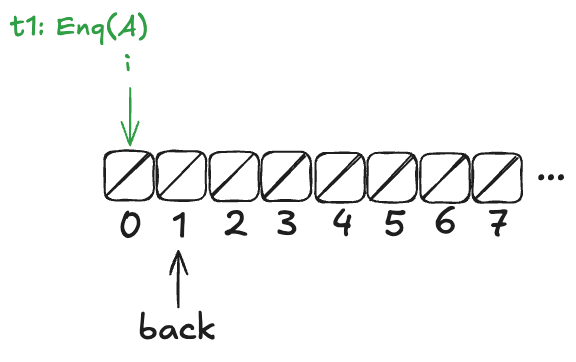
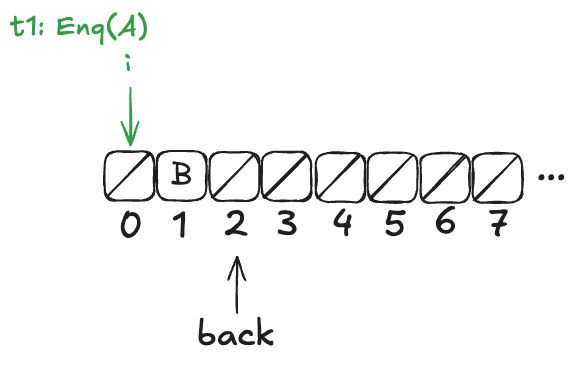
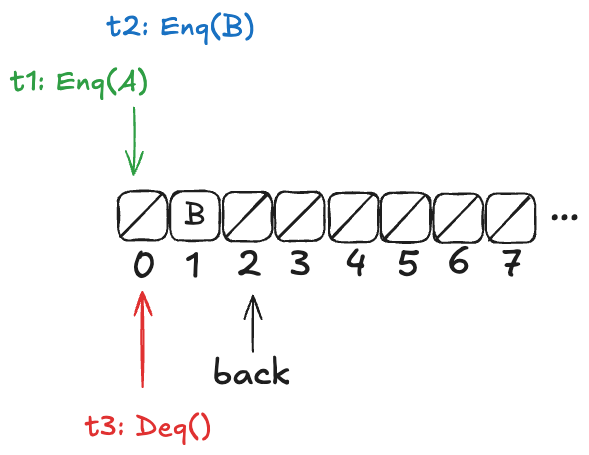
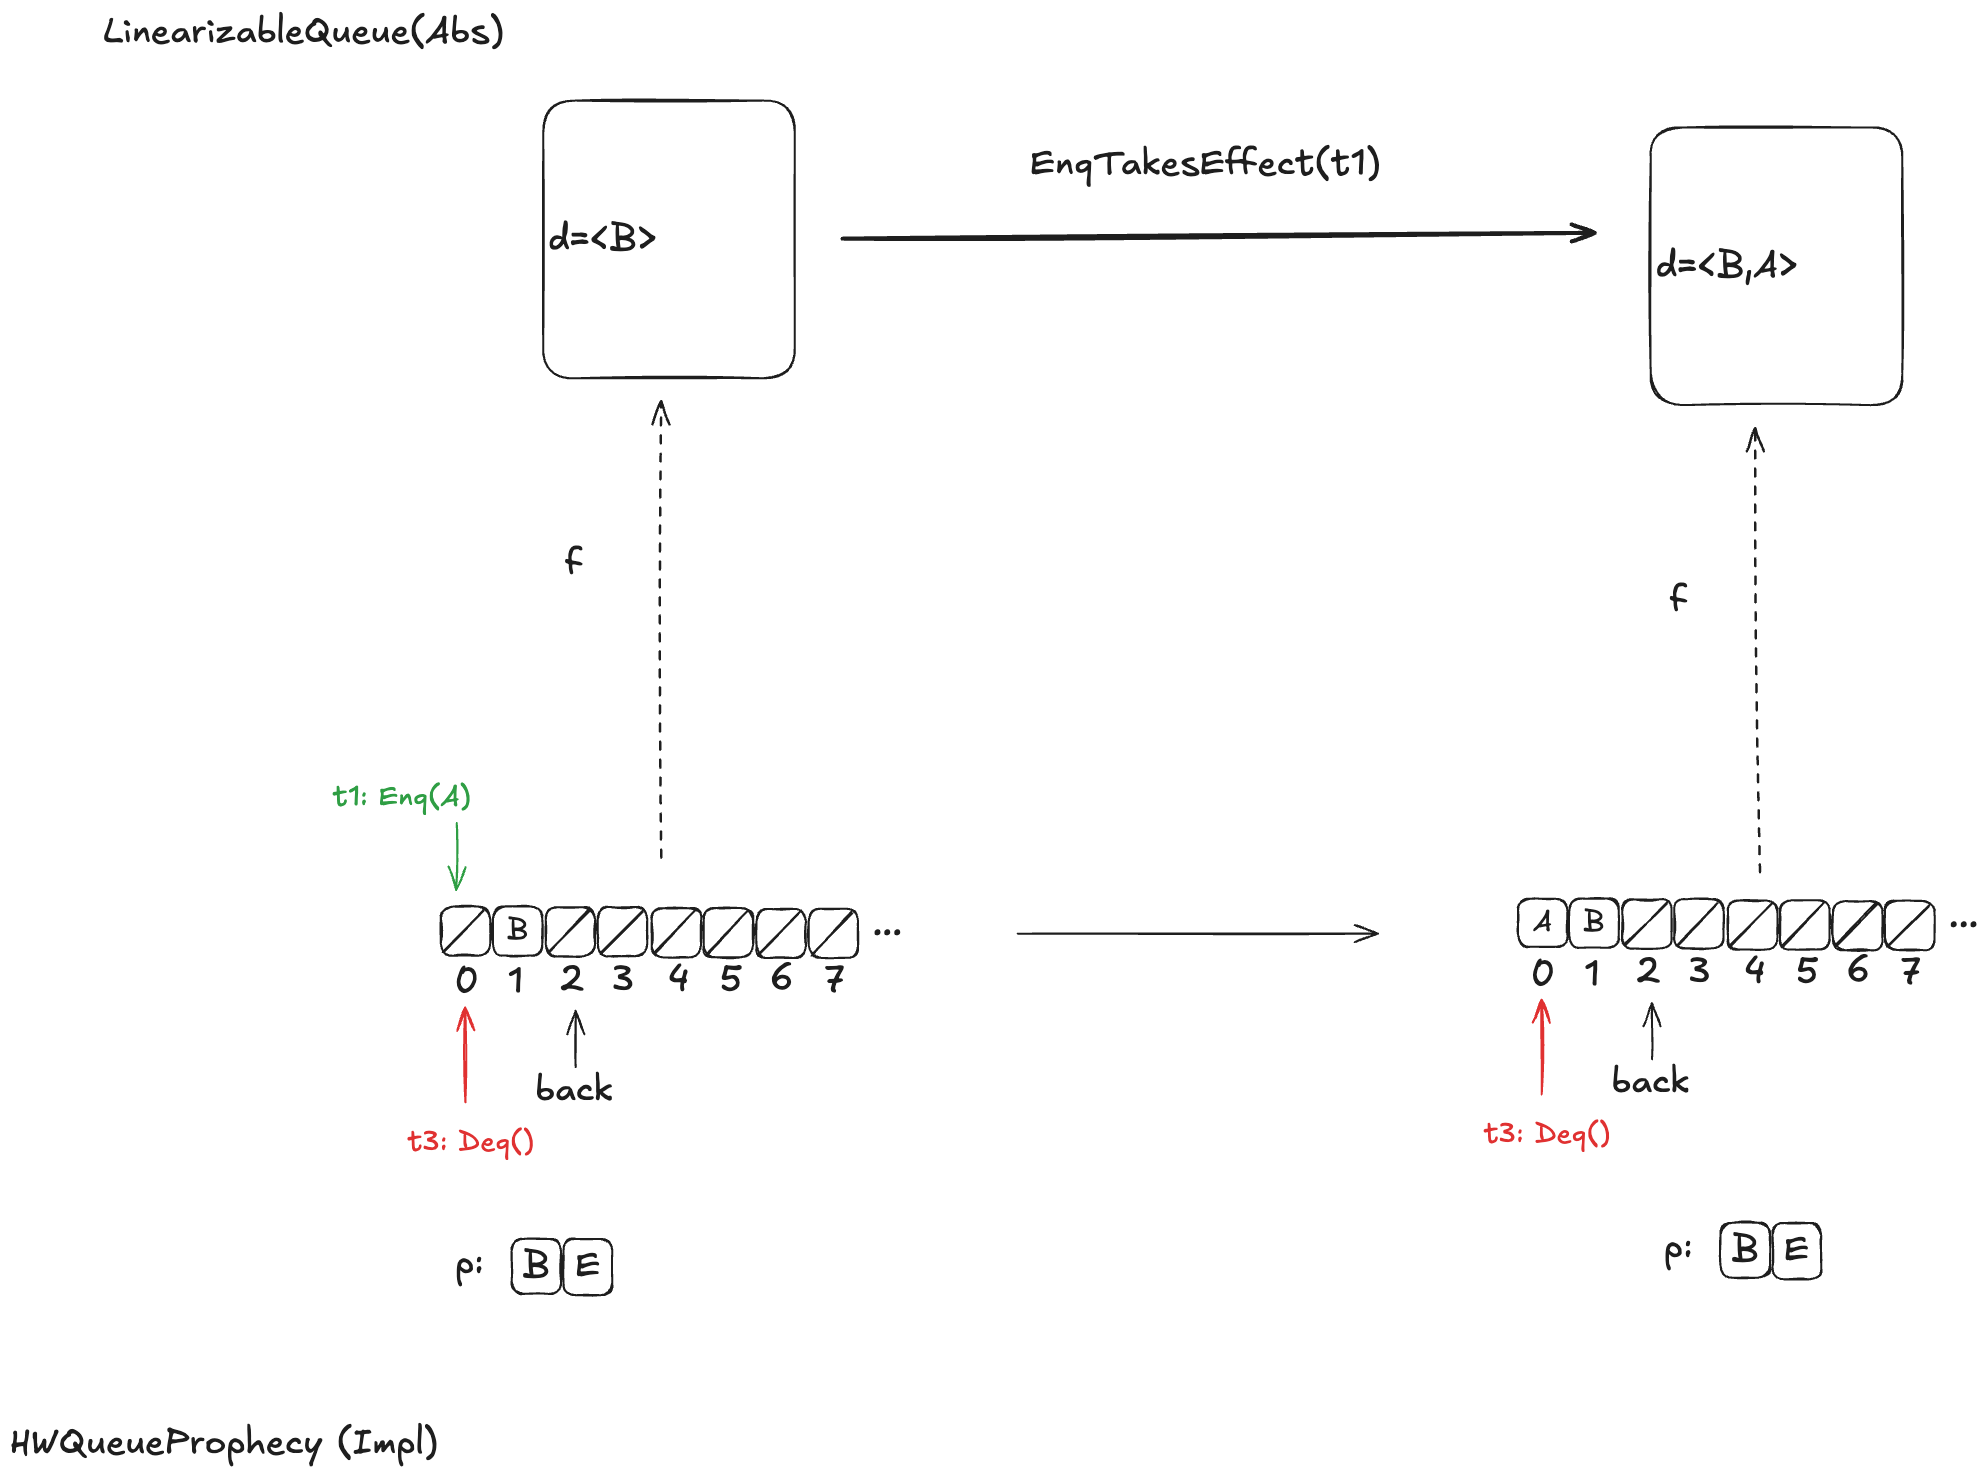
Now, imagine that a thread, t1, comes along, to enqueue a value to the queue. It starts off by incrementing back.
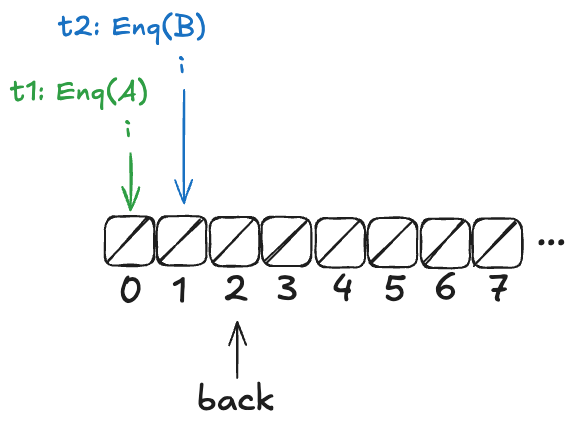
But before it can continue, a new thread, t2, gets scheduled, which also increments back:
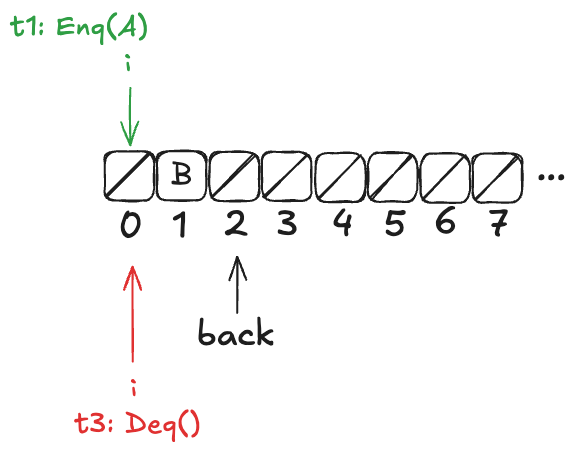
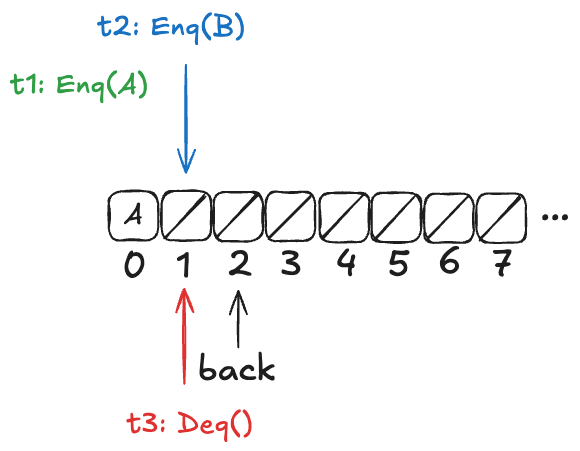
t2 then completes the operation:
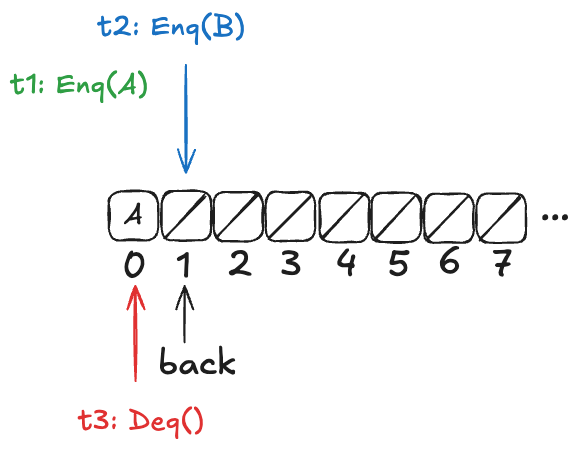
Finally, a new thread, t3, comes along that executes the dequeue operation:
Example state of the H&W queue
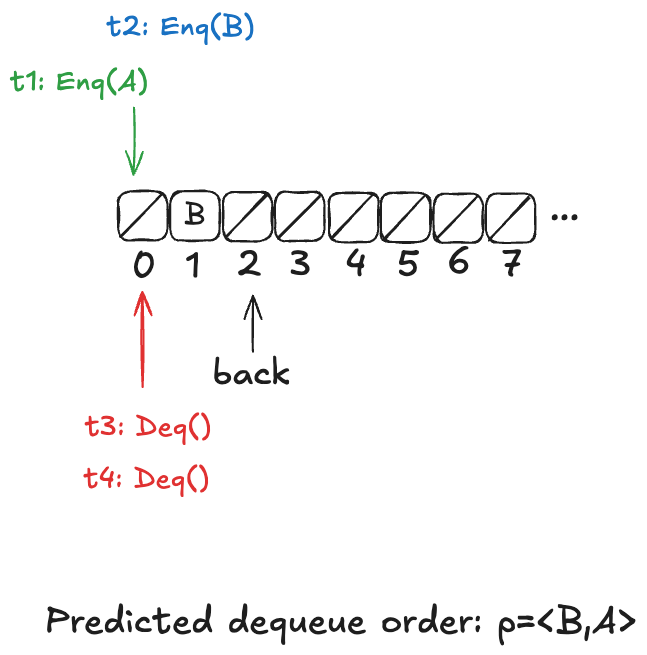
Now, here’s the question: What value will the pending Deq() operation return: A or B?
The answer: it depends on how the threads t1 and t3 will be scheduled. If t1 is scheduled first, it will write A to position 0, and then t3 will read it. On the other hand, if t3 is scheduled first, it will advance its i pointer to the next non-null value, which is position 1, and return B.
Recall back in the section “Modeling a queue with TLA+ > The internal variables” that our model for a linearizable queue had an internal variable, named d, that contained the elements of the queue in the order in which they had been enqueued.
If we were to write a refinement mapping of this implementation to our linearizable specification, for the state above, we’d have to decide whether the mapping for the above state should be. The problem is that no such refinement mapping exists.
Here are the only options that make sense for the example above:
d =〈B〉
d =〈A,B〉
d =〈B,A〉
As a reminder, here are the valid state transitions for the LinearizableQueue spec.
Option 1: d =〈B〉
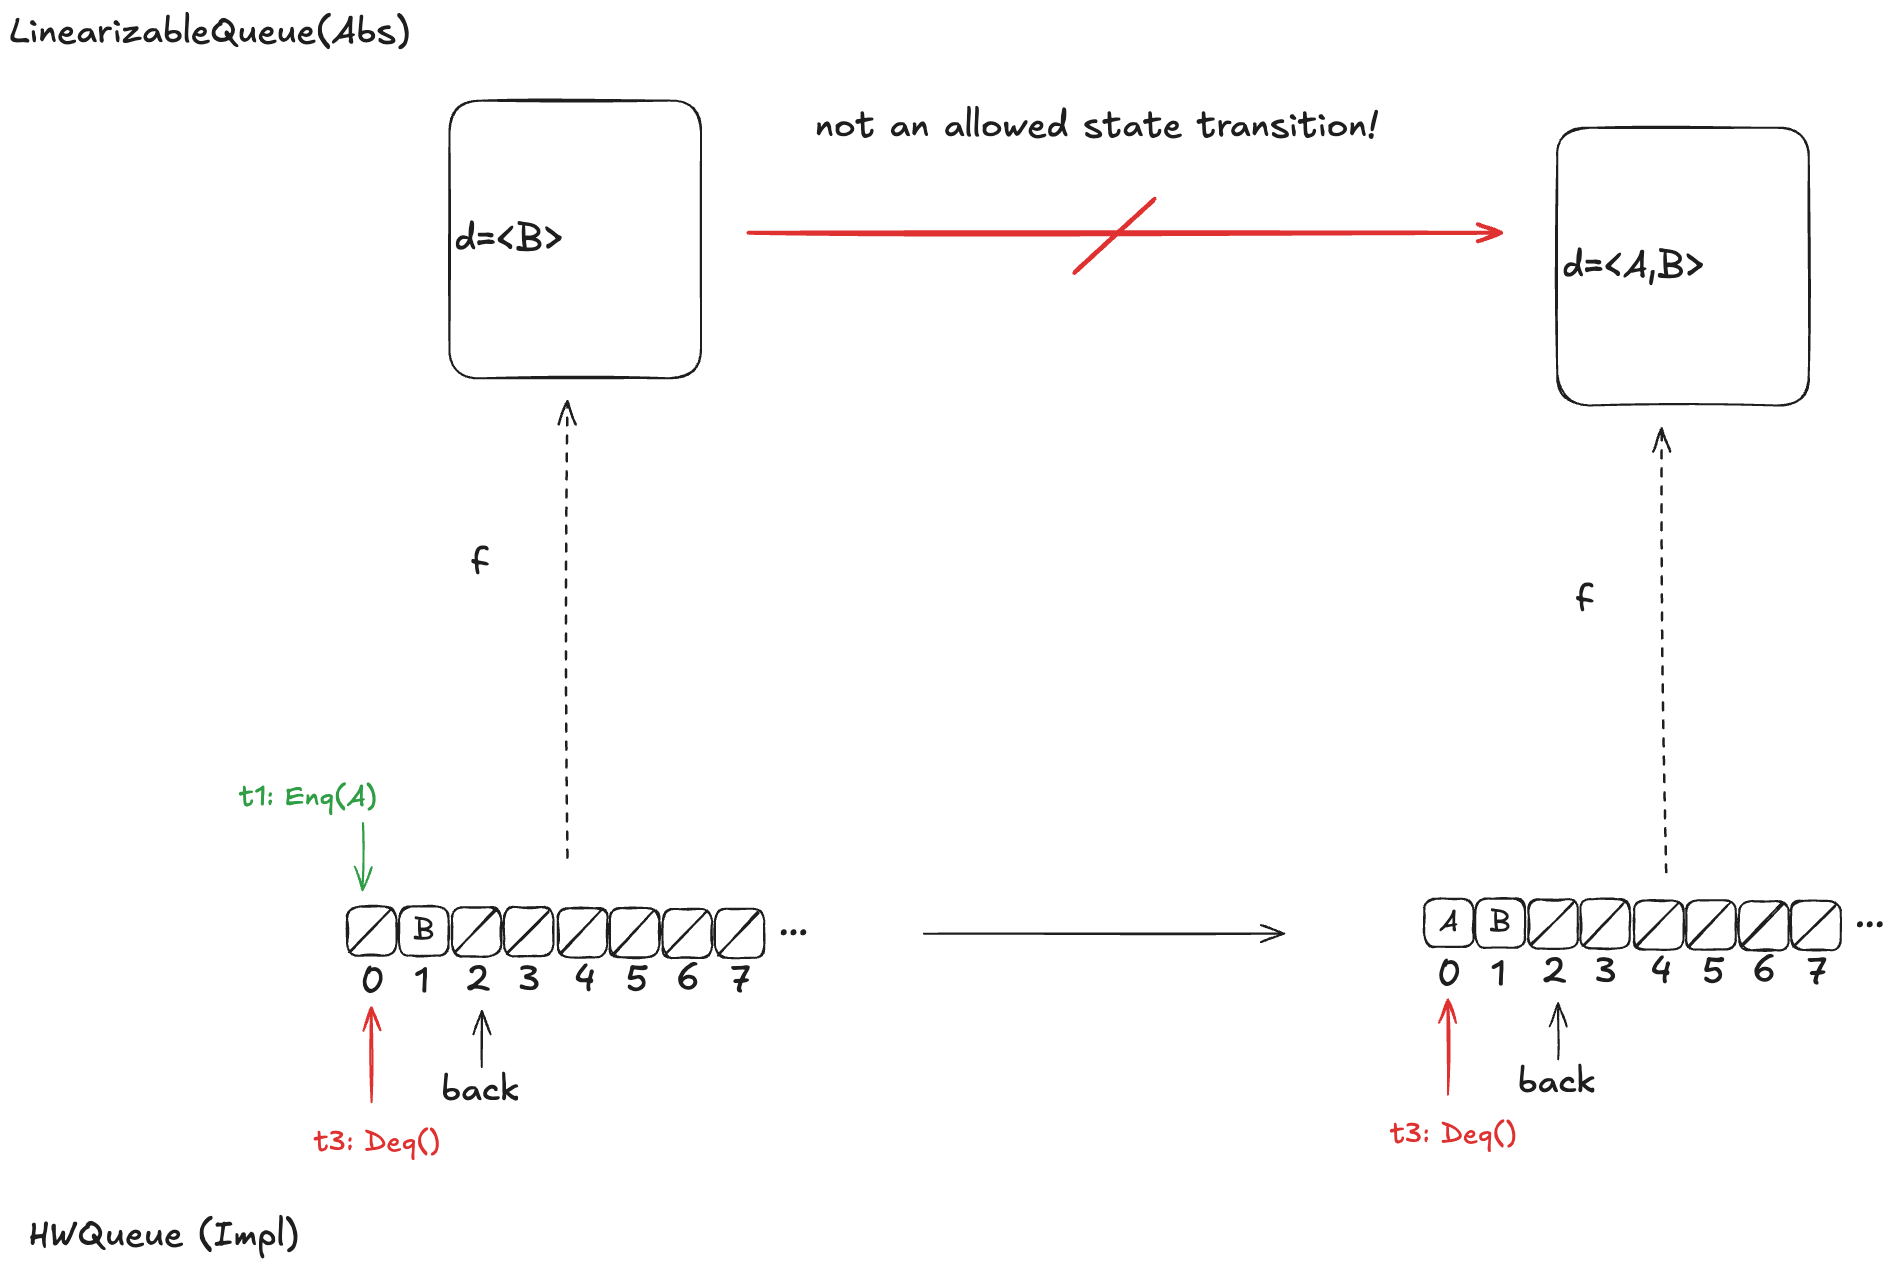
Let’s say we define our refinement mapping by using the populated elements of the queue. That would result in a mapping of d =〈B〉.
The problem is that if t1 gets scheduled first and adds value A to array position 0, then an element will be added to the head of d. But the only LinearizableQueue action that adds an element to d is EnqTakeEffect, which adds a value to the to the end of d. There is no LinearizableQueue action that allows prepending to d, so this cannot be a valid refinement mapping.
Option 2: d =〈A,B〉
Let’s say we had chosen instead a refinement mapping of d =〈A,B〉for the state above. In that case, if t3 gets scheduled first, then it will result in a value being removed from the end of d, which is not one of the actions of the LinearizableQueueSpec, which means that this can’t be a valid refinement mapping either.
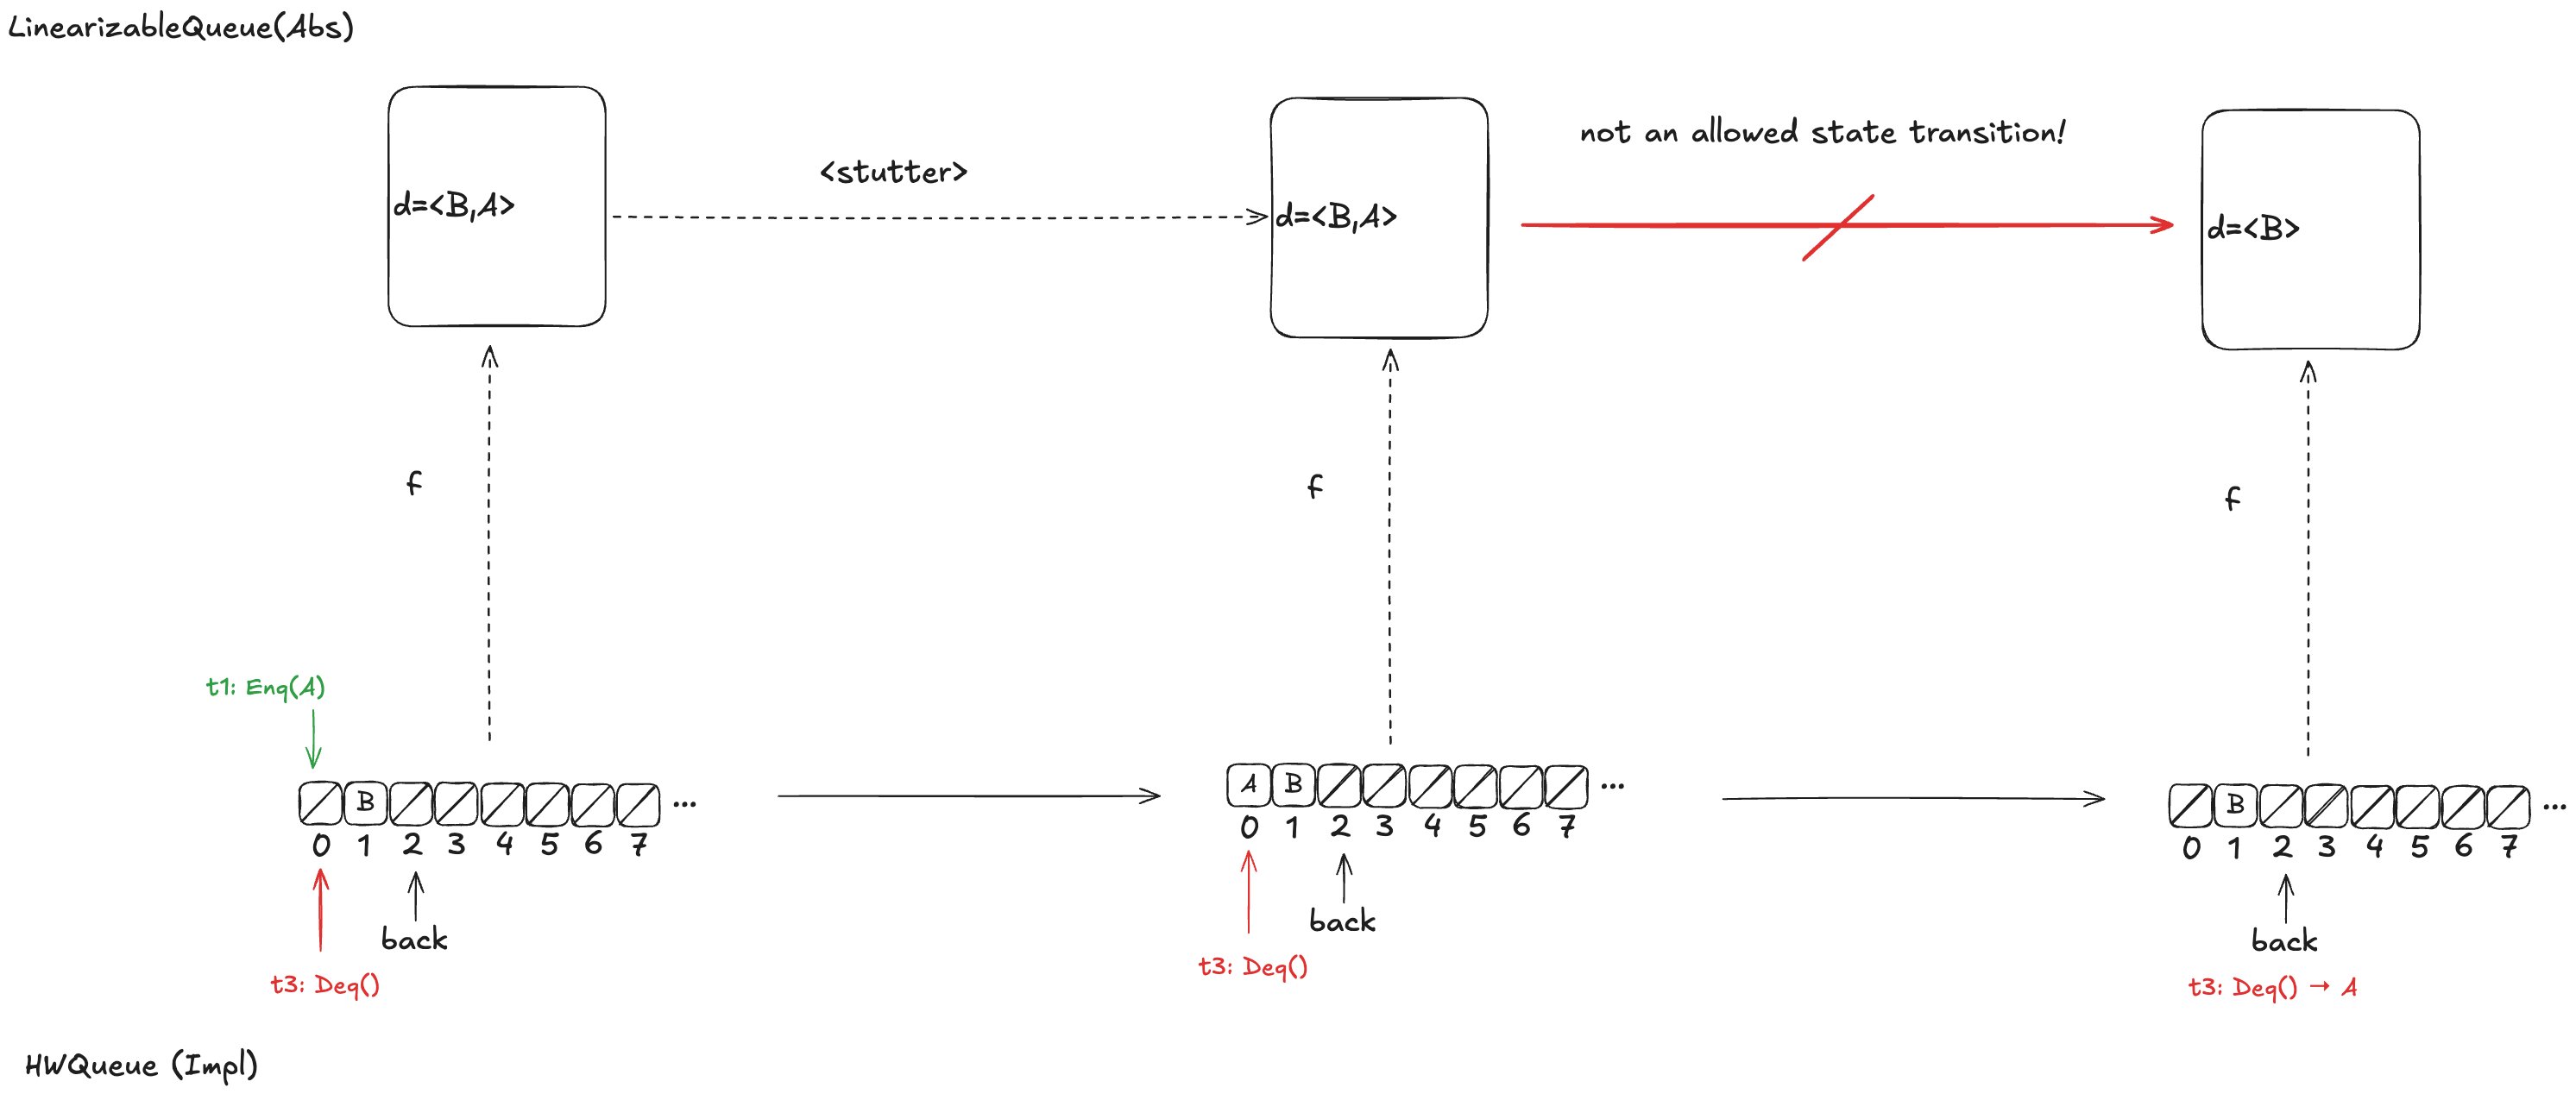
Option 3: d =〈B,A〉
Finally, assume we had chosen d =〈B,A〉as our refinement mapping. Then, if t1 gets scheduled first, and then t3, we will end up with a state transition that removes an element from the end of d, which is not a LinearizableQueue action.
Whichever refinement mapping we choose, it is possible that the resulting behavior will violate the LinearizableQueue spec. This means that we can’t come up with a refinement mapping where every behavior of Impl maps to a valid behavior of Abs, even though Impl implements a linearizable queue!
What Lamport and others believed at the time was that this type of refinement mapping always existed if Impl did indeed implement Abs. With this counterexample, Herlihy & Wing demonstrated that this was not always the case.
Elements in H&W queue aren’t totally ordered
In a typical queue implementation, there is a total ordering of elements that have been enqueued. The odd thing about the Herlihy & Wing queue is that this isn’t the case.
If we look back at our example above:
If t1 is scheduled first, A is dequeued next. If t3 is scheduled first, B is dequeued next.
Either A or B might be dequeued next, depending on the ordering of t1 and t3. Here’s another example where the value dequeued next depends on the ordering of the threads t1 and t3.
If t2 is scheduled first, B is dequeued next. If t3 is scheduled first, A is dequeued next.
However, there are also scenarios where there is a clear ordering among values that have been added to the queue. Consider a case similar to the one above, except that t2 has not yet incremented the back variable:
In this configuration, A is guaranteed to be dequeued before B. More generally, if t1 writes A to the array before t2 increments the back variable, then A is guaranteed to be dequeued before B.
In the linearizability paper, Herlihy & Wing use a mapping approach where they identify a set of possible mappings rather than a single mapping.
Let’s think back to this scenario:
If t1 is scheduled first, A is dequeued next. If t3 is scheduled first, B is dequeued next.
In the scenario above, in the Herlihy and Wing approach, the mapping would be to the set of all possible values of queue.
queue ∈ {〈B〉,〈A,B〉, 〈B,A〉}
Lamport took a different approach to resolving this issue. He rescued the idea of refinement mappings by introducing a concept called prophecy variables
Prophecy
The Herlihy & Wing queue’s behavior is non-deterministic: we don’t know the order in which values will be dequeued, because it depends on the scheduling of the threads. But imagine if we know in advance the order in which the values were dequeued.
It turns out that if we can predict the order in which the values would be dequeued, then we can do a refinement mapping to the our LinearizableQueue model.
This is the idea behind prophecy variables: we predict certain values that we need for refinement mapping.
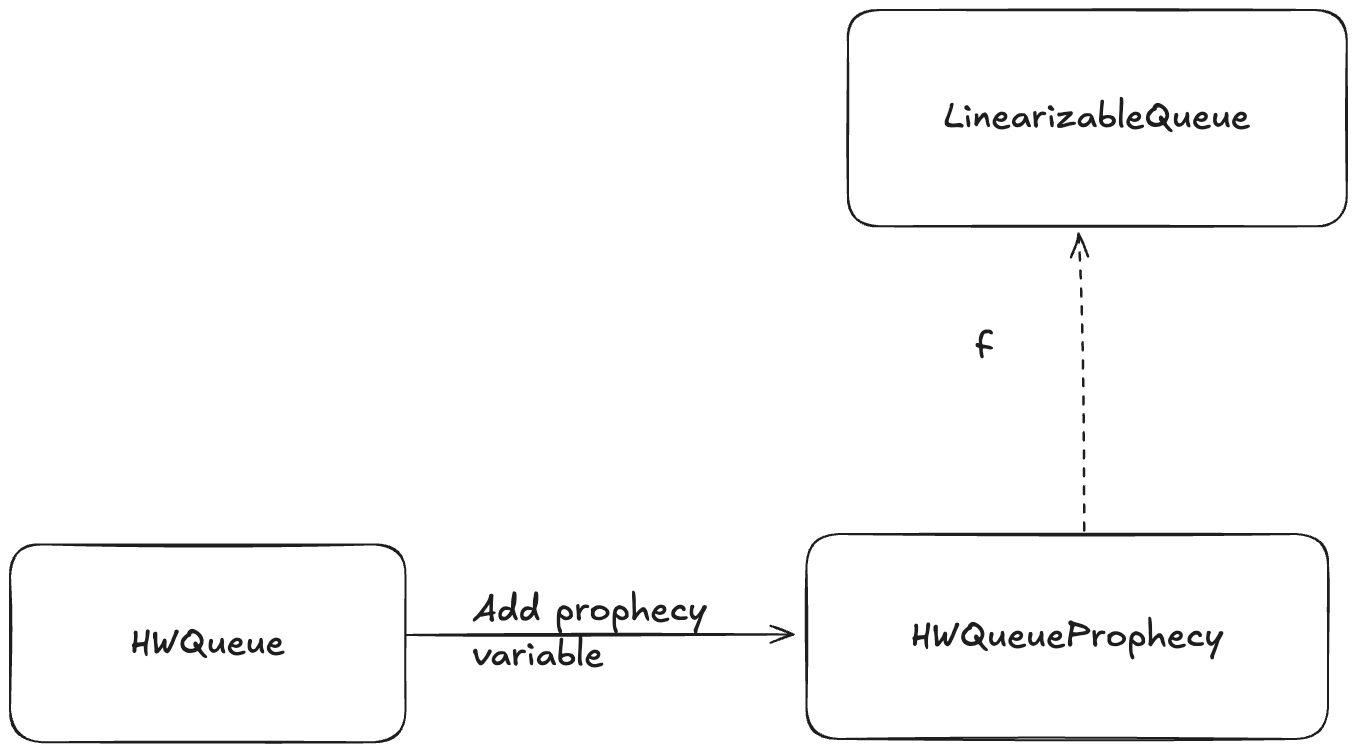
Adding a prophecy variable gives us another specification (one which has a new variable), and this is the specification where we can define a refinement mapping. For example, we add a prophecy to our HWQueue model and call the new model HWQueueProphecy.
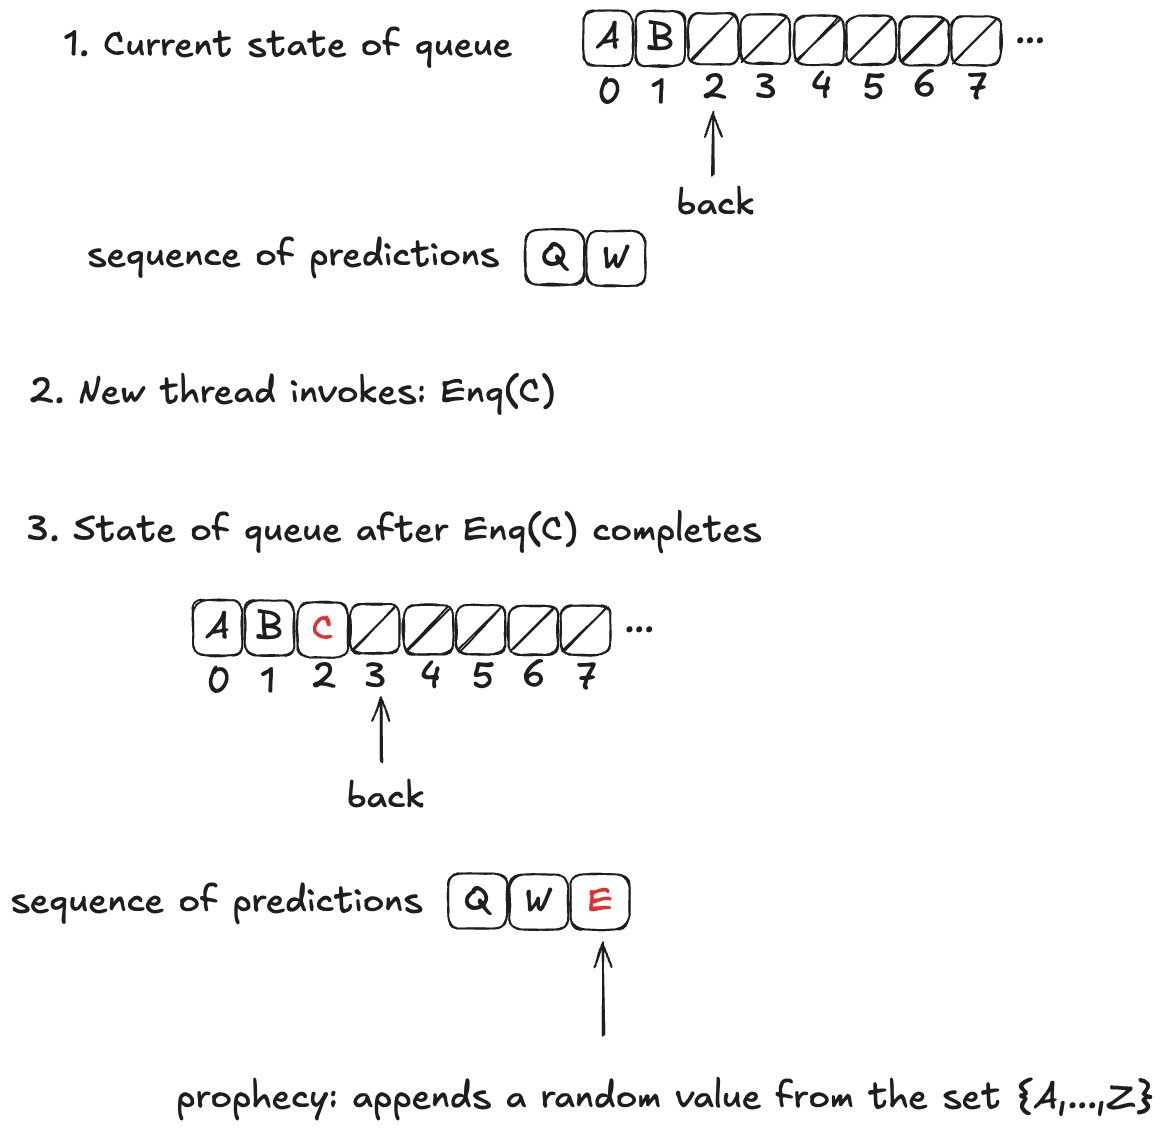
In HWQueueProphecy, we maintain a sequence of the predicted order in which values will be dequeued. Every time a thread invokes the enqueue operation, we add a new value to our sequence of predicted dequeue operations.
The predicted value is chosen at random from the set of all possible values: it is not necessarily related to either the value currently being enqueued or the current state of the queue.
Now, these predictions might not actually come true. In fact, they almost certainly won’t come true, because we’re much more likely to predict at least one value incorrectly. In the example above, the actual dequeueing order will be〈A,B,C〉, which is different from the predicted dequeueing order of〈Q,W,E〉
However, the refinement mapping will still work, even though the predictions will often be wrong, if we set things up correctly. We’ll tackle that next.
Prophecy requirements
We want to show that HWQueue implements LinearizableQueue. But it’s only HWQueueProphecy that we can show implements LinearizableQueue using a refinement mapping.
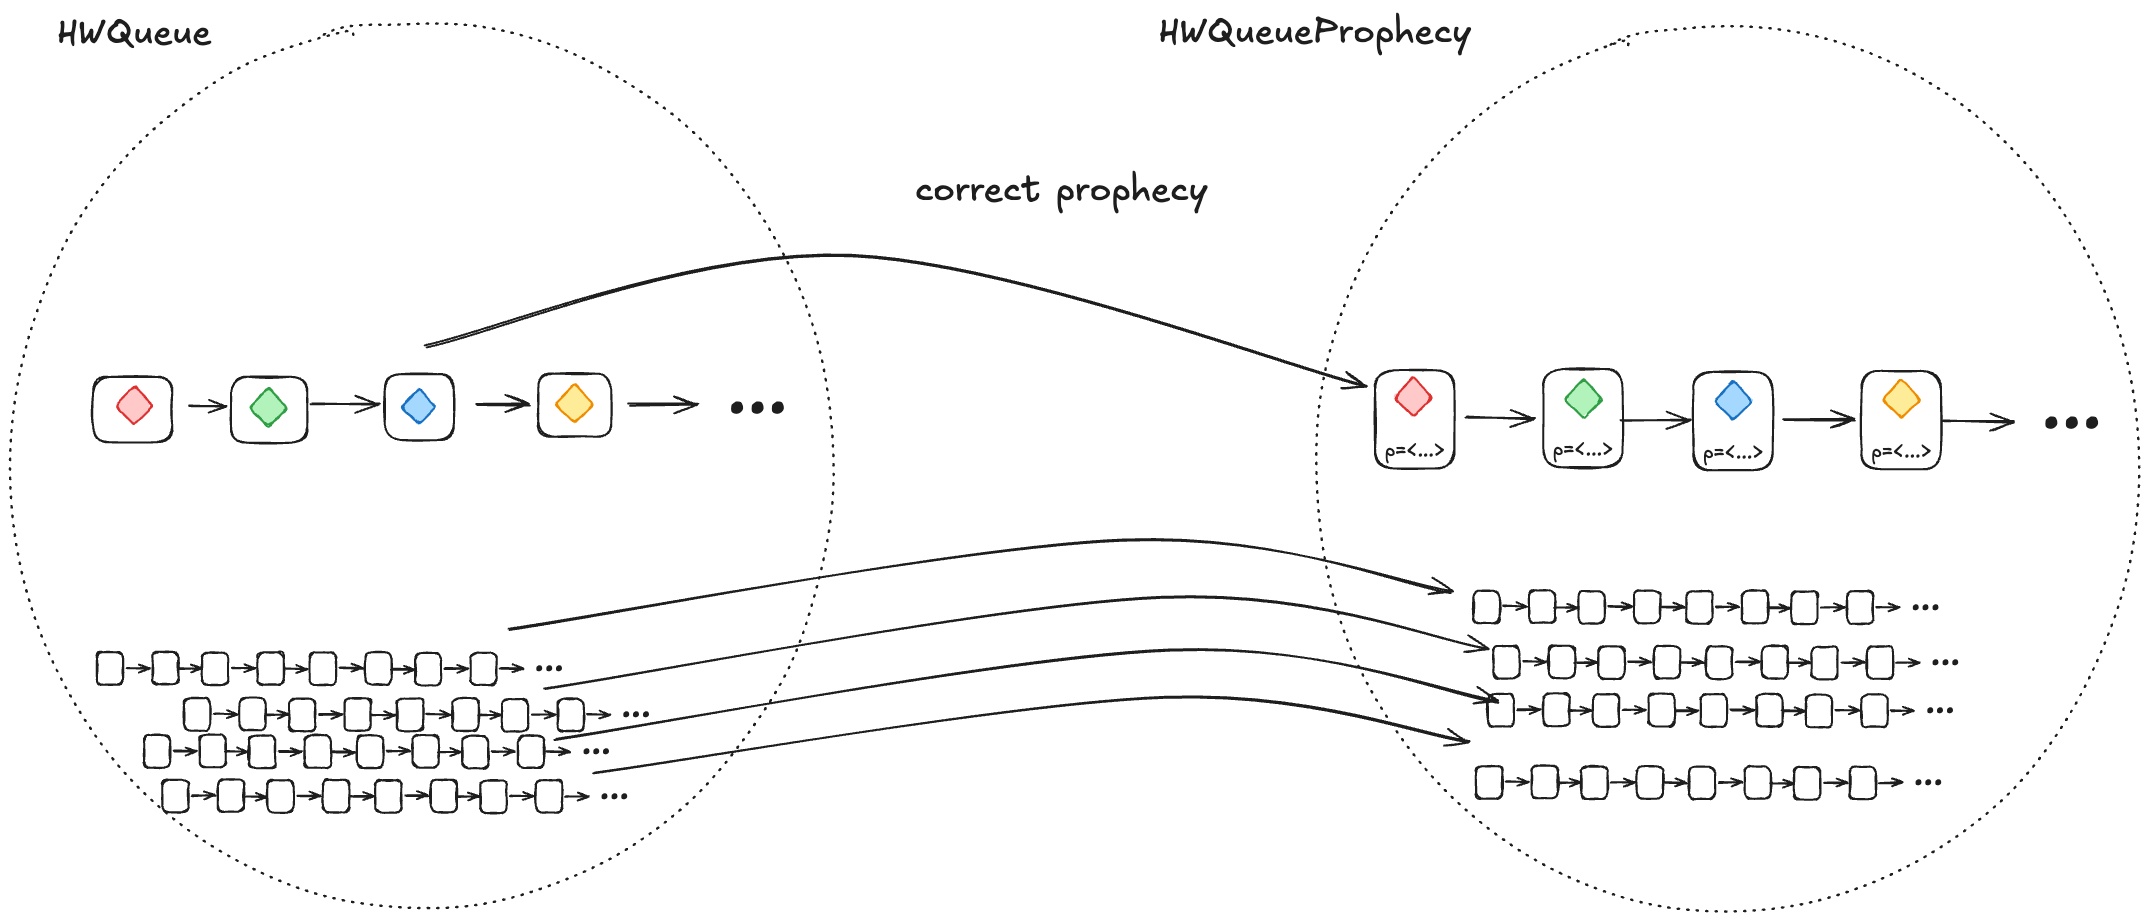
1. A correct prophecy must exist for every HWQueue behavior
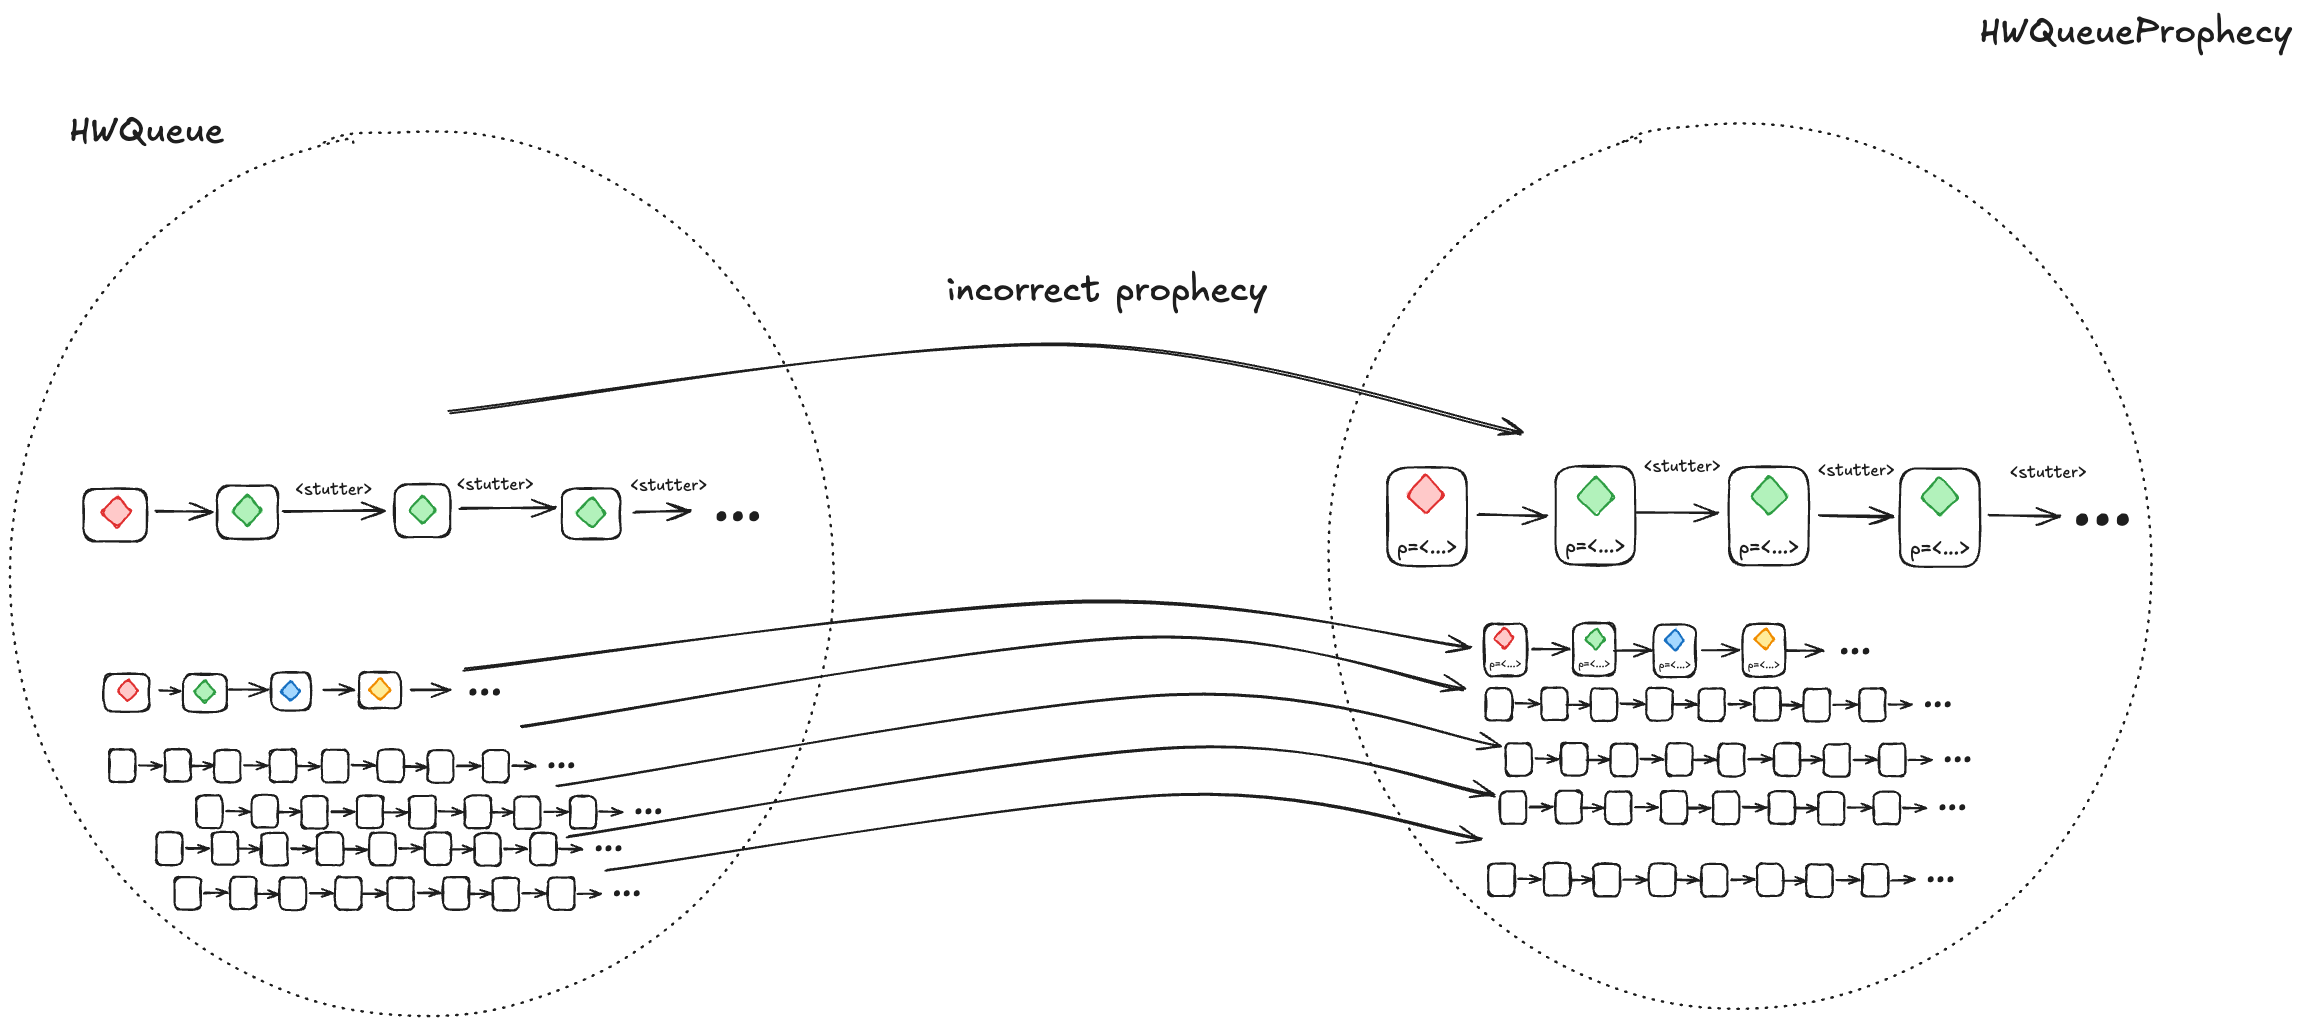
Every behavior in HWQueue must have a corresponding behavior in HWQueueProphecy. That correspondence happens when the prophecy accurately predicts the dequeueing order.
This means that, for each behavior in HWQueue, there must be a behavior in HWQueueProphecy which is identical except that the HWQueueProphecy behaviors have an additional p variable with the prophecy.
To ensure that a correct prophecy always exists, we just make sure that we always predict from the set of all possible values.
In the case of HWQueueProphecy, we are always enqueueing values from the set {A,…,Z}, and so as long as we draw predictions from the set {A,…,Z}, we are guaranteed that the correct prediction is among the set we are predicting from.
2. Every HWQueueProphecybehaviorwith an incorrect prophecy must correspond to at least one HWQueue behavior
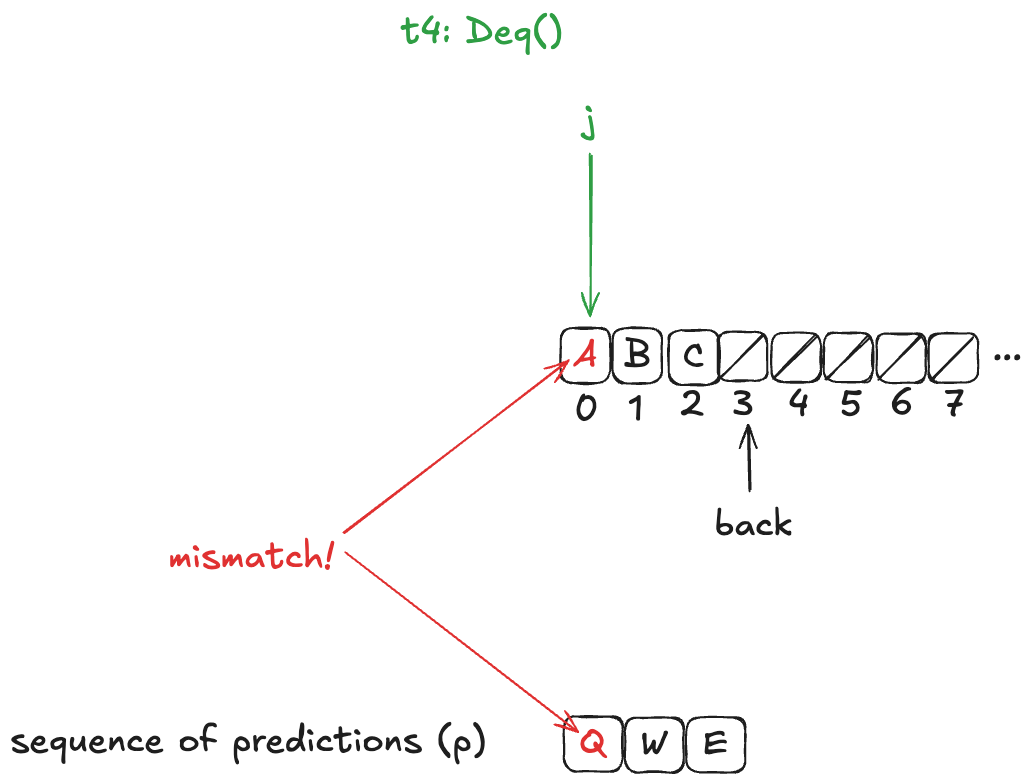
Most of the time, our predictions will be incorrect. We need to ensure that, when we prophesize incorrectly, the resulting behavior is still a valid HWQueue behavior, and is also still a valid LinearizableQueue behavior under refinement.
We do this by writing our HWQueueProphecy specification such that, if our prediction turns out to be incorrect (e.g., we predict A as the next value to be dequeued, and the next value that will actually be dequeued is B), we disallow the dequeue from happening.
In other words, we disallow state transitions that would violate our predictions.
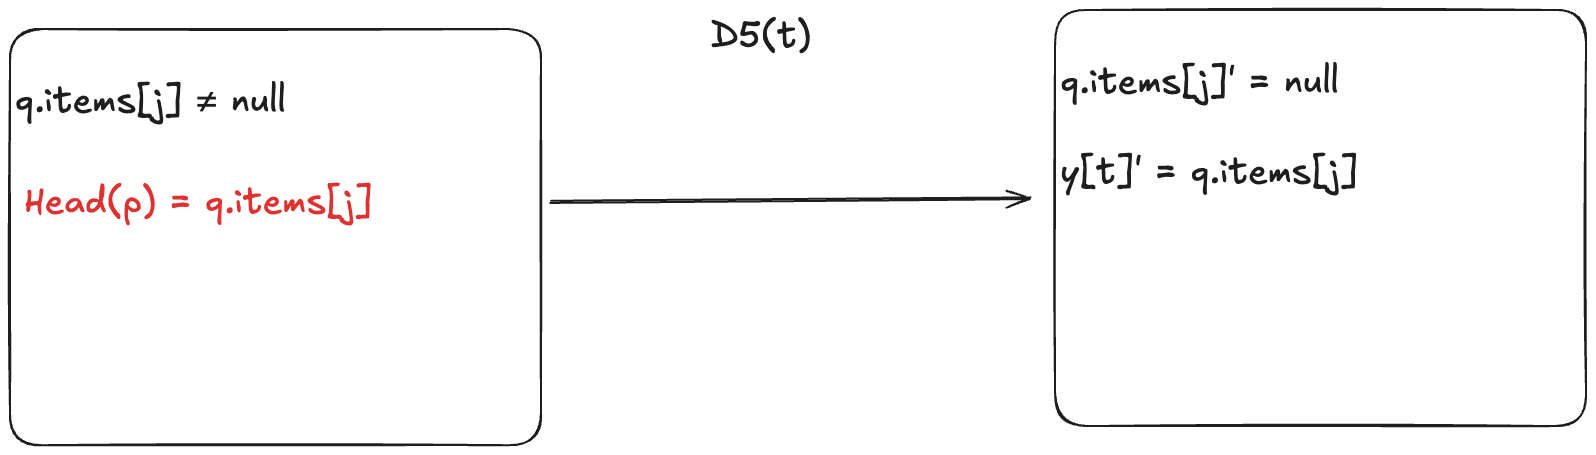
This means we add a new enabling condition to one of the dequeue actions. Now, for the dequeueing thread to remove the value from the array, it has to match the next value in the predicted sequence. In HWQueueProphecy, the name of the action that does this is D5, where t is id of the thread doing the dequeueing.
An incorrect prophecy blocks the dequeueing from actually happening. In the case of HWQueueProphecy, we can still enqueue values (since we don’t make any predictions on enqueue order, only dequeue order, so there’s nothing to block).
But let’s consider the more interesting case where an incorrect prophecy results in deadlock, where no actions are enabled anymore. This means that the only possible future steps in the behavior are stuttering steps, where the values never change.
When a prophecy is incorrect, it can result in deadlock, where all future steps are stuttering steps. These are still valid behaviors.
However, if we take a valid behavior of a specification, and we add stuttering steps, the resulting behavior is always also a valid behavior of the specification. So, the resulting behaviors are guaranteed to be in the set of valid HWQueue behaviors.
Using the prophecy to do the refinement mapping
Let’s review what we were trying to accomplish here. We want to figure out a refinement mapping from HWQueueProphecy to LinearizableQueue such that every state transition satisfies the LinearizableQueue specification.
Here’s an example, where the value B has been enqueued, the value A is in the process of being enqueued, and no values have been dequeued yet.
Defining how to do this mapping is not obvious, and I’m not going to explain it here, as it would take up way too much space, and this post is already much too long. Instead, I will defer interested readers to section 6.5 of Lamport’s book A Science of Concurrent Programs, which describes how to do the mapping. See also my POFifopq.tla spec, which is my complete implementation of his description.
But I do want to show you something about it.
Enqueue example
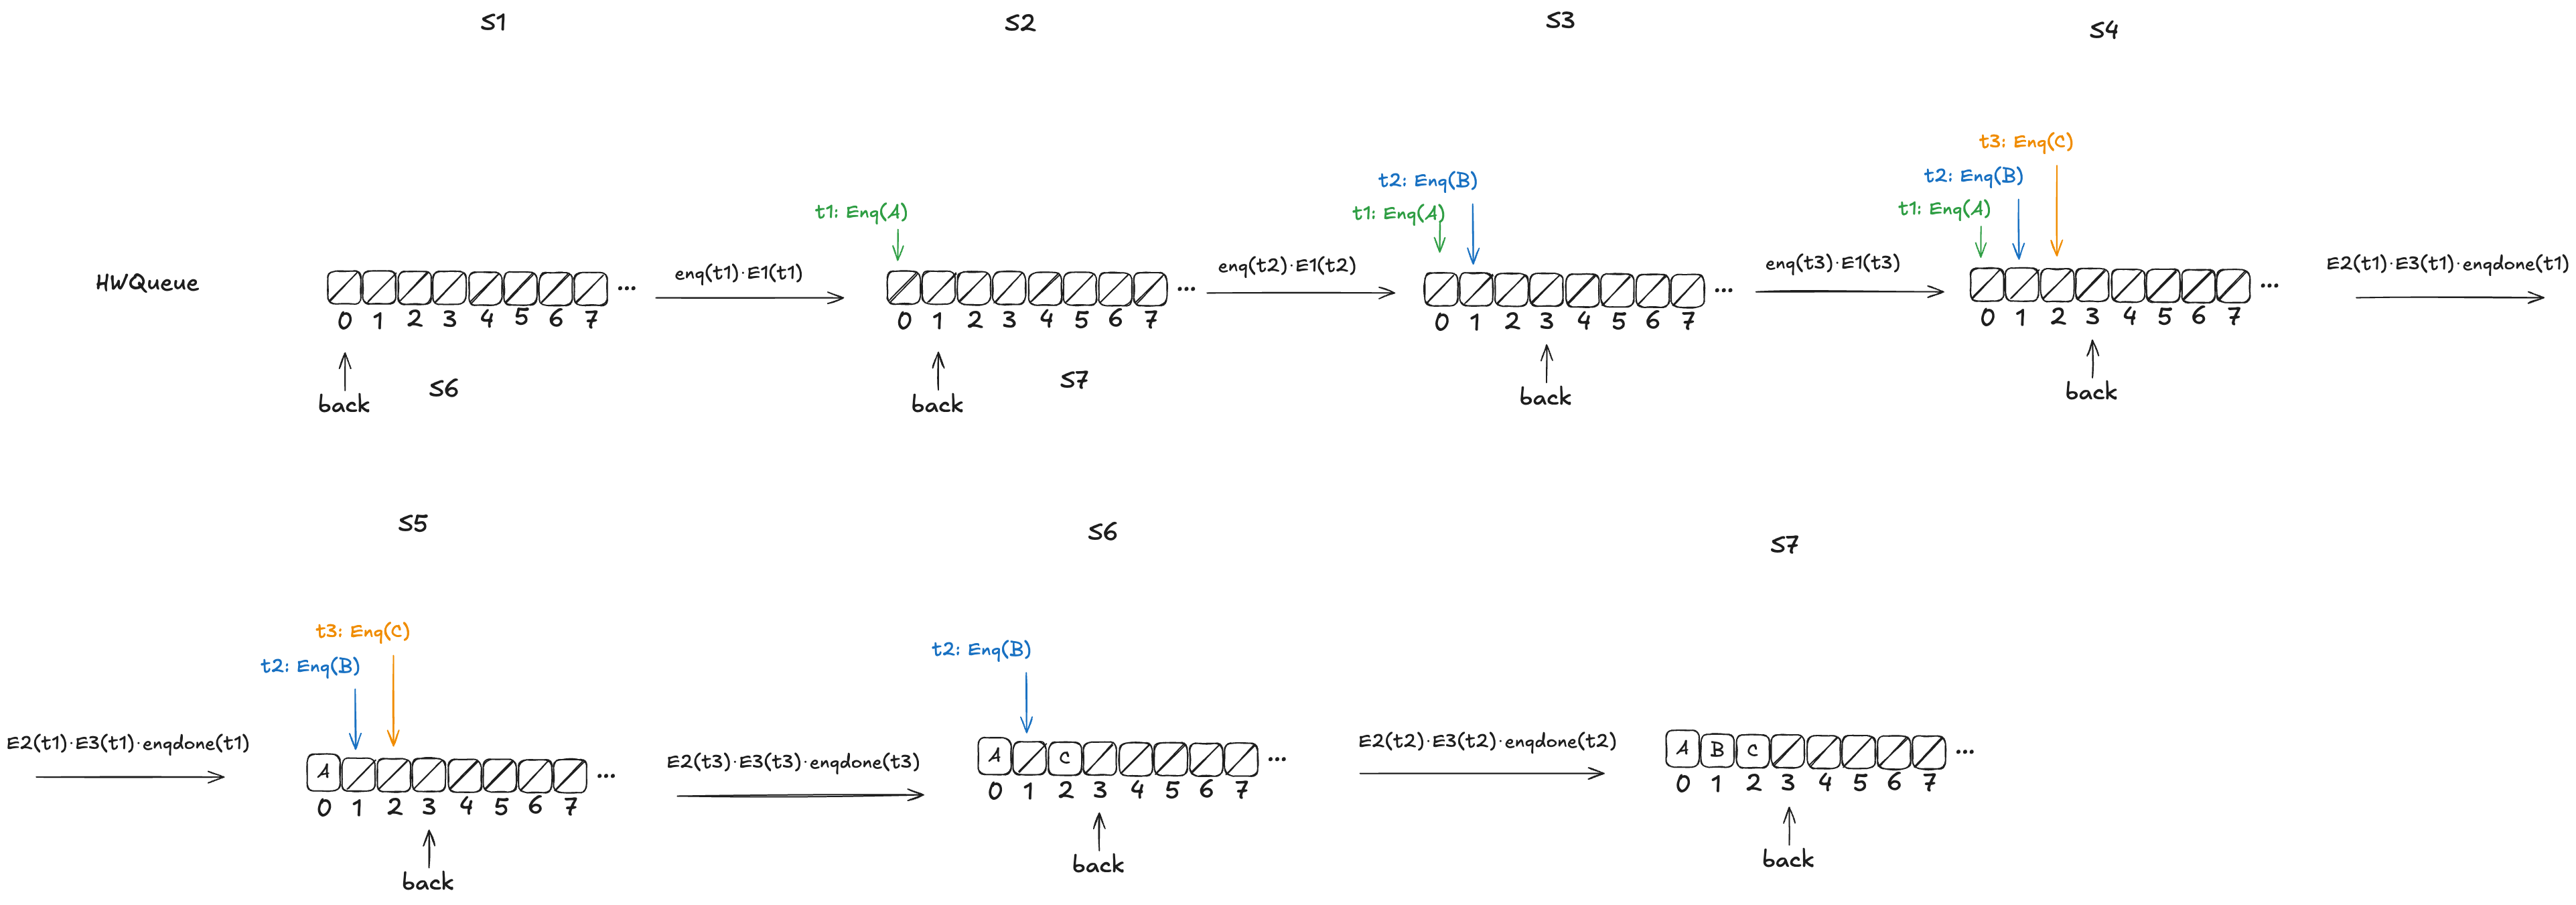
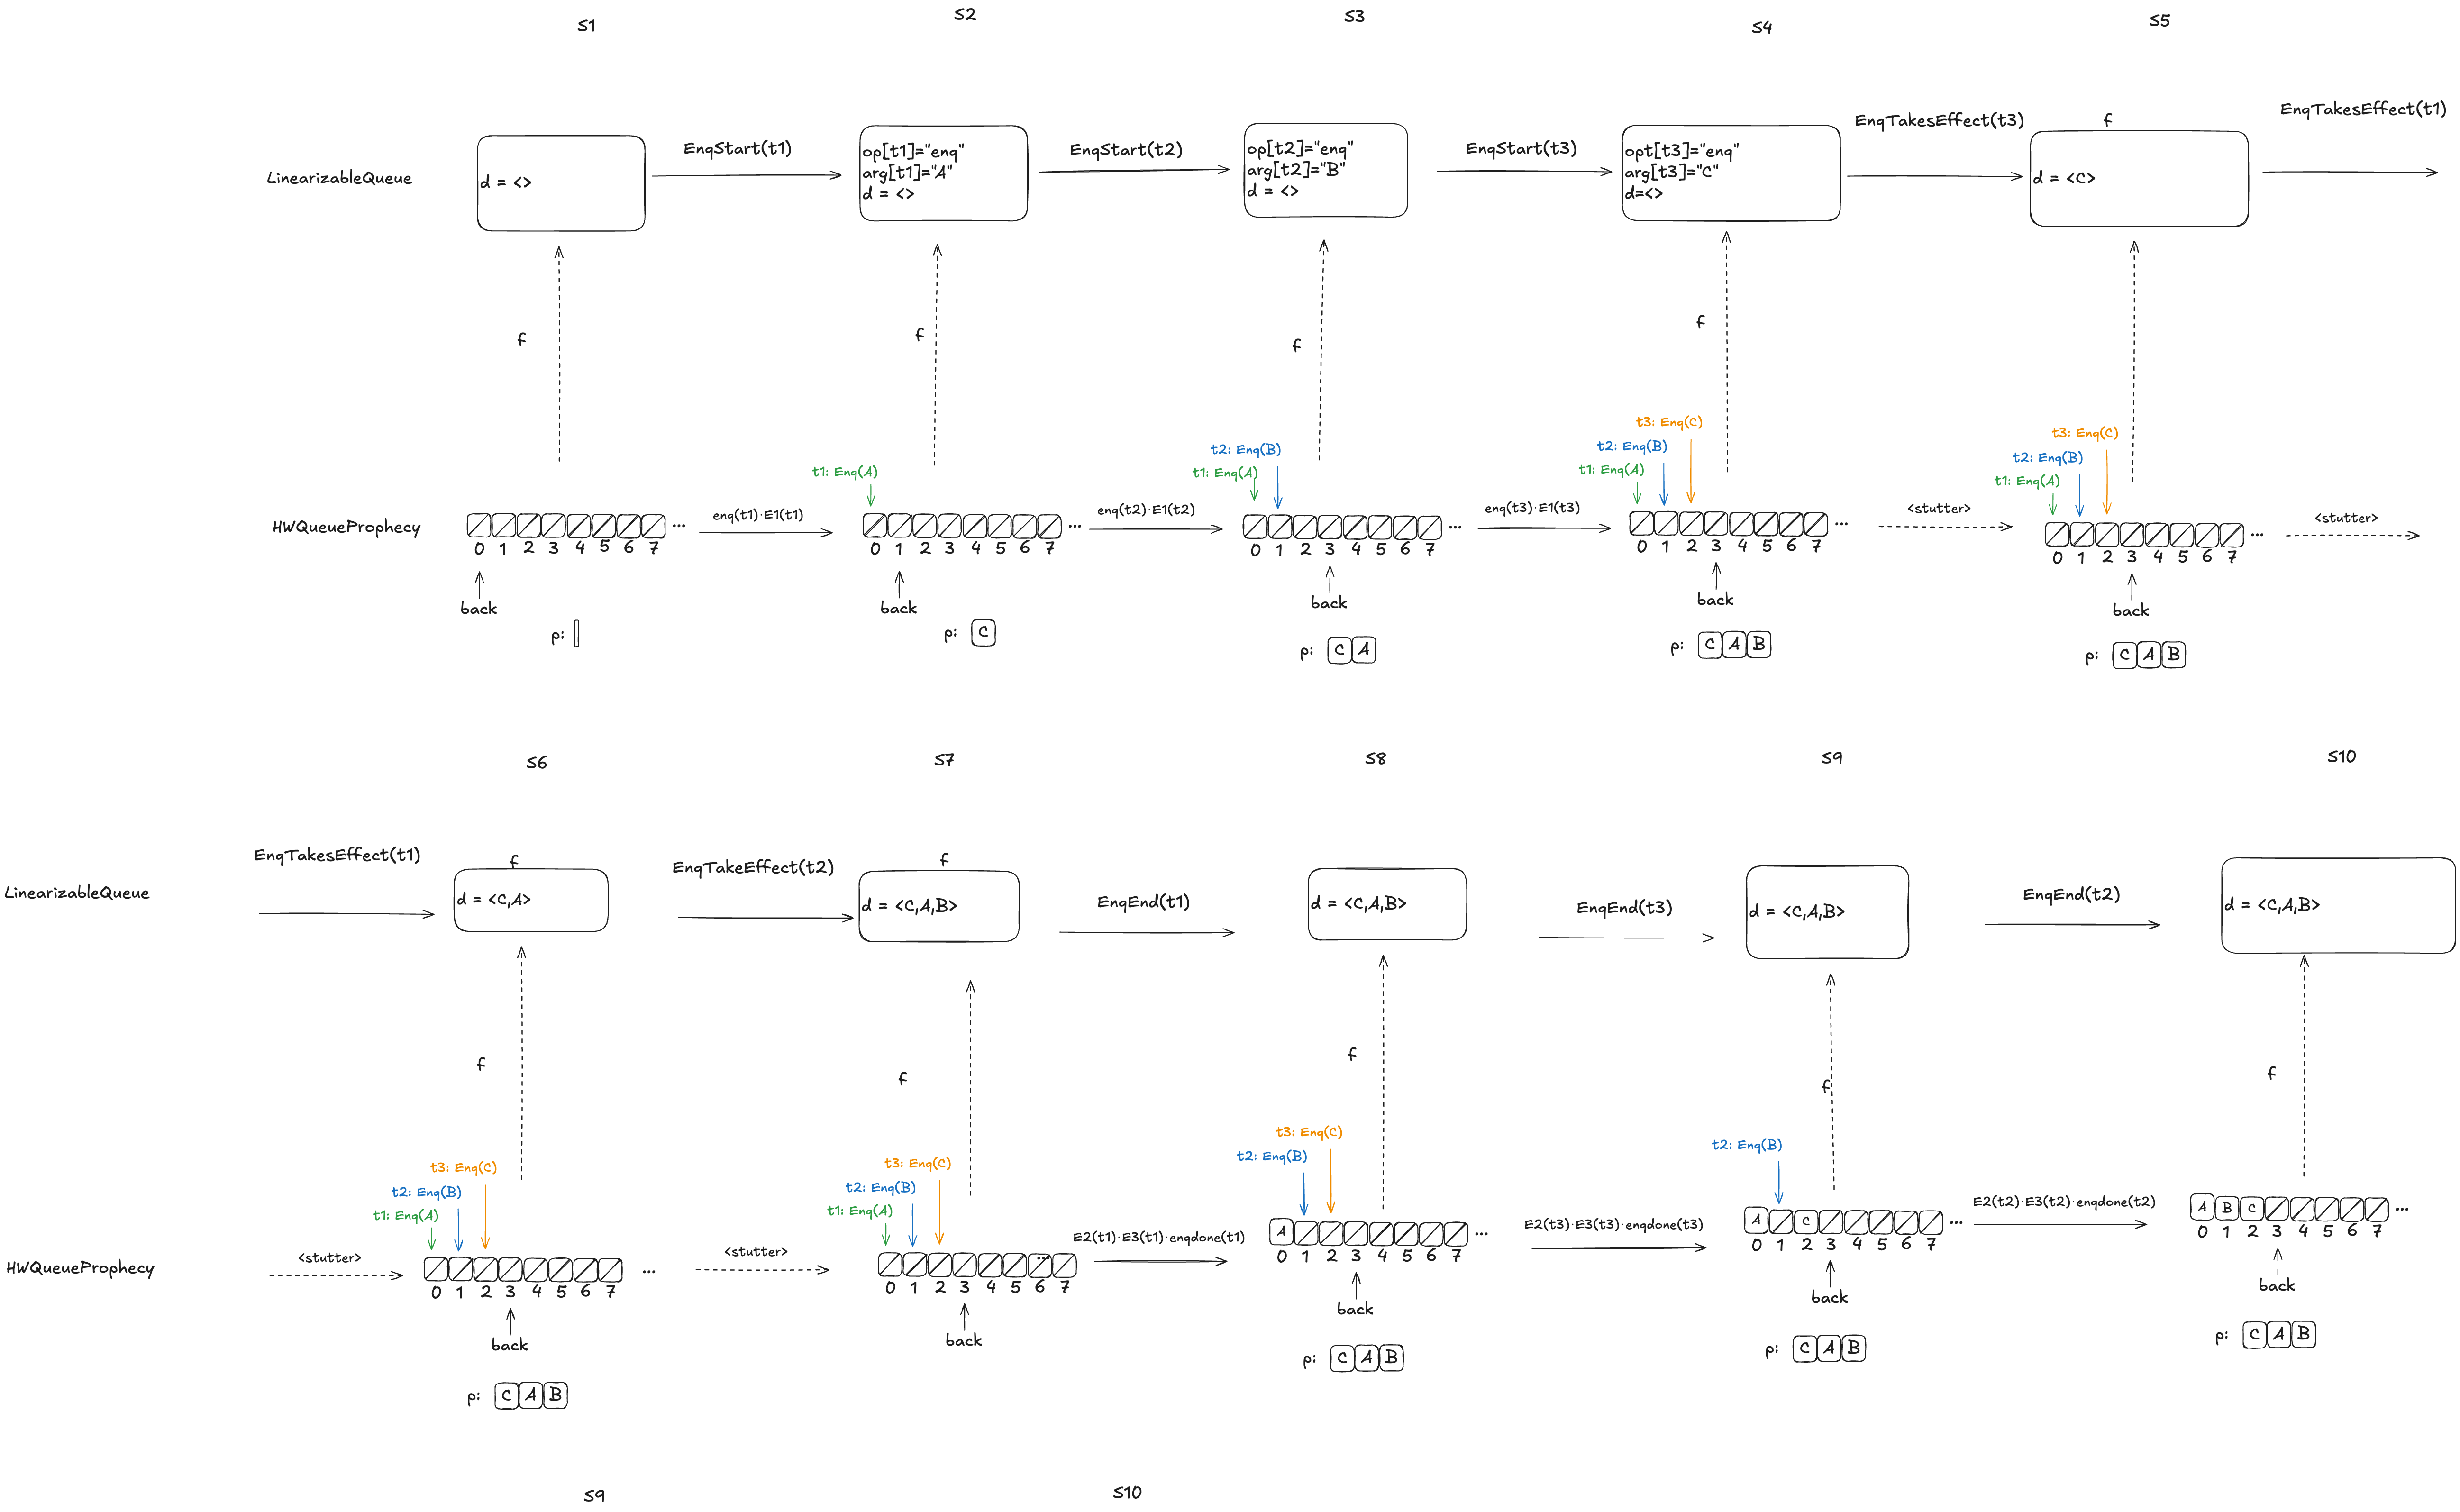
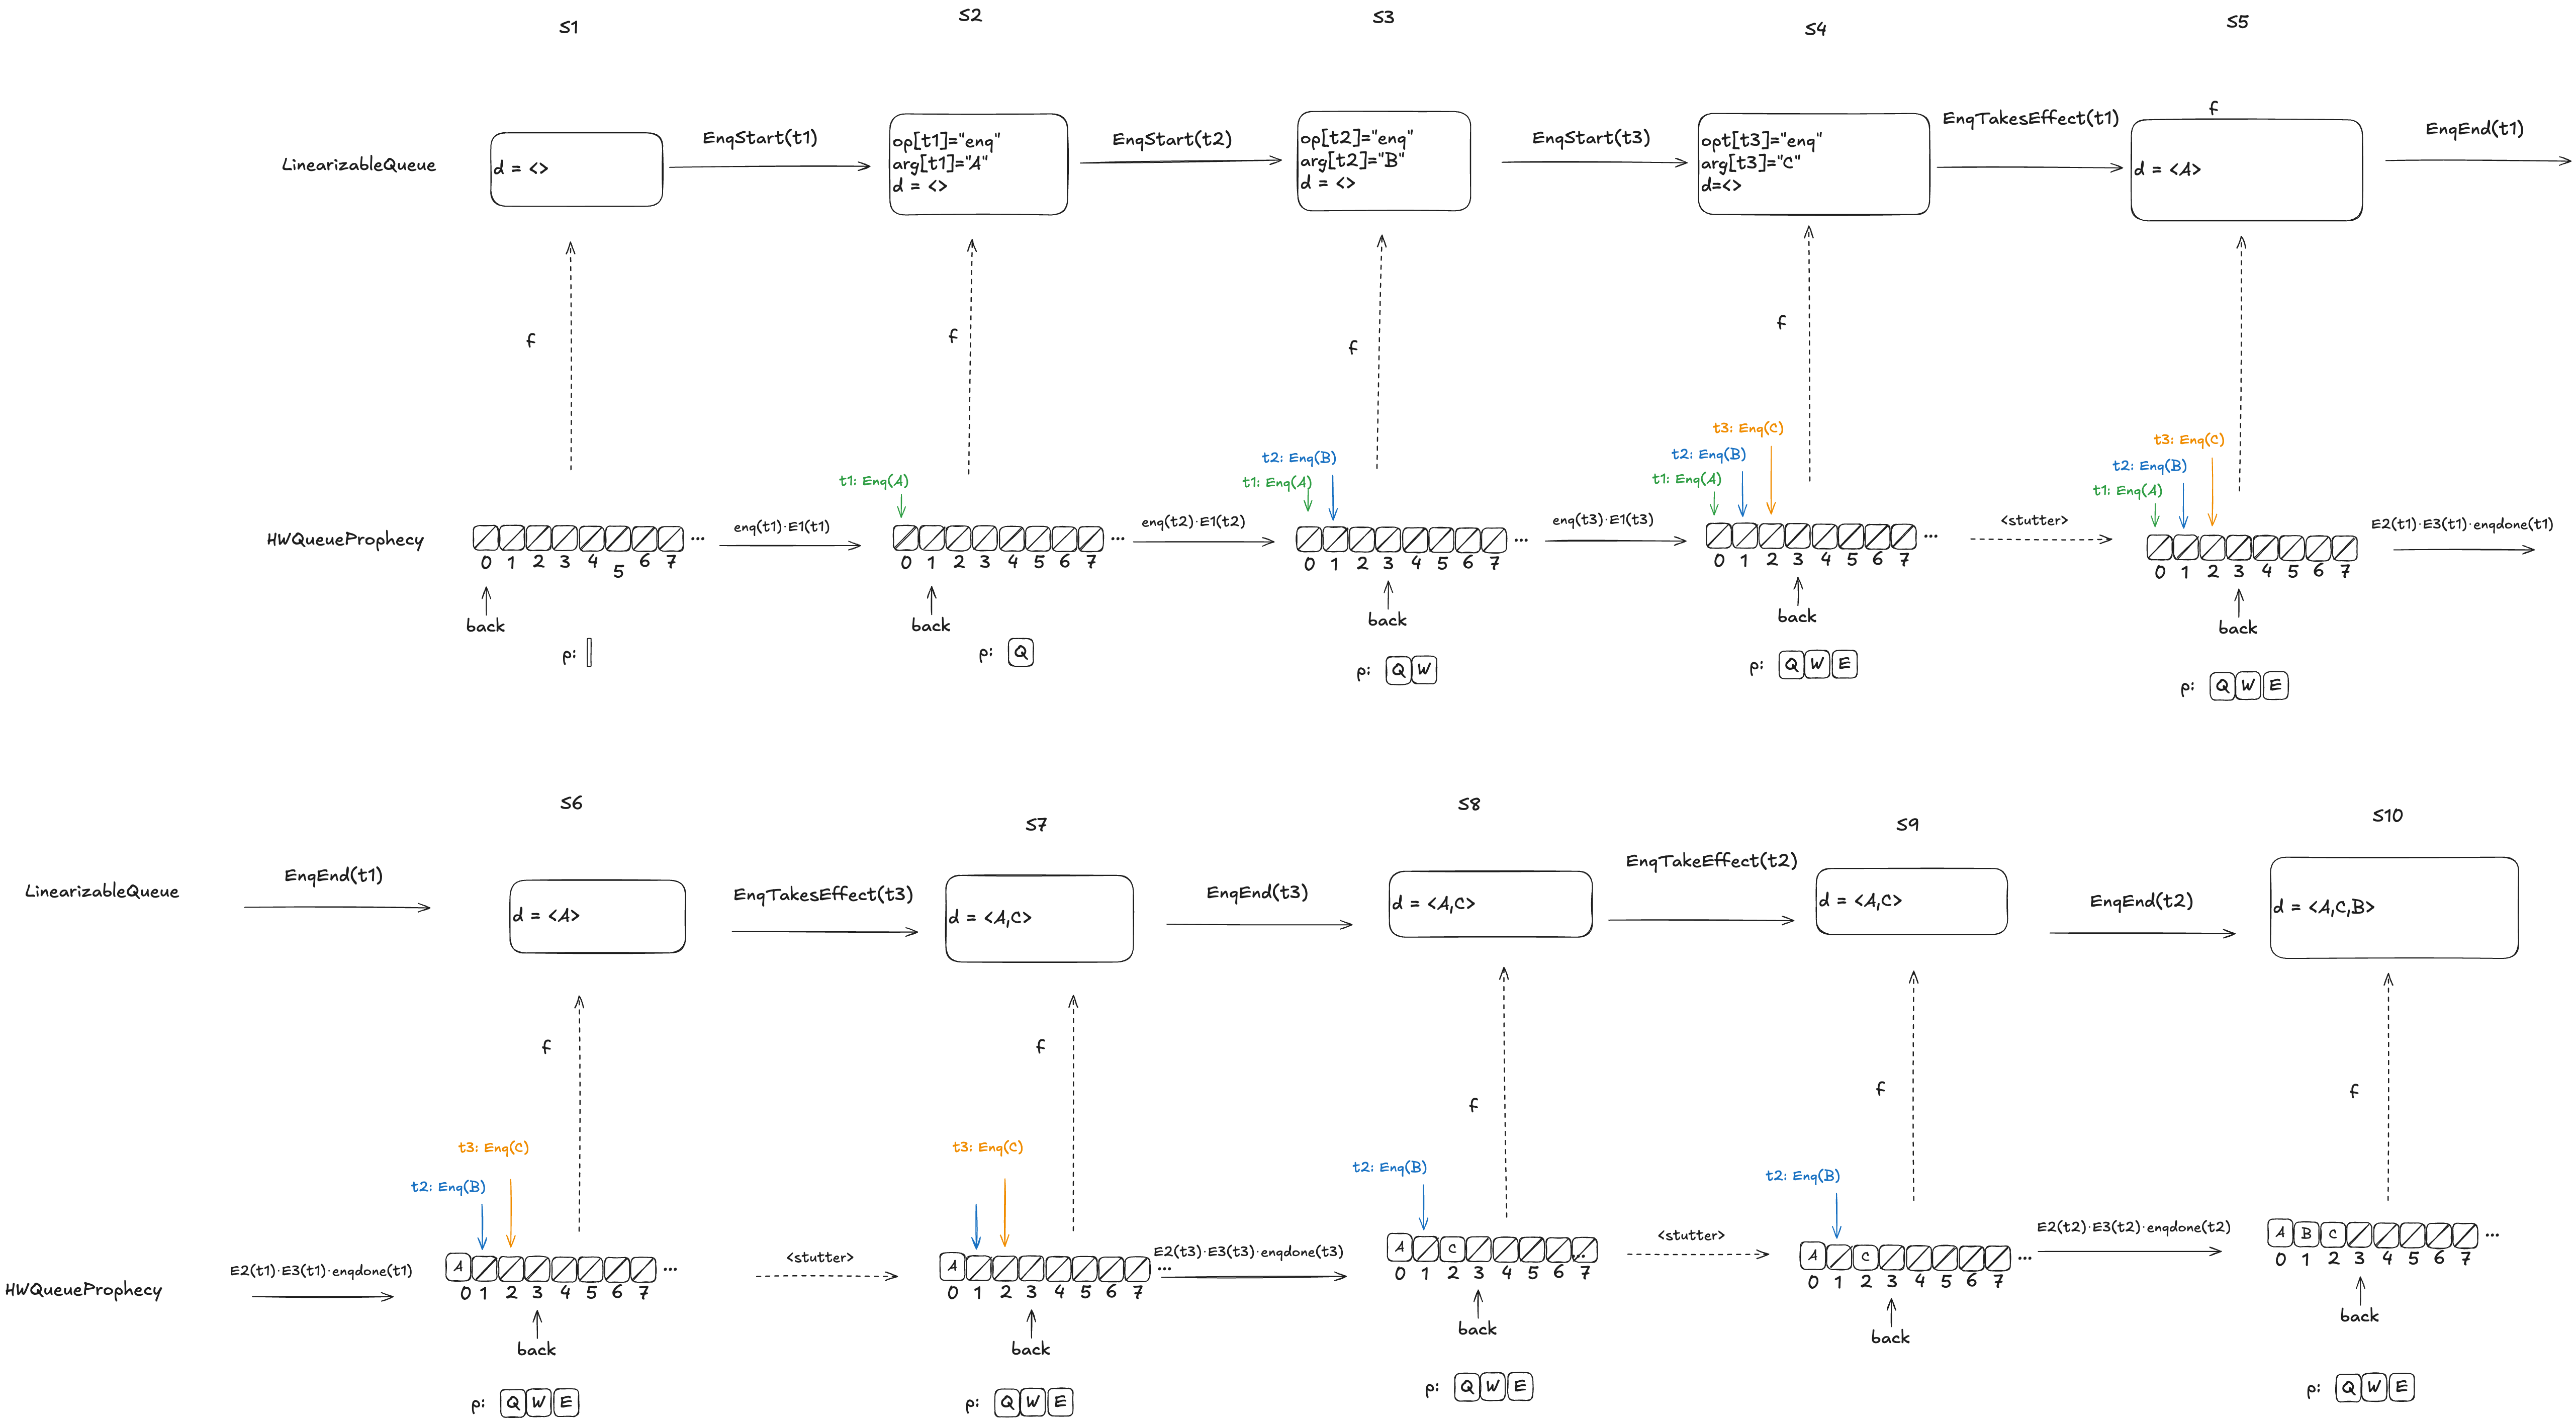
Let’s consider this HWQueue behavior, where we are concurrently enqueueing three values (A,B,C):
These enqueue operations all overlap each other, like this:
The refinement mapping will depend on the predictions.
Here’s an example where the predictions are consistent with the values being enqueued. Note how the state of the mapping ends up matching the predicted values.
Notice how in the final state (S10), the refinement mapping d=〈C,A,B〉is identical to the predicted dequeue ordering: p=〈C,A,B〉.
Here the predicted dequeue values p=〈Q,W,E〉can never be fulfilled, and the refinement mapping in this case, d=〈A,C,B〉matches the order in which overlapping enqueue operations complete.
The logic for determining the mapping varies depending on whether it is possible for the predictions to be fulfilled. For more details on this, see A Science of Concurrent Programs.
For the dequeueing case, if the value to be dequeued matches the first prediction in p, then we execute the dequeue and we remove the prediction from p. (We’ve already discussed the behavior if the value to be dequeued doesn’t match the prediction).
Coda
Phew! There was a lot of content in this post, including definitions and worked out examples. It took me a long time to grok a lot of this material, so I suspect that even an interested reader won’t fully absorb it on the first read. But if you got all of the way here, you’re probably interested enough in TLA+ that you’ll continue to read further on it. I personally find that it helps to have multiple explanations and examples, and I’ve tried to make an effort to present these concepts a little differently than other sources, so hopefully you’ll find it useful to come back here after reading elsewhere.
A Science of Concurrent Programs. Leslie Lamport. This is a self-published book on how to use TLA to model concurrent algorithms. This book documents how to use prophecy variables to implement the refinement mapping for the linearizable queue in the Herlihy and Wing paper.
Consistency Models. Linearizability is a consistency models, but there are multiple other ones. Kyle Kingsbury provides a good overview of the different models on his Jepsen site.
I’m sure you’ve heard the slogan “safety first”. It is a statement of values for an organization, but let’s think about how to define what it should mean explicitly. Here’s how I propose to define safety first, in the context of a company. I’ll assume the company is in the tech (software) industry, since that’s the one I know best. So, in this context, you can think of “safety” as being about avoiding system outages, rather than about, say, avoiding injuries on a work site.
Here we go:
A tech company is a safety first company if any engineer has the ability to extend a project deadline, provided that the engineer judges in the moment that they need additional time in order to accomplish the work more safely (e.g., by following an onerous procedure for making a change, or doing additional validation work that is particular time-intensive).
This ability to extend the deadline must be:
automatic
unquestioned
consequence-free
Automatic. The engineer does not to explicitly ask someone else for permission before extending the deadline.
Unquestioned. Nobody is permitted to ask the engineer “why did you extend the deadline?” after-the-fact.
Consequence-free. This action cannot be held against the engineer. For example, it cannot be a factor in a performance review.
Now, anyone who has worked in management would say to me, “Lorin, this is ridiculous. If you give people the ability to extend deadlines without consequence, then they’re just going to use this constantly, even if there isn’t any benefit to safety. It’s going to drastically harm the organization’s ability to actually get anything done”.
And, the truth is, they’re absolutely right. We all work under deadlines, and we all know that if there was a magical “extend deadline” button that anyone could press, that button would be pressed a lot, and not always for the purpose of improving safety. Organizations need to execute, and if anybody could introduce delays, this would cripple execution.
But this response is exactly the reason why safety first will always be a lie. Production pressure is an unavoidable reality for all organizations. Because of this, the system will always push back against delays, and that includes delays for the benefit of safety. This means engineers will always face double binds, where they will feel pressure to execute on schedule, but will be punished if they make decisions that facilitate execution but reduce safety.
Safety is never first in organization: it’s always one of a number of factors that trade off against each other. And those sorts of tradeoff decisions happen day-to-day and moment-to-moment.
Remember that the next time someone is criticized for “not being careful enough” after a change brings down production.
There’s a lot we simply don’t know about how reliability work was prioritized inside of CrowdStrike, but I’m going to propose a little thought experiment about the incident where I make some assumptions.
First, let’s assume that the CrowdStrike incident was the first time they had an incident that was triggered by a Rapid Response Content update, which is a config update. We’ll assume that previous sensor issues that led to Linux crashes were related to a sensor release, which is a code update.
Next, let’s assume that CrowdStrike focuses their reliability work on addressing the identified root cause of previous incidents.
Finally, let’s assume that none of the mitigations documented in their RCA were identified as action items that addressed the root cause of any incidents they experienced before this big one.
If these three assumptions are true, then it explains why these mitigations weren’t done previously. Because they didn’t address the root causes of previous incidents, and they focus their post-incident work on identifying the root cause of previous incidents. Now, I have no idea if any of these assumptions are actually true, but they sound plausible enough for this thought experiment to hold.
This thought experiment demonstrates the danger of focusing post-incident work on addressing the root causes of previous incidents: it acts to obscure other risks in the system that don’t happen to fit into the root cause analysis. After all, issues around validation of the channel files or staging of deploys were not really the root cause of any of the incidents before this one. The risks that are still in your system don’t care about what you have labeled “the real root cause” of the previous incident, and there’s no reason to believe that whatever gets this label is the thing that is most likely to bite you in the future.
I propose (cheekily) to refer to the prioritize-identifying-and-addressing-the-root-cause–of-previous-incidents thinking as the “CrowdStrike” approach to reliability work.
I put “CrowdStrike” in quotes because, in a sense, this really isn’t about them at all: I have no idea if the assumptions in this thought experiment are true. But my motivation for using this phrase is more about using CrowdStrike as a symbol that’s become salient to our industry then about the particular details of that company.
Are you on the lookout for the many different signals of risk in your system, or are you taking the “CrowdStrike” approach to reliability work?
CrowdStrike has released their final (sigh) External Root Cause Analysis doc. The writeup contains some more data on the specific failure mode. I’m not going to summarize it here, mostly because I don’t think I’d add any value in doing so: my knowledge of this system is no better than anyone else reading the report. I must admit, though, that I couldn’t helping thinking of number eleven in Alan Perlis’s epigrams in programming.
If you have a procedure with ten parameters, you probably missed some.
What I wanted to do instead with this blog is call out the last two of the “findings and mitigations” in the doc:
Template Instance validation should expand to include testing within the Content Interpreter
Template Instances should have staged deployment
This echos the chorus of responses I heard online in the aftermath of the outage. “Why didn’t they test these configs before deployment? How could they not stage their deploys?”
And this is my biggest disappointment with this writeup: it doesn’t provide us with insight into how the system got to this point.
Here are the types of questions I like to ask to try to get at this.
Had a rapid response content update ever triggered a crash before in the history of the company? If not, why do you think this type of failure (crash related to rapid response content) has never bitten the company before?If so, what happened last time?
Was there something novel about the IPC template type? (e.g., was this the first time the reading of one field was controlled by the value of another?)
How is generation of the test template instances typically done? Was the test template instance generation here a typical case or an exceptional one? If exceptional, what was different? If typical, how come it has never led to problems before?
Before the incident, had customers ever asked for the ability to do staged rollouts? If so, how was that ask prioritized relative to other work?
Was there any planned work to improve reliabilitybeforethe incident happened?What type of work was planned? How far along was it? How did you prioritize this work?
I know I’m a broken record here, but I’ll say it again. Systems reach the current state that they’re in because, in the past, people within the system made rational decisions based on the information they had at the time, and the constraints that they were operating under. The only way to understand how incidents happen is to try and reconstruct the path that the system took to get here, and that means trying to as best as you can to recreate the context that people were operating under when they made those decisions.
In particular, availability work tends to go to the areas where there was previously evidence of problems. That tends to be where I try to pick at things. Did we see problems in this area before? If we never had problems in this area before, what was different this time?
If we did see problems in the past, and those problems weren’t addressed, then that leads to a different set of questions. There are always more problems than resources, which means that orgs have to figure out what they’re going to prioritize (say “quarterly planning” to any software engineer and watch the light fade from their eyes). How does prioritization happen at the org?
It’s too much to hope for a public writeup to ever give that sort of insight, but I was hoping for something more about the story of “How we got here” in their final writeup. Unfortunately, it looks like this is all we get.
One of the workhorses of the modern software world is the key-value store. there are key-value services such as Redis or Dynamo, and some languages build key-value data structures right in to the language (examples include Go, Python and Clojure). Even relational databases, which are not themselves key-value stores, are frequently built on top of a data structure that exposes a key-value interface.
Key-value data structures are often referred to as maps or dictionaries, but here I want to call attention to the less-frequently-used term associative array. This term evokes the associative nature of the store: the value that we store is associated with the key.
When I work on an incident writeup, I try to capture details and links to the various artifacts that the incident responders used in order to diagnose and mitigate the incident. Examples of such details include:
dashboards (with screenshots that illustrate the problem and links to the dashboard)
names of feature flags that were used or considered for remediation
relevant Slack channels where there was coordination (other than the incident channel)
Why bother with these details? I see it as a strategy to tackle the problem that Woods and Cook refer to in Perspectives on Human Error: Hindsight Biases and Local Rationality as the problem of inert knowledge. There may be information about that we learned at some point, but we can’t bring it to bear when an incident is happening. However, we humans are good at remembering other incidents! And so, my hope is that when an operational surprise happens, someone will remember “Oh yeah, I remember reading about something like this when incident XYZ happened”, and then they can go look up the incident writeup to incident XYZ and see the details that they need to help them respond.
In other words, the previous incidents act as keys, and the content of the incident write-ups act as the value. If you make the incident write-ups memorable, then people may just remember enough about them to look up the write-ups and page in details about the relevant tools right when they need them.
Below is a screenshot of Vizceral, a tool that was built by a former teammate of mine at Netflix. It provides a visualization of the interactions between the various microservices.
Vizceral uses moving dots to depict how requests are currently flowing through the Netflix microservice architecture. Vizceral is able to do its thing because of the platform tooling, which provides support for generating a visualization like this by exporting a standard set of inter-process communication (IPC) metrics.
What you don’t see depicted here are the interactions between those microservices and the telemetry platform that ingest these metrics. There’s also logging and tracing data, and those get shipped off-box via different channels, but none of those channels show up in this diagram.
In fact, this visualization doesn’t represent interactions with any of the platform services. You won’t see bubbles that represent the compute platform or the CI/CD platform represented in a diagram like this, even though those platform services all interact with these application services in important ways.
I call the first category of interactions, the ones between the application services, as first-class, and the second category, the ones where the interactions involve platform services, as second-class. It’s those second-class interactions that I want to say more about.
These second-class interactions tend to have a large blast radius, because successful platforms by their nature have a large blast radius. There’s a reason why there’s so much havoc out in the world when AWS’s us-east-1 region has a problem: because so many services out there are using us-east-1 as a platform. Similarly, if you have a successful platform within your organization, then by definition it’s going to see a lot of use, which means that if it experiences a problem, it can do a lot of damage.
These platforms are generally more reliable than the applications that run atop them, because they have to be: platforms naturally have higher reliability requirements than the applications that run atop them. They have these requirements because they have a large blast radius. A flaky platform is a platform that contributes to multiple high-severity outages, and systems that contribute to multiple high-severity outages are the systems were reliability work gets prioritized.
And a reliable system is a system whose details you aren’t aware of, because you don’t need to be. If my car is very reliable, then I’m not going to build an accurate mental model of how my car works, because I don’t need to: it just works. In her book Human-Machine Reconfigurations: Plans and Situated Actions, the anthropologist Lucy Suchman used the term representation to describe the activity of explicitly constructing a mental model of how a piece of technology works, and she noted that this type of cognitive work only happens when we run into trouble. As Suchman puts it:
[R]epresentation occurs when otherwise transparent activity becomes in some way problematic
Hence the irony: these second-class interactions tend not to be represented in our system models when we talk about reliability, because they are generally not problematic.
And so we are lulled into a false sense of security. We don’t think about how the plumbing works, because the plumbing just works. Until the plumbing breaks. And then we’re in big trouble.