Here’s a question that all of us software developers face: How can we best use our knowledge about the past behavior of our system to figure out where we should be investing our time?
One approach is to use a technique from the SRE world called error budgets. Here are a few quotes from the How to Use Error Budgets chapter of Alex Hidalgo’s book: Implementing Service Level Objectives:
Measuring error budgets over time can give you great insight into the risk factors that impact your service, both in terms of frequency and severity. By knowing what kinds of events and failures are bad enough to burn your error budget, even if just momentarily, you can better discover what factors cause you the most problems over time. p71 [emphasis mine]
The basic idea is straightforward. If you have error budget remaining, ship new features and push to production as often as you’d like; once you run out of it, stop pushing feature changes and focus on relaiability instead. p87
Error budgets give you ways to make decisions about your service, be it a single microservice or your company’s entire customer-facing product. They also give you indicators that tell you when you can ship features, what your focus should be, when you can experiment, and what your biggest risk factors are. p92
The goal is not to only react when your users are extremely unhappy with you—it’s to have better data to discuss where work regarding your service should be moving next. p354
That sounds reasonable, doesn’t it? Look at what’s causing your system to break, and if it’s breaking too often, use that as a signal to address those issues that are breaking it. If you’ve been doing really well reliability-wise, an error budget gives you margin to do some riskier experimentation in production like chaos engineering or production load testing.
I have two issues with this approach, a smaller one and a larger one. I’ll start with the smaller one.
First, I think that if you work on a team where the developers operate their own code (you-build-it, you-run-it), and where the developers have enough autonomy to say, “We need to focus more development effort on increasing robustness”, then you don’t need the error budget approach to help you decide when and where to spend your engineering effort. The engineers will know where the recurring problems are because they feel the operational pain, and they will be able to advocate for addressing those pain points. This is the kind of environment that I am fortunate enough to work in.
I understand that there are environments where the developers and the operators are separate populations, or the developers aren’t granted enough autonomy to be able to influence where engineering time is spent, and that in those environments, an error budget approach would help. But I don’t swim in those waters, so I won’t say any more about those contexts.
To explain my second concern, I need to digress a little bit to talk about Herbert Heinrich.
Herbert Heinrich worked for the Travelers Insurance Company in the first half of the twentieth century. In the 1920s, he did a study of workplace accidents, examining thousands of claims made by companies that held insurance policies with Travelers. In 1931, he published his findings in a book: Industrial Accident Prevention: A Scientific Approach.
Heinrich’s work showed a relationship between the rates of near misses (no injury), minor injuries, and major injuries. Specifically: for every major injury, there are 29 minor injuries, and 300 no-injury accidents. This finding of 1:29:300 became known as the accident triangle.
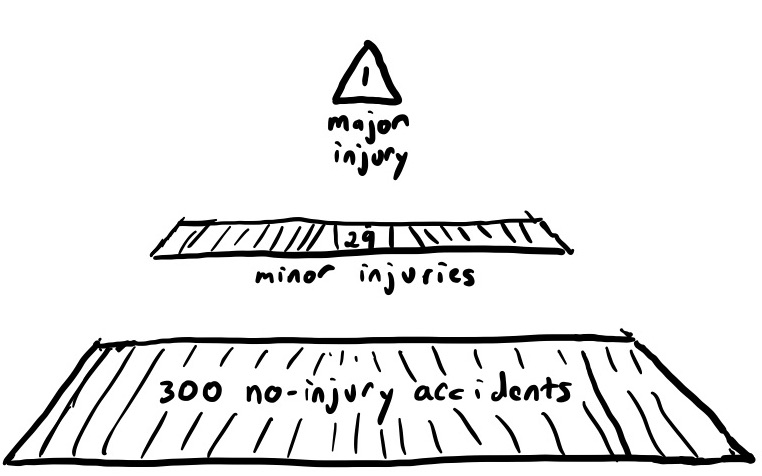
One implication of the accident triangle is that the rate of minor issues gives us insight into the rate of major issues. In particular, if we reduce the rate of minor issues, we reduce the risk of major ones. Or, as Heinrich put it: Moral—prevent the accidents and the injuries will take care of themselves.
Heinrich’s work has since been criticized, and subsequent research has contradicted Heinrich’s findings. I won’t repeat the criticisms here (see Foundations of Safety Science by Sidney Dekker for details), but I will cite counterexamples mentioned in Dekker’s book:
The Deepwater Horizon offshore drilling rig saw six years of injury-free and incident-free performance before the explosion in 2010. (It even won a SAFE award from the U.S. Minerals Management Service in 2008 for its perfect safety record!)
Arnold Barnett and Alexander Wang found a negative correlation between nonfatal accident/incident rates and passenger-mortality risk among air carriers. That is, carriers that had more non-fatal incidents had a lower risk of fatalities. (Passenger-mortality Risk Estimates Provide Perspectives About Airline Safety, Flight Safety Digest, April 2000).
Antti Saloniemi and Hanna Oksanen found a negative correlation between incident rate and fatalities in the construction industry in Finland (Accidents and fatal accidents—some paradoxes, Safety Science, Volume 29, Issue 1, June 1998).
Fred Sherratt and Andrew Dainty found that construction companies in the UK that had an explicit policy of zero accidents saw more major injuries and fatal accidents than companies that did not have a zero accident policy (UK construction safety: a zero paradox?, Policy and Practice in Health and Safety, Volume 15, Issue 2, 2017).
So, what does any of this have to do with error budgets? At a glance, error budgets don’t seem related to Heinrich’s work at all. Heinrich was focused on safety, where the goal is to reduce injuries as much as possible, in some cases explicitly having a zero goal. Error budgets are explicitly not about achieving zero downtime (100% reliability), they’re about achieving a target that’s below 100%.
Here are the claims I’m going to make:
- Large incidents are much more costly to organizations than small ones, so we should work to reduce the risk of large incidents.
- Error budgets don’t help reduce risk of large incidents.
Here’s Heinrich’s triangle redrawn:
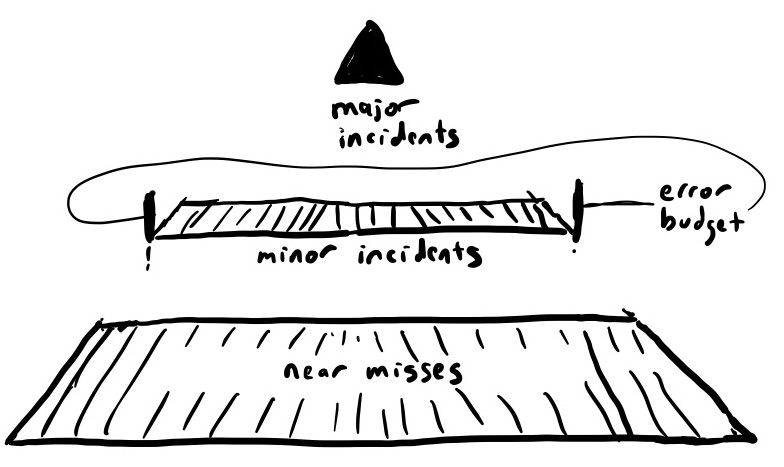
An error-budget-based approach only provides information on the nature of minor incidents, because those are the ones that happen most often. Near misses don’t impact the reliability metrics, and major incidents blow them out of the water.
Heinrich’s work assumed a fixed ratio between minor accidents and major ones: reduce the rate of minor accidents and you’d reduce the rate of major ones. By focusing on reliability metrics as a primary signal for providing insight into system risk, you only get information about these minor incidents. But, if there’s no relationship between minor incidents and major ones, then maintaining a specific reliability level doesn’t address the issues around major incidents at all.
An error-budget-based approach to reliability implicitly assumes there is a connection between reliability metrics and the risk of a large incident. This is the thread that connects to Heinrich: the unstated idea that doing the robustness work to address the problems exposed by the smaller incidents will decrease the risk of the larger incidents.
In general, I’m skeptical about relying on predefined metrics, such as reliability, for getting insight into the risks of the system that could lead to big incidents. Instead, I prefer to focus on signals, which are not predefined metrics but rather some kind of information that has caught your attention that suggests that there’s some aspect of your system that you should dig into a little more. Maybe it’s a near-miss situation where there was no customer impact at all, or maybe it was an offhand remark made by someone in Slack. Signals by themselves don’t provide enough information to tell you where unseen risks are. Instead, they act as clues that can help you figure out where to dig to get more details. This is what the Learning from Incidents in Software movement is about.
I’m generally skeptical of metrics-based approaches, like error budgets, because they reify. The things that get measured are the things that get attention. I prefer to rely on qualitative approaches that leverage the experiment judgment of engineers. The challenge with qualitative approaches is that you need to expose the experts to the information they need (e.g., putting the software engineers on-call), and they need the space to dig into signals (e.g., allow time for incident analysis).

