Scott Nasello recently introduced me to Dr. Hannah Harvey’s The Art of Storytelling. I’m about halfway through her course, and I absolutely love it, and I keep thinking about it in the context of learning from incidents. While I have long been an advocate of using narrative structure when writing up incidents, Harvey’s course focuses on oral storytelling, which is a very different sort of format.
In this context, I was thinking about an operational surprise that happened on my team a few months ago, so that I could use it as raw material to construct an oral story about it. But, as I reflected on it, and read my own (lengthy) writeup, I realized that there was one thing I didn’t fully understand about what happened.
During the operational surprise, when we attempted to remediate the problem by deploying a potential fix into production, we hit a latent bug that had been merged into the main branch ten days earlier. As i was re-reading the writeup, there was something I didn’t understand. How did it come to be that we went ten days without promoting that code from the main branch of our repo to the production environment?
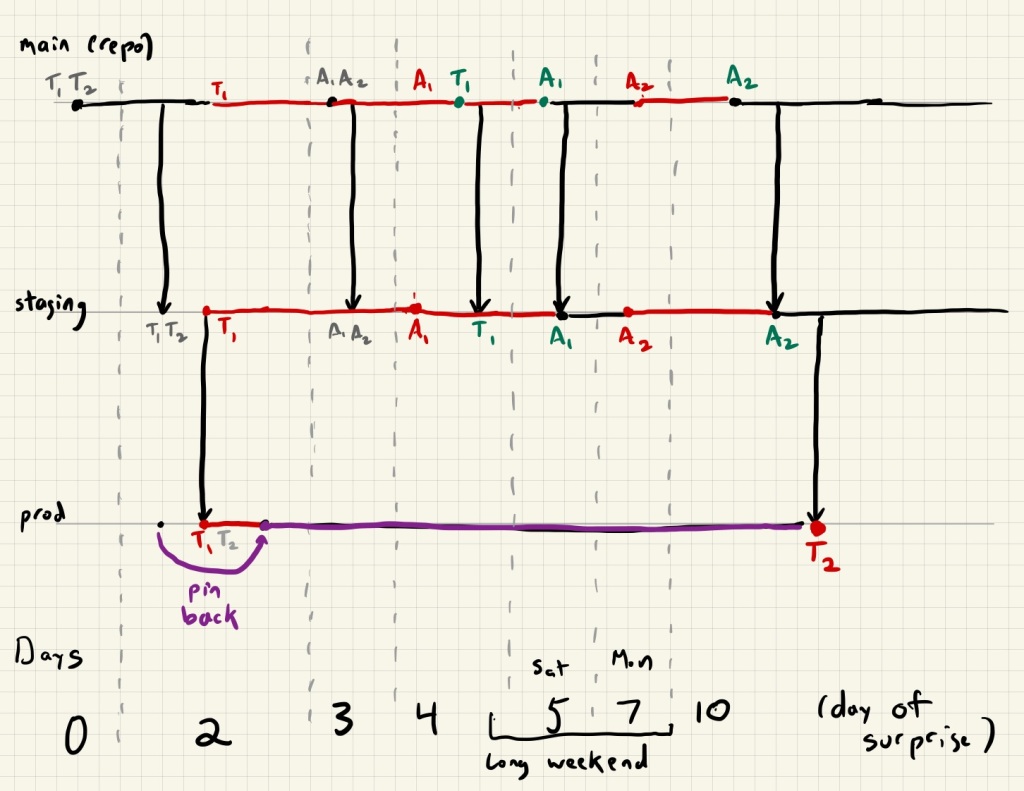
To help me make sense of what happened, I drew a diagram of the development events that lead up to the surprise. Fortunately, I had documented those events thoroughly in the original writeup. Here’s the diagram I created. I used this diagram to get some insight into how bug T2, which was merged into our repo on day 0, did not manifest in production until day 10.
This diagram will take some explanation, so bear with me.

There are four bugs in this story, denoted T1,T2, A1, A2. The letters indicate the functionality associated with the PR that introduced them:
- T1, T2 were both introduced in a pull request (PR) related to refactoring of some functionality related to how our service interacts with Titus.
- A1, A2 were both introduced in a PR related to adding functionality around artifact metadata.
Note that bug T1 masked T2, and bug A1 masked A2.
There are three vertical lines, which show how the bugs propagated to different environments.
- main (repo) represents code in the main branch of our repository.
- staging represents code that has been deployed to our staging environment.
- prod represents code that has been deployed to our production environment.
Here’s how the colors work:
- gray indicates that the bug is present in an environment, but hasn’t been detected
- red indicates that the effect of a bug has been observed in an environment. Note that if we detect a bug in the prod environment, that also tells us that the bug is in staging and the repo.
- green indicates the bug has been fixed
If a horizontal line is red, that means there’s a known bug in that environment. For example, when we detect bug T1 in prod on day 1, all three lines go red, since we know we have a bug.
A horizontal line that is purple means that we’ve pinned to a specific version. We unpinned prod on day 10 before we deployed.
The thing I want to call out in this diagram is the color in the staging line. once the staging line turns red on day 2, it only turns black on day 5, which is the Saturday of a long weekend, and then turns red again on the Monday of the long weekend. (Yes, some people were doing development on the Saturday and testing in staging on Monday, even though it was a long weekend. We don’t commonly work on weekends, that’s a different part of the story).
During this ten day period, there was only a brief time when staging was in a state we thought was good, and that was over a weekend. Since we don’t deploy on weekends unless prod is in a bad state, it makes sense that we never deployed from staging to prod until day 10.
The larger point I want to make here is that getting this type of insight from an operational surprise is hard, in the sense that it takes a lot of effort. Even though I put in the initial effort to capture the development activity leading up to the surprise when I first did the writeup, I didn’t gain the above insight until months later, when I tried to understand this particular aspect of it. I had to ask a certain question (how did that bug stay latent for so long), and then I had to take the raw materials of the writeup that I did, and then do some diagramming to visualize the pattern of activity so I could understand it. In retrospect, it was worth it. I got a lot more insight here than: “root cause: latent bug”.
Now I just need to figure out how to tell this as a story without the benefit of a diagram.
One thought on “Making sense of what happened is hard”