A few weeks ago, I decided to estimate 90% confidence intervals for each day that I worked on developing a feature.
Here are some results over 10 days from when I started estimating until when the feature was deployed into production.
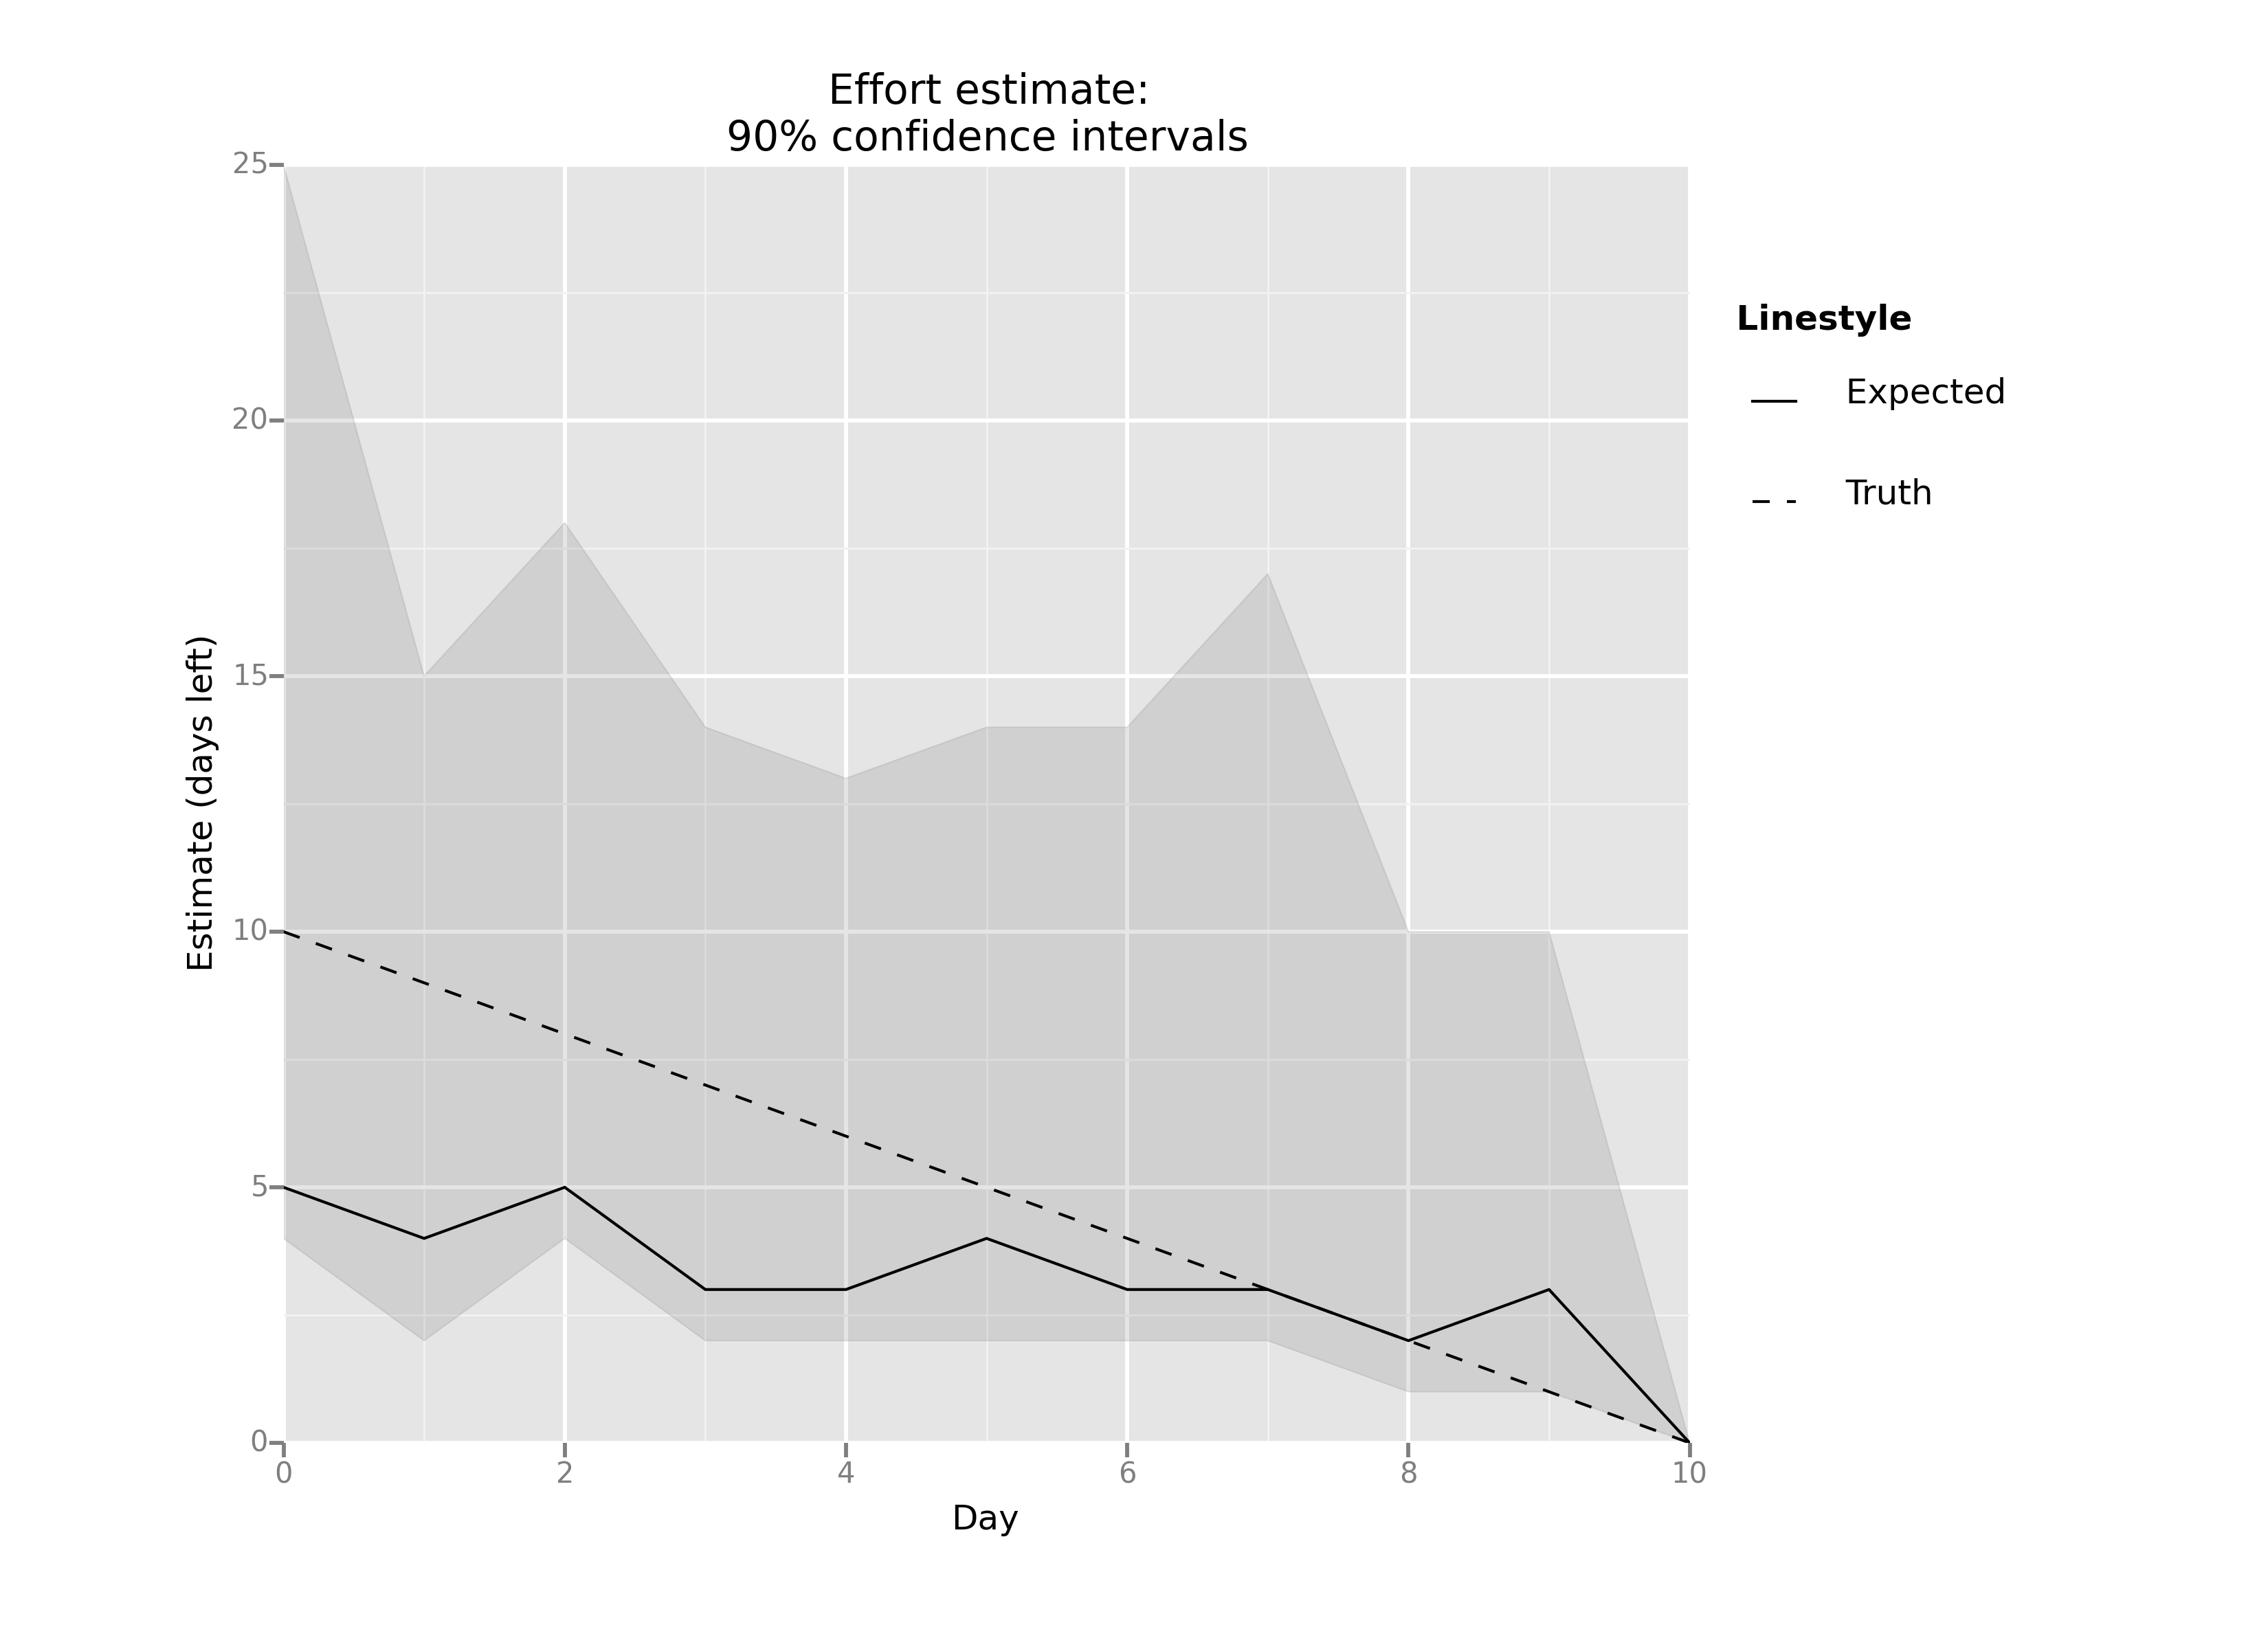
The dashed line is the “truth”: it’s what my estimate would have been if I had estimated perfectly each day. The shaded region represents my 90% confidence estimate: I was 90% confident that the amount of time left fell into that region. The solid line is the traditional pointwise effort estimate: it was my best guess as to how many days I had left before the feature would be complete.
If we subtract out the “truth” from the other lines, we can see the error in my estimate for each day:

Some observations:
- The 90% confidence interval always included the true value, which gives me hope that this an effective estimation approach.
- My pointwise estimate underestimated the true time remaining for 9 out of 10 days.
- My first pointwise estimate started off by a factor of two (estimate of 5 days versus an actual of 10 days), and got steadily better over time.
I generated these plots using IPython and the ggplot library. You can see my IPython notebook on my website with details on how these plots were made.
